Project 3: Linear Estimation of Reading Ability - MGSC 331 Summer 2019
VerifiedAdded on 2022/10/09
|12
|1637
|451
Project
AI Summary
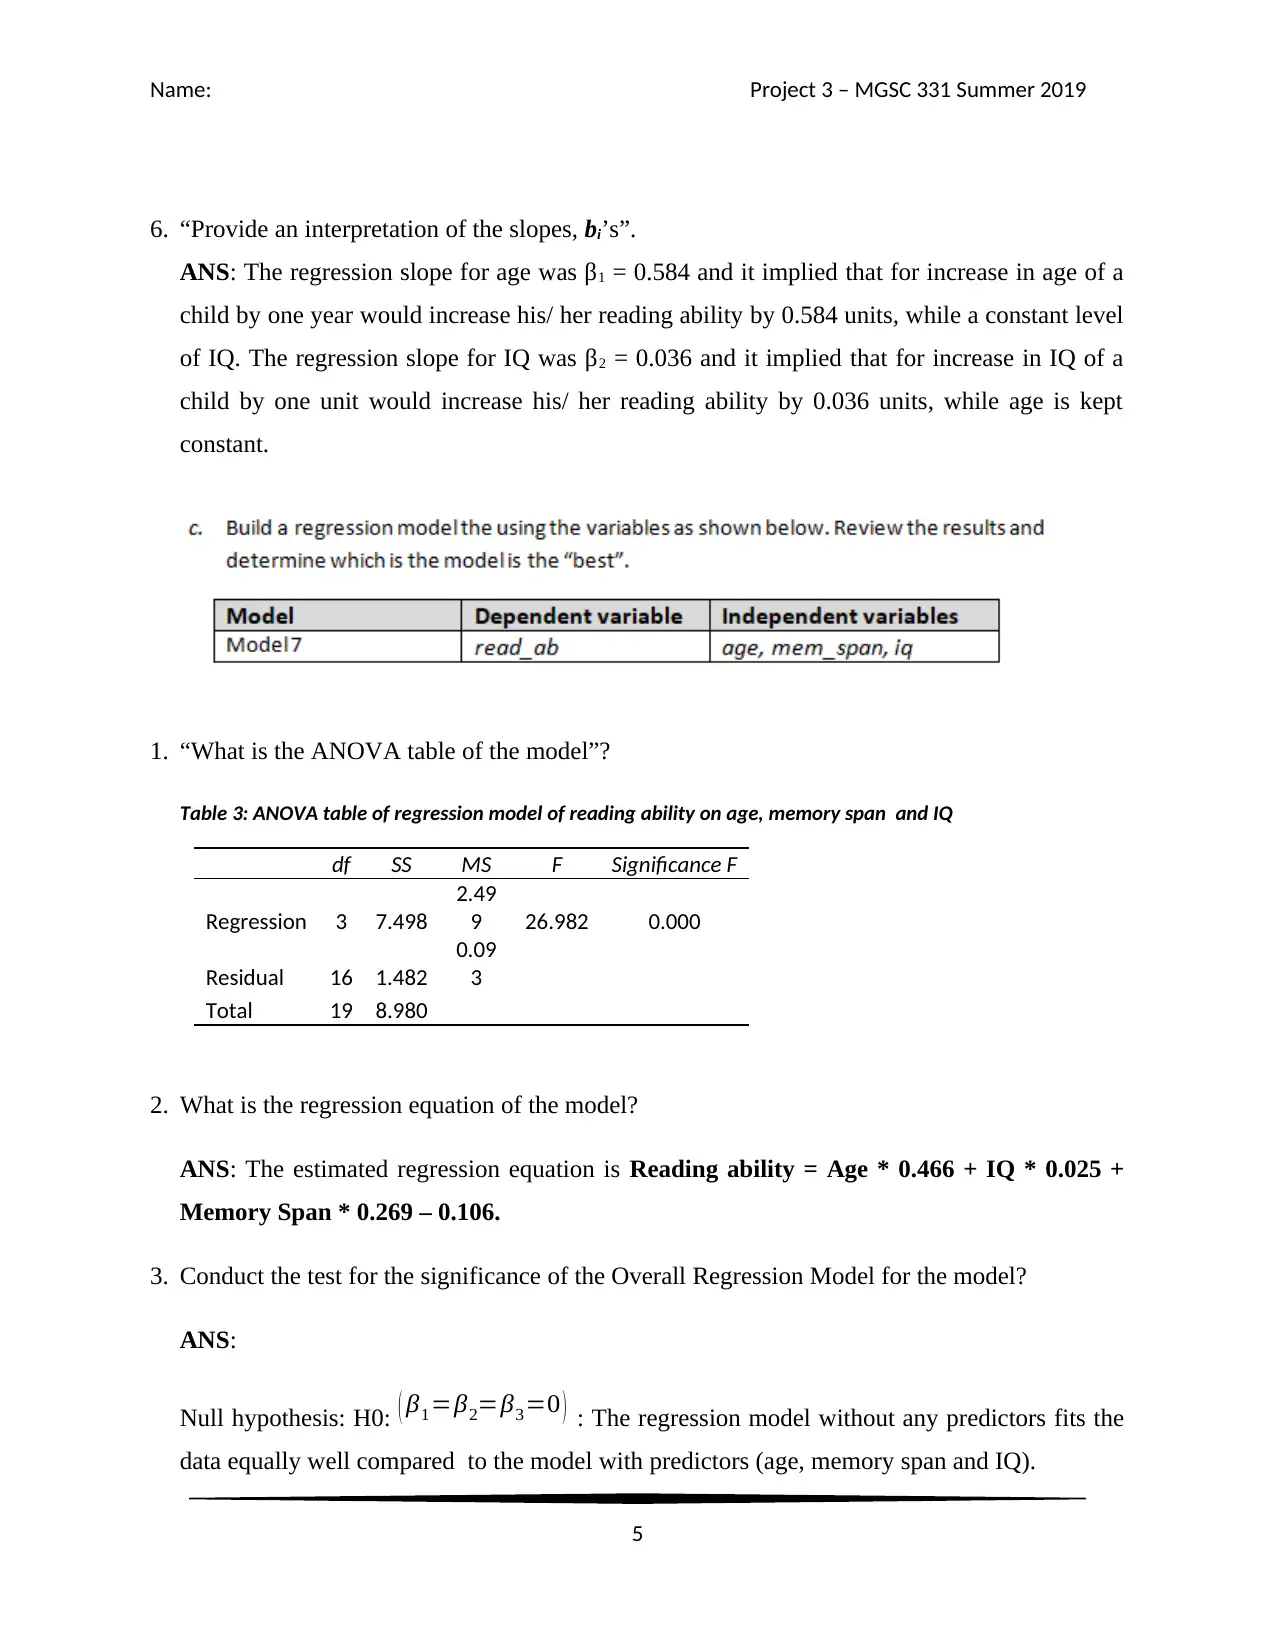
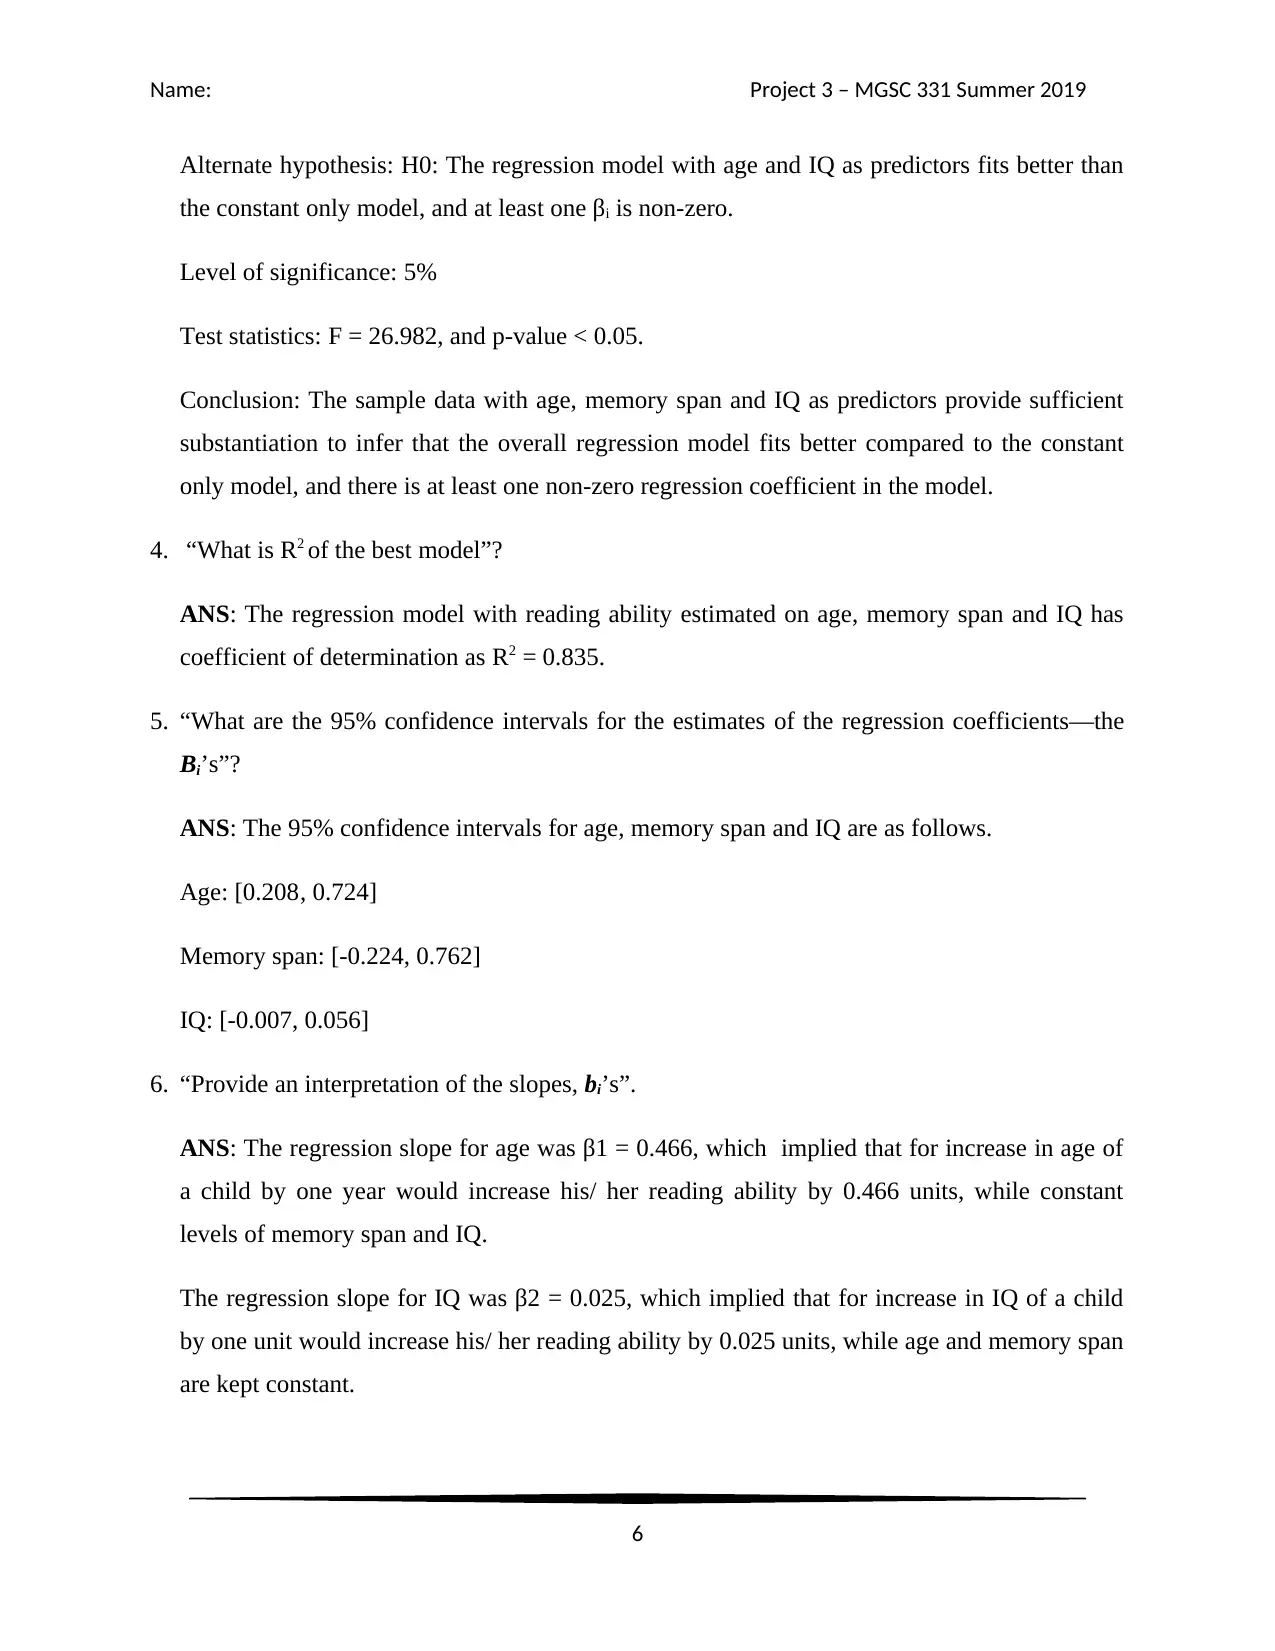
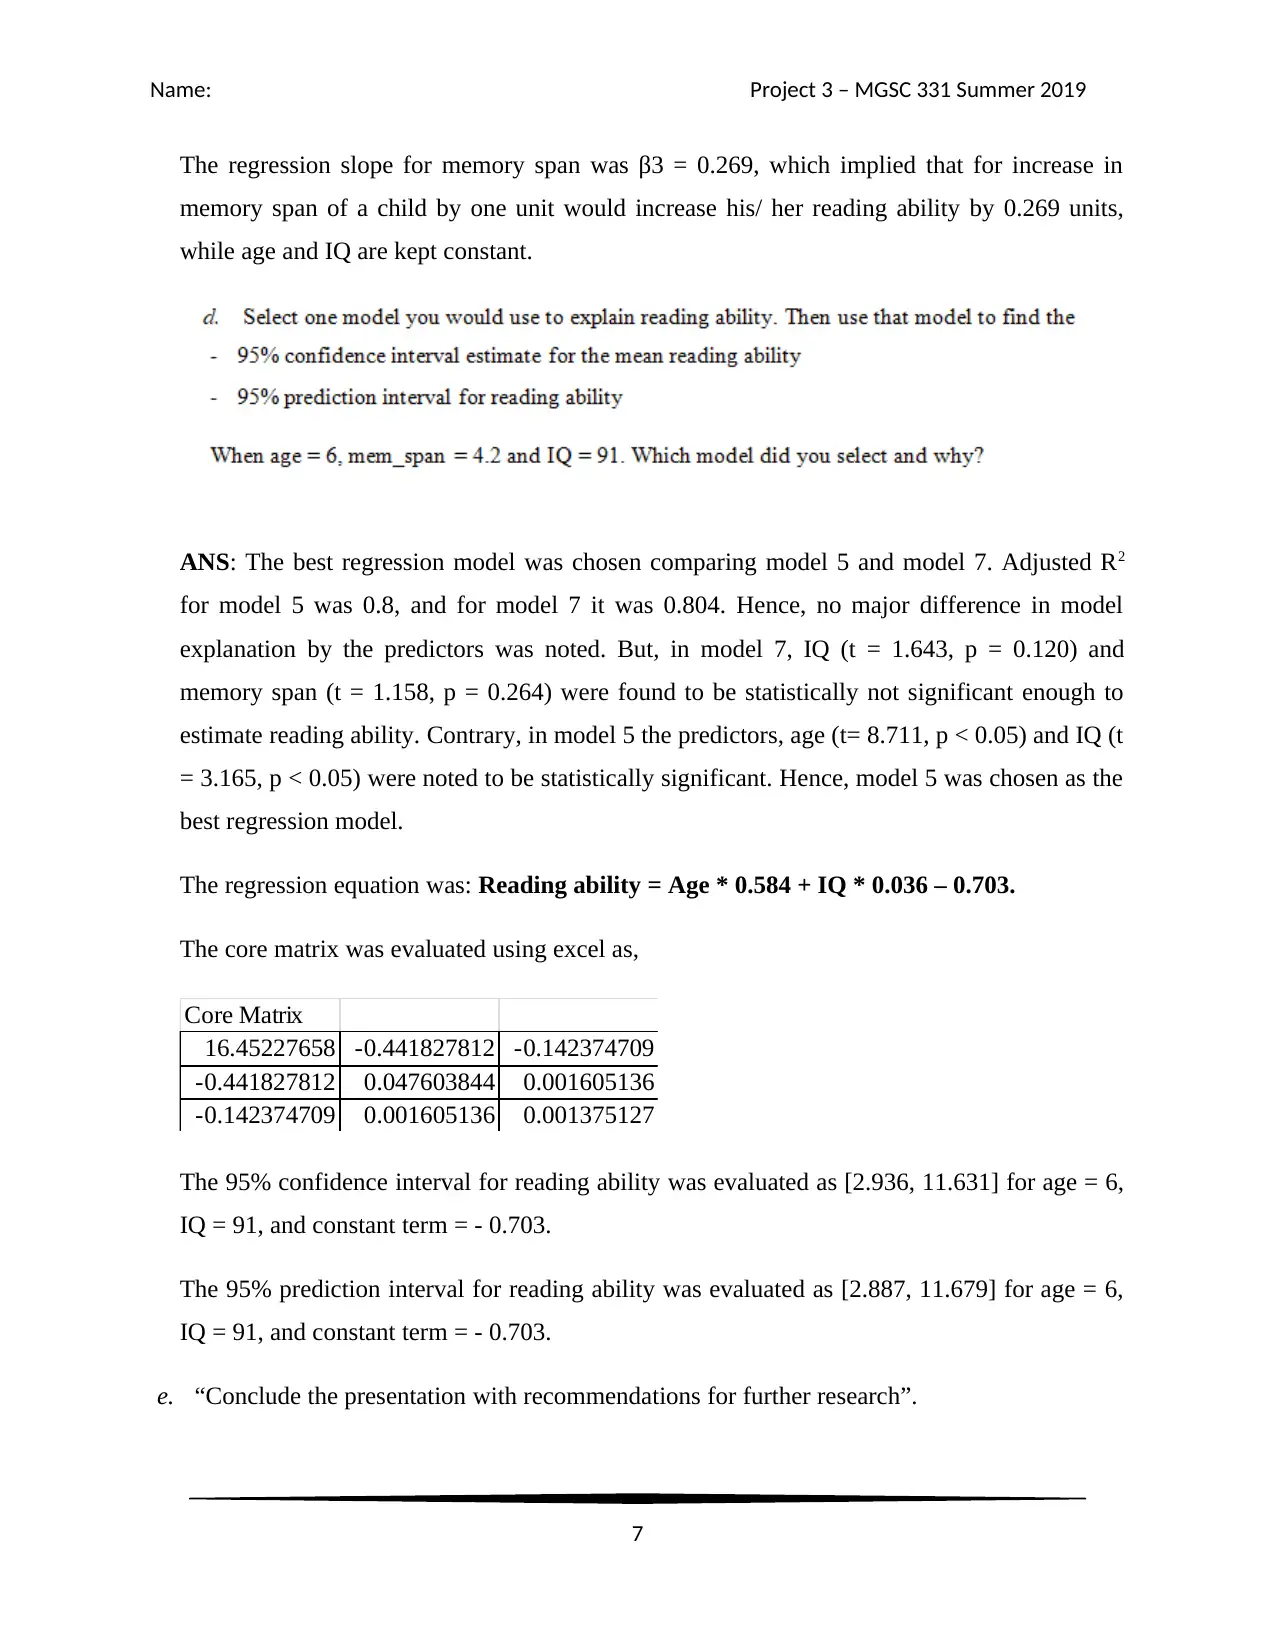
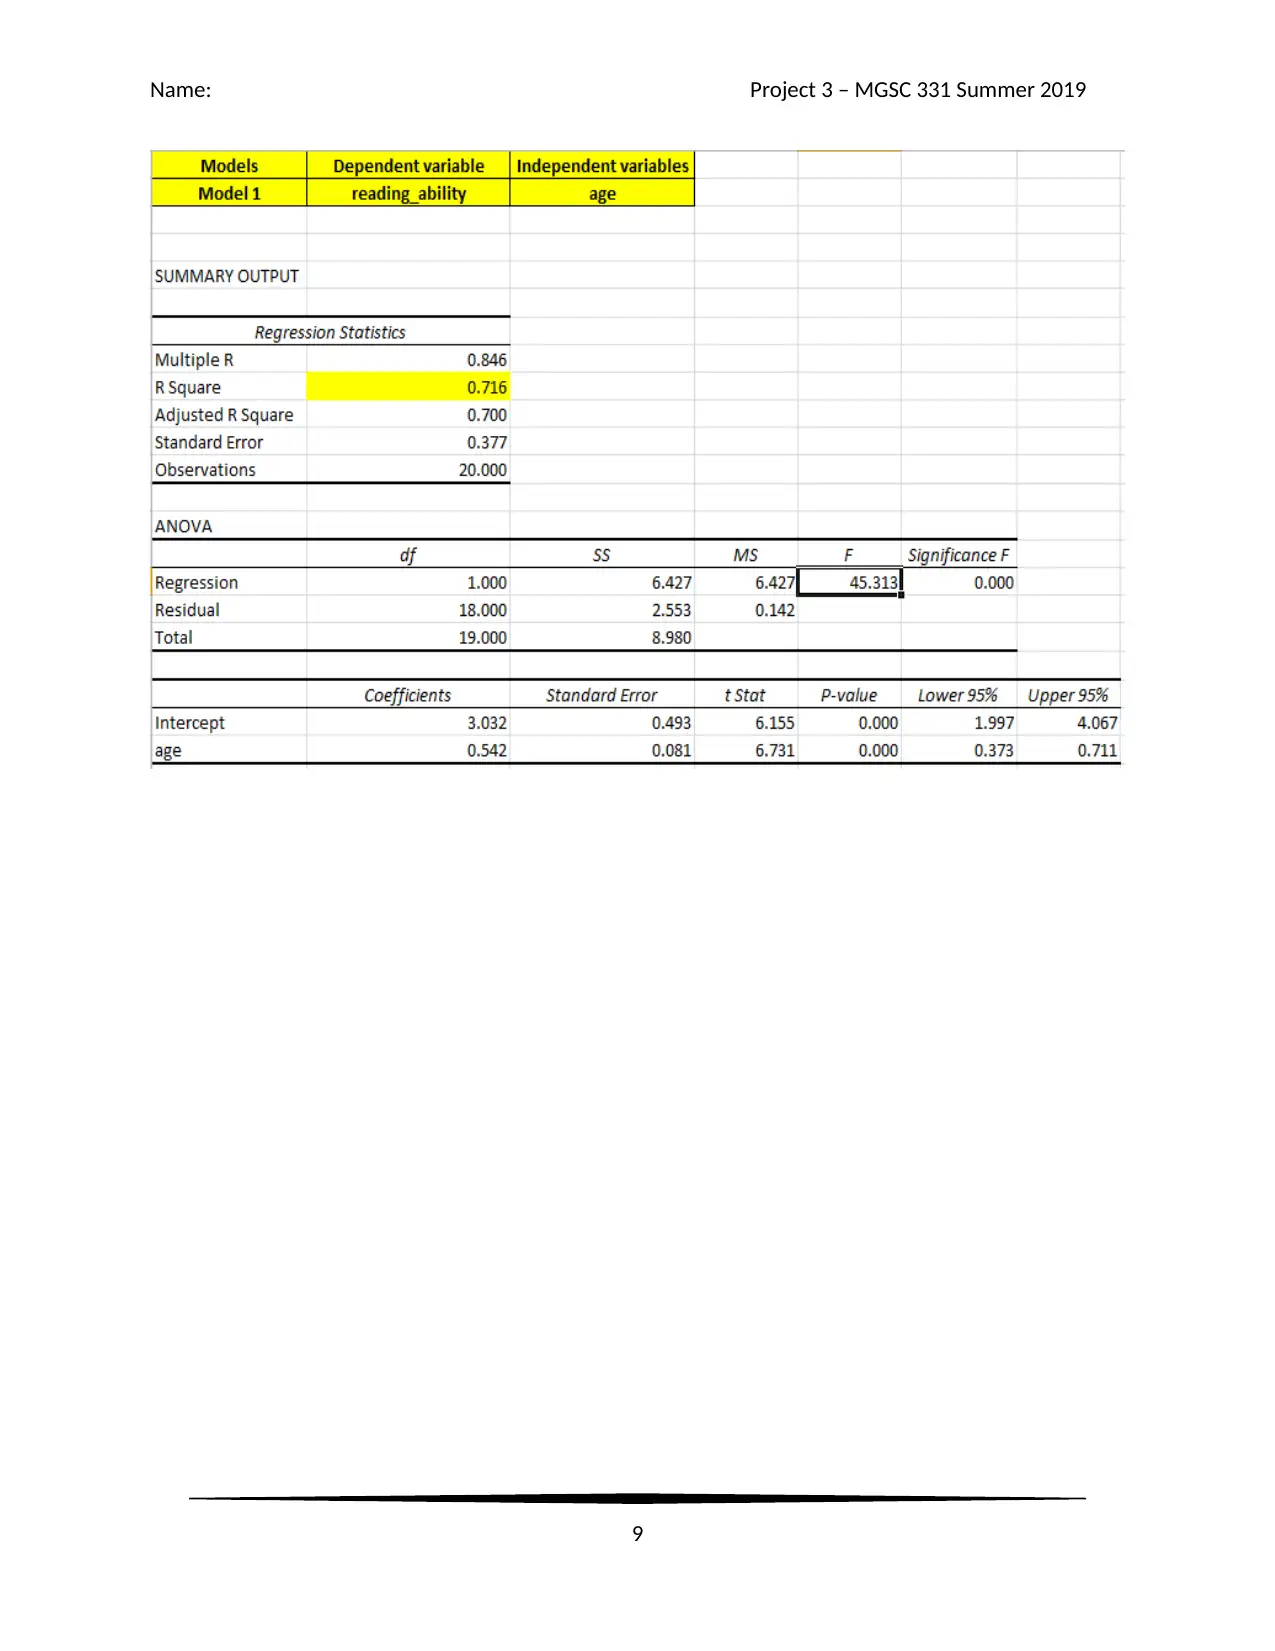
This document presents a comprehensive solution to Project 3 from MGSC 331, focusing on the linear estimation of a child's reading ability based on age, memory span, and IQ. The project involves multiple regression analyses, including the creation and interpretation of ANOVA tables, regression equations, and R-squared values for different models. The solution provides interpretations of regression coefficients, confidence intervals, and tests for the significance of the overall regression models. The analysis compares different models, identifies the best-fitting model, and offers recommendations for future research, including the suggestion for a longitudinal study with a larger sample size. The solution also includes relevant references and appendices with model outputs. The analysis utilizes statistical methods and provides a detailed breakdown of the results, offering insights into the factors influencing reading ability and the importance of statistical significance.
Contribute Materials
Your contribution can guide someone’s learning journey. Share your
documents today.

Name: Project 3 – MGSC 331 Summer 2019
Linear Estimation of Reading ability of a child on age, memory span, and IQ
1
Linear Estimation of Reading ability of a child on age, memory span, and IQ
1
Secure Best Marks with AI Grader
Need help grading? Try our AI Grader for instant feedback on your assignments.

Name: Project 3 – MGSC 331 Summer 2019
1. "What is the ANOVA table of the best model”?
ANS: The best regression model was reading ability estimated by age with R2 = 0.716,
implying that age of children in the sample was able to explain 71.6% variation in reading
ability. The corresponding ANOVA table has been provided underneath.
Table 1: ANOVA table of regression model of reading ability on age
df SS MS F
Significance
F
Regressio
n 1 6.427 6.427 45.313 0.000
Residual 18 2.553 0.142
Total 19 8.980
2. “What is the regression equation of the best model”?
ANS: The estimated regression equation is Reading ability = 3.032 +Age * 0.542
3. “Conduct the test for the significance of the Overall Regression Model for the best model”?
ANS:
Null hypothesis: H0: ( β=0 ) : The regression model without any predictor fits the data equally
well (model with constant only fits equally good compared to model with the predictor age).
Alternate hypothesis: H0: ( β≠0 ) : The regression model with age as predictor fits better than
the constant only model.
Level of significance: 5%
2

Name: Project 3 – MGSC 331 Summer 2019
Test statistics: F = 45.313, and p-value < 0.05.
Conclusion: The sample data with age as the predictor provides sufficient substantiation to
infer that the overall regression model fits better compared to the constant only model.
4. “What is R2 of the best model”?
ANS: The best regression model was reading ability estimated by age with R2 = 0.716
5. “For the best model, what are the 95% confidence intervals for the estimates of the regression
coefficients—the Bi’s”?
ANS: The 95% confidence interval for Bi of age was [0.373, 0.711], implying that there was
95% chance that regression coefficient of age would be somewhere between 0.373 and 0.711.
6. “Provide an interpretation of the slopes, bi’s”.
ANS: The regression slope for age was β1 = 0.542, which implied that for increase in age of a
child by one year would increase his/ her reading ability by 0.542 units.
1. “What is the ANOVA table of the best model”?
ANS: The best regression model was reading ability estimated by age and IQ of children.
Table 2: ANOVA table of regression model of reading ability on age and IQ
df SS MS F
Significance
F
Regression 2.000 7.374 3.687 39.018 0.000
Residual 17.000 1.606 0.094
Total 19.000 8.980
3

Name: Project 3 – MGSC 331 Summer 2019
2. “What is the regression equation of the best model”?
ANS: The estimated regression equation is Reading ability = Age * 0.584 + IQ * 0.036 –
0.703.
3. “Conduct the test for the significance of the Overall Regression Model for the best model”?
ANS:
Null hypothesis: H0: ( β1=β2=0 ) : The regression model without any predictors fits the data
equally well compared to the model with predictors (age and IQ).
Alternate hypothesis: H0: The regression model with age and IQ as predictors fits better than
the constant only model, and at least one βi is non-zero.
Level of significance: 5%
Test statistics: F = 39.018, and p-value < 0.05.
Conclusion: The sample data with age and IQ as predictors provide sufficient substantiation to
infer that the overall regression model fits better compared to the constant only model, and
there is at least one non-zero regression coefficient in the model.
4. “What is R2 of the best model”?
ANS: The best regression model with reading ability estimated by age and IQ has R2 = 0.821.
5. “For the best model, what are the 95% confidence intervals for the estimates of the regression
coefficients—the Bi’s”?
ANS: The 95% confidence interval for β1 for age was [0.443, 0.726], and 95% confidence
interval for β2 for IQ was [0.012, 0.060].
4
Secure Best Marks with AI Grader
Need help grading? Try our AI Grader for instant feedback on your assignments.

Name: Project 3 – MGSC 331 Summer 2019
6. “Provide an interpretation of the slopes, bi’s”.
ANS: The regression slope for age was β1 = 0.584 and it implied that for increase in age of a
child by one year would increase his/ her reading ability by 0.584 units, while a constant level
of IQ. The regression slope for IQ was β2 = 0.036 and it implied that for increase in IQ of a
child by one unit would increase his/ her reading ability by 0.036 units, while age is kept
constant.
1. “What is the ANOVA table of the model”?
Table 3: ANOVA table of regression model of reading ability on age, memory span and IQ
df SS MS F Significance F
Regression 3 7.498
2.49
9 26.982 0.000
Residual 16 1.482
0.09
3
Total 19 8.980
2. What is the regression equation of the model?
ANS: The estimated regression equation is Reading ability = Age * 0.466 + IQ * 0.025 +
Memory Span * 0.269 – 0.106.
3. Conduct the test for the significance of the Overall Regression Model for the model?
ANS:
Null hypothesis: H0: ( β1=β2=β3=0 ) : The regression model without any predictors fits the
data equally well compared to the model with predictors (age, memory span and IQ).
5

Name: Project 3 – MGSC 331 Summer 2019
Alternate hypothesis: H0: The regression model with age and IQ as predictors fits better than
the constant only model, and at least one βi is non-zero.
Level of significance: 5%
Test statistics: F = 26.982, and p-value < 0.05.
Conclusion: The sample data with age, memory span and IQ as predictors provide sufficient
substantiation to infer that the overall regression model fits better compared to the constant
only model, and there is at least one non-zero regression coefficient in the model.
4. “What is R2 of the best model”?
ANS: The regression model with reading ability estimated on age, memory span and IQ has
coefficient of determination as R2 = 0.835.
5. “What are the 95% confidence intervals for the estimates of the regression coefficients—the
Bi’s”?
ANS: The 95% confidence intervals for age, memory span and IQ are as follows.
Age: [0.208, 0.724]
Memory span: [-0.224, 0.762]
IQ: [-0.007, 0.056]
6. “Provide an interpretation of the slopes, bi’s”.
ANS: The regression slope for age was β1 = 0.466, which implied that for increase in age of
a child by one year would increase his/ her reading ability by 0.466 units, while constant
levels of memory span and IQ.
The regression slope for IQ was β2 = 0.025, which implied that for increase in IQ of a child
by one unit would increase his/ her reading ability by 0.025 units, while age and memory span
are kept constant.
6

Name: Project 3 – MGSC 331 Summer 2019
The regression slope for memory span was β3 = 0.269, which implied that for increase in
memory span of a child by one unit would increase his/ her reading ability by 0.269 units,
while age and IQ are kept constant.
ANS: The best regression model was chosen comparing model 5 and model 7. Adjusted R2
for model 5 was 0.8, and for model 7 it was 0.804. Hence, no major difference in model
explanation by the predictors was noted. But, in model 7, IQ (t = 1.643, p = 0.120) and
memory span (t = 1.158, p = 0.264) were found to be statistically not significant enough to
estimate reading ability. Contrary, in model 5 the predictors, age (t= 8.711, p < 0.05) and IQ (t
= 3.165, p < 0.05) were noted to be statistically significant. Hence, model 5 was chosen as the
best regression model.
The regression equation was: Reading ability = Age * 0.584 + IQ * 0.036 – 0.703.
The core matrix was evaluated using excel as,
Core Matrix
16.45227658 -0.441827812 -0.142374709
-0.441827812 0.047603844 0.001605136
-0.142374709 0.001605136 0.001375127
The 95% confidence interval for reading ability was evaluated as [2.936, 11.631] for age = 6,
IQ = 91, and constant term = - 0.703.
The 95% prediction interval for reading ability was evaluated as [2.887, 11.679] for age = 6,
IQ = 91, and constant term = - 0.703.
e. “Conclude the presentation with recommendations for further research”.
7
Paraphrase This Document
Need a fresh take? Get an instant paraphrase of this document with our AI Paraphraser

Name: Project 3 – MGSC 331 Summer 2019
ANS: A longitudinal study with more than 50 children will be few scope of future research
for estimating reading ability on age, memory span and IQ. Large sample size will boost the
reliability of the regression model results. Particularly, collecting pre and post period data will
provide the scope for comparative study for reading ability (Alloway, & Alloway, 2010).
References
Alloway, T. P., & Alloway, R. G. (2010). Investigating the predictive roles of working memory
and IQ in academic attainment. Journal of experimental child psychology, 106(1), 20-29.
Appendices
Model 1
8

Name: Project 3 – MGSC 331 Summer 2019
9
9

Name: Project 3 – MGSC 331 Summer 2019
Model 2
Model 3
10
Model 2
Model 3
10
Secure Best Marks with AI Grader
Need help grading? Try our AI Grader for instant feedback on your assignments.

Name: Project 3 – MGSC 331 Summer 2019
Model 5
Model 6
11
Model 5
Model 6
11

Name: Project 3 – MGSC 331 Summer 2019
Model 7
12
Model 7
12
1 out of 12

Your All-in-One AI-Powered Toolkit for Academic Success.
+13062052269
info@desklib.com
Available 24*7 on WhatsApp / Email
Unlock your academic potential
© 2024 | Zucol Services PVT LTD | All rights reserved.