Project Risk Management Budget Report: Monte Carlo Simulation Analysis
VerifiedAdded on 2022/11/26
|33
|5441
|215
Report
AI Summary
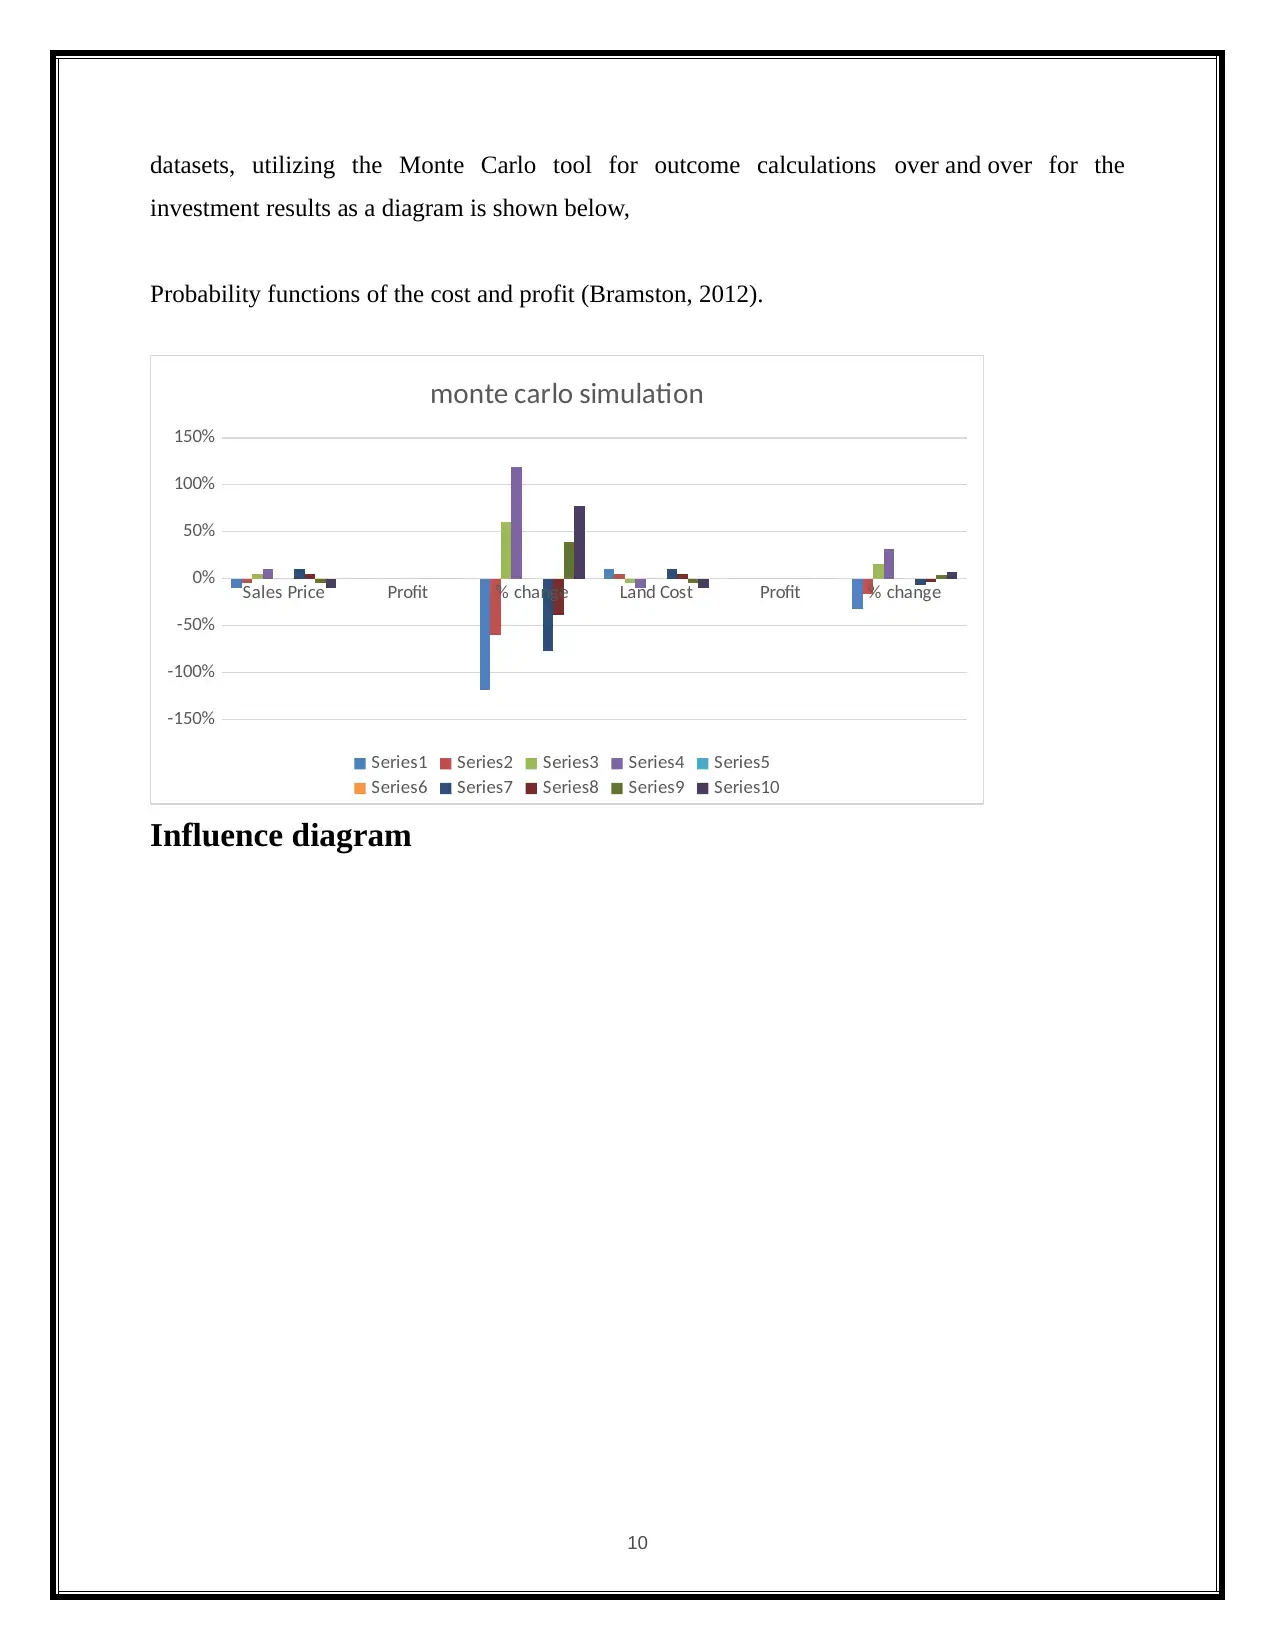
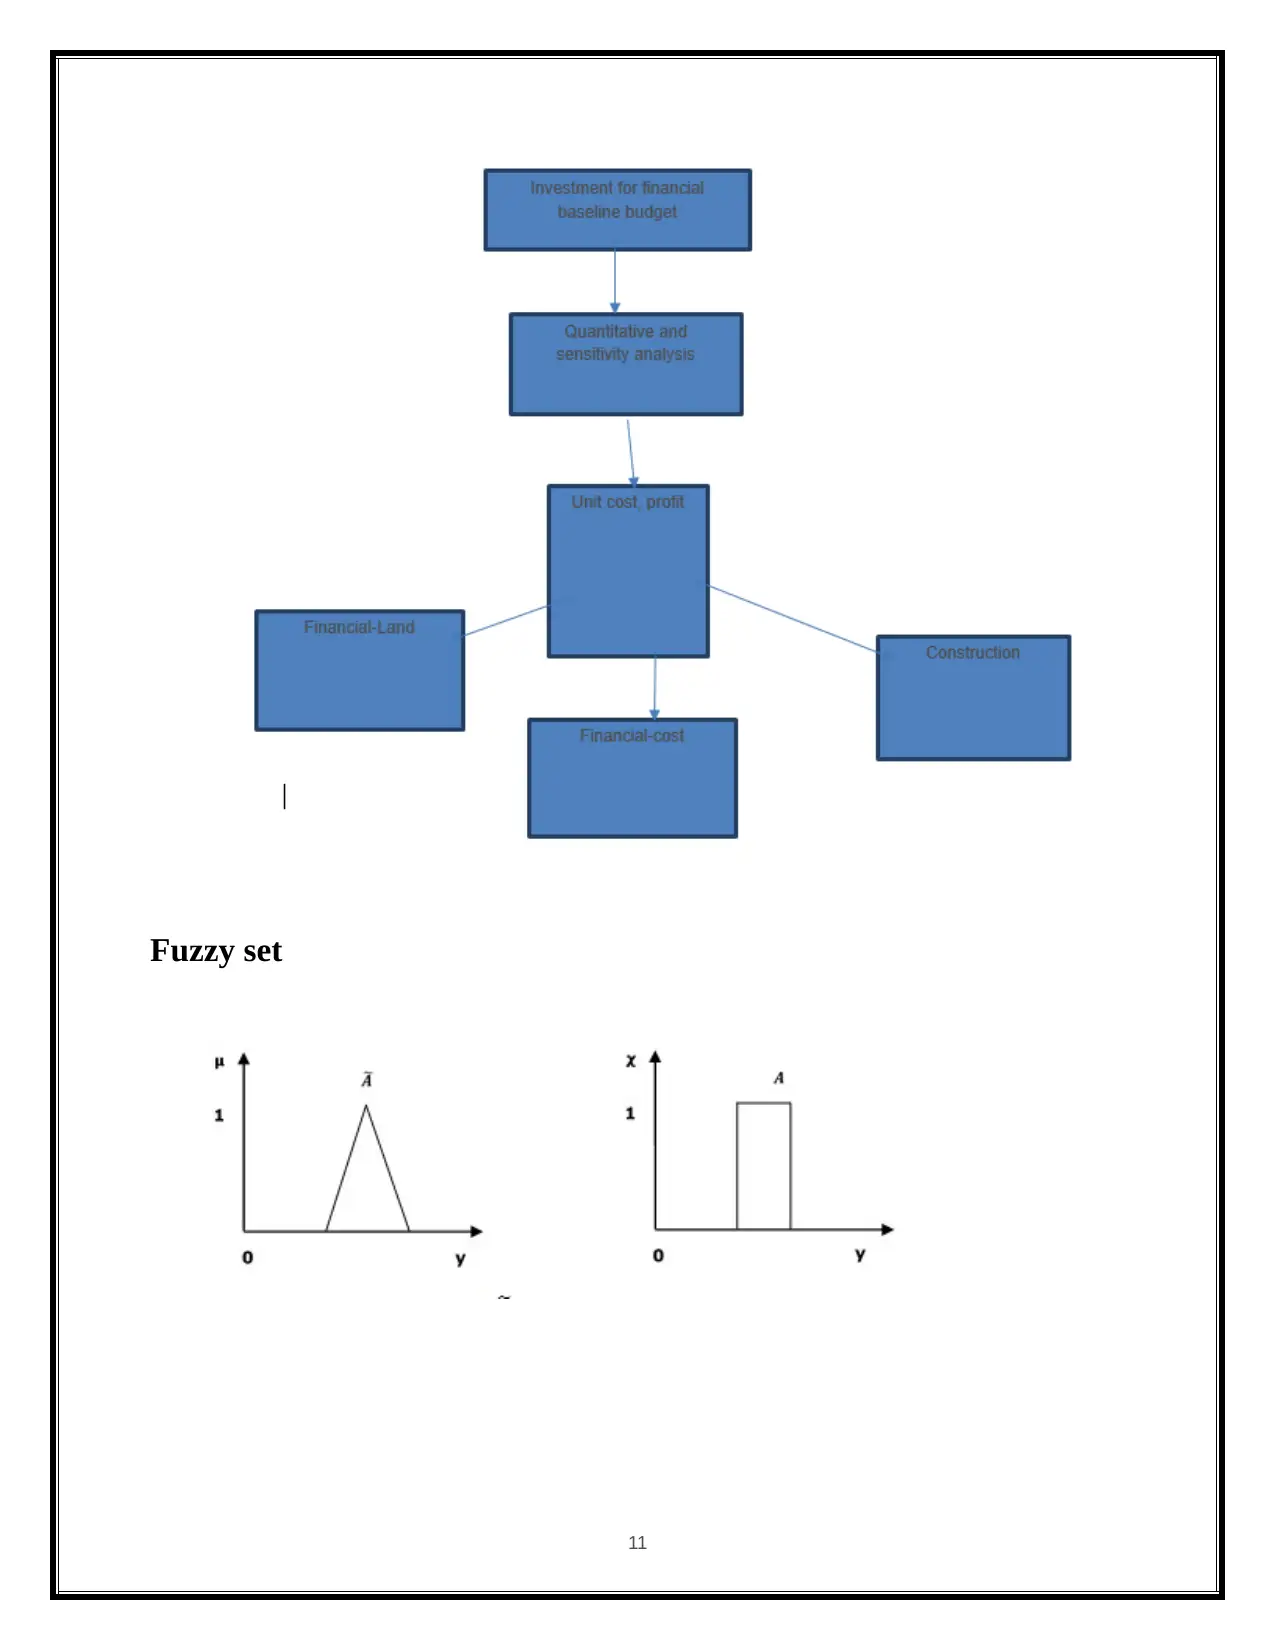
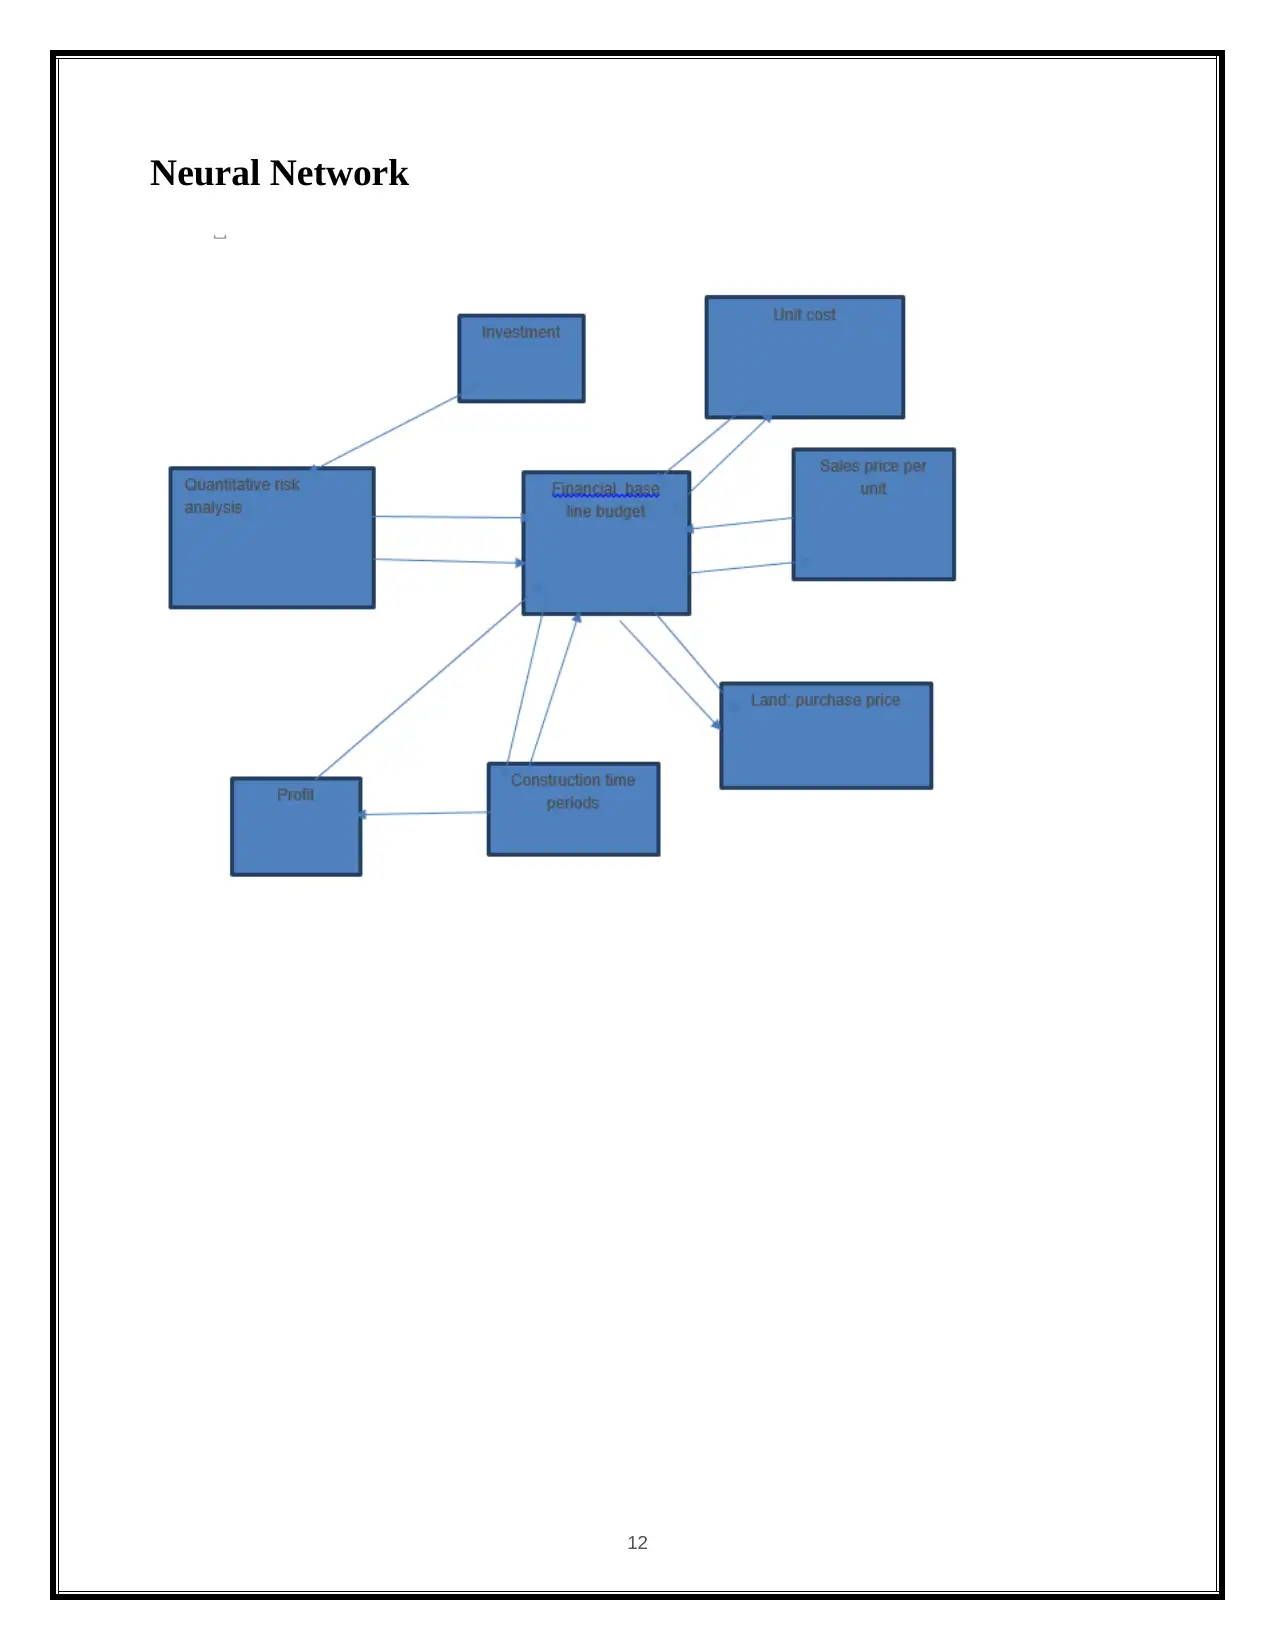
This project management report provides a detailed analysis of project risk and budget, utilizing quantitative risk analysis techniques and Monte Carlo simulation. The report begins with an executive summary and defines the project scope. It presents a recommended baseline budget, including 10-30 cost variables, followed by sensitivity analysis to assess the impact of variable changes. The analysis incorporates risk event evaluation, contingency recommendations, and the comparison of baseline budgets against organizational policy. The report employs various tools such as sensitivity analysis, event trees, probability analysis, and fuzzy set theory to evaluate risk factors. The main objective is to calculate numerical probabilities associated with risk factors using Microsoft Excel and Monte Carlo simulation. The sensitivity analysis helps in evaluating the nature of the risks involved, while the event tree analyzes the chronological series of events and their outcomes. The report includes a discussion on quantitative and qualitative risk analysis and the importance of data collection. It also examines the impact of different variables, such as sales price and construction costs, on project outcomes. The report concludes with a summary of findings and recommendations for managing project risks effectively.
Contribute Materials
Your contribution can guide someone’s learning journey. Share your
documents today.

Project Management
Student Name:
Register Number:
Submission Date:
1
Student Name:
Register Number:
Submission Date:
1
Secure Best Marks with AI Grader
Need help grading? Try our AI Grader for instant feedback on your assignments.

Executive summary
We shall be making calculation of the consequence for the involved risk, by carrying out the
financial management’s Risk Evaluation, utilizing the quantitative risk analysis on the numerical
values for the probability. Monte Carlo simulation of the palisade prediction shall be used for
this procedure. For the calculations and numerical values we shall use Microsoft Excel files.
The analysis of this project will be carried out by algorithms and techniques which are as given
below,
1. Probability analysis
2. Sensitivity analysis
3. Fault trees
4. Monte Carlo simulation
5. Fuzzy set theory
6. Influence diagrams
7. Event trees
8. Decision trees
9. Artificial neural networks.
For the analysis of the base line budgets, we shall be making use of the quantise analysis risk
and sensitivity analysis risk, in the initial part of this project. The second module consists of the
Statistics of the risk analysis and the third module consists of Probability of the risk analysis. For
the fourth module, Monte Carlo will be used for the risk analysis simulation. In the fifth and final
module, the contingency analysis of the eestimate, which allows any changes that experience
shows, will be carried out. The fundamental examination of the essential spending plan is $
135,000, $ 115,000, $ 100,000 and unit value 6. Presently, utilizing 9% of the utilization of
expert information, important information and master sentiments, the change of venture spending
plans, under 10% of the business cost, and $ 115,000 because of the likelihood of $ 102,500
because of all out overall revenue and all out benefit of the benefit, investigation will be finished.
The difference in affectability hazard investigation is under 10% of the benefit will be done. Less
than 10% of the profit is the sensitivity risk analysis. Simultaneously, the remaining value is $
64,167, while the sales price ($ 100,000) and the cost of construction ($ 75,000). Other models
are 10% lower (ie $ 65,000), 103,500), its highest value ($ 115,000) and all other, if the sales
2

price ($ 135,000) and sales model ($ 135,000). Highest values all are the variables, and then the
project will cost $ 11,167, which is less than -119% less than the 57833 dollar profit shall be
carried out.
3
project will cost $ 11,167, which is less than -119% less than the 57833 dollar profit shall be
carried out.
3

Table of Content
s
Project Scope................................................................................................................................................................... 4
Recommended Baseline Budget........................................................................................................................................ 5
Sensitivity analysis......................................................................................................................................................... 12
Risk Event analysis......................................................................................................................................................... 13
Contingency recommendation........................................................................................................................................ 15
Sensitivity analysis cost variable..................................................................................................................................... 17
Sensitivity risk event analysis......................................................................................................................................... 19
Comparing baseline budget on the organization policy probability.................................................................................23
Conclusion..................................................................................................................................................................... 24
Appendix....................................................................................................................................................................... 25
Reference....................................................................................................................................................................... 30
4
Secure Best Marks with AI Grader
Need help grading? Try our AI Grader for instant feedback on your assignments.

Project Scope
The main objective of this project is to calculate the values of the numerical probabilities
with the risk factor by utilizing in Microsoft, the Monte Carlo simulation of the palisade
prediction and by implementing the Quantitative risk evaluation. Sensitive Analysis is one of the
widely used quantitative risk analysis technique and tool to help the risk manager in evaluating
and for analysing the nature of Risk involved. To evaluate the consequences of the project
results, we will examine the changing values in the risk variables. The tools which we shall be
implementing for this project in the quantitative technique evaluation are, Sensitivity analysis
Event trees
Probability analysis
Monte Carlo simulation
Fuzzy set theory
Artificial neural networks.
Fault trees
Decision trees
Influence diagrams
The Sensitivity Analysis method is a popular and commonly used analytical methods, which is
utilized in all the different evaluations for the risk management, contains the following factors,
Identification
Profit
Cost
Schedule
Analysis
Investment
Treatment and control of risk events of the budget
Duration
5

Baseline estimates
As part of the analysis method, we shall be using different modules in the project. The quantise
analysis risk will be carried out by analysing the base line budgets and evaluating the sensitivity
analysis risk in the First module. The second module will be sued for the Statistics of the risk
analysis. The third module will be used for the Probability of the risk analysis. The fourth
module is the Monte Carlo simulation of the risk analysis. Contingency analysis of the estimate
allows changes in the project and this is implemented and investigated upon, forming the fifth
and the final module of the project.
Recommended Baseline Budget
Quantitative and Qualitative are the two types of Risk Analysis. By making use of the sensitivity
analysis in the project budgets for the risk management, we can evaluate the base line budget by
“Qualitative risk analysis”. The values and numerical techniques to express and measure the
value of uncertainty are done by the “Quantitative risk analysis”. By using this tool, a sense of
false impression of precision and reliability can be created. Inspite of the number of tools and
quantitative techniques available today, we should keep in mind that these are just for assisting in
the process of decision-making but they are not be used in the place of sound judgement. They
will be required in the project at different stages, as some these quantitative techniques and tools
are complex, sophisticated and easily available.
For the base line budgets and basically for the quantitative risk analysis, the below given
categories can be used,
1. Central tendency
2. Frequency distribution
3. Applying descriptive statistics
4. Measure of dispersion
Utilising the quantitative risk measurements, lot of ground work, information collecting, and data
gathering has to be carried out. The time and efforts required for conducting huge data collection
6

should be worthwhile and useful if it helps and assists in the risk management process.
Individual and people who have the responsibility of data gathering and the right accurate
method for this information collection, final result will get the validation for the procedure of
quantitative evaluation will depend on the right or wrong way of information collection.
Event Tree
Making use of the Boolean logic to test the chronological series of following events or its results,
an event is evaluated and there is an inductive analytical diagram is known as Even Tree. We
make use of the below parameters in our project for analysing of the data,
Duration
Budgets
Estimation of the budget baseline cost on the risk event on the budget
Risk analysis on the cost,
Budget baseline cost to be specified.
Below is the displayed image of our project’s “Event Tree”,
7
Paraphrase This Document
Need a fresh take? Get an instant paraphrase of this document with our AI Paraphraser

Fault Tree
Decision Tree
8
Decision Tree
8

Monte Carlo simulation
As the probability distribution is 32% for any given factor has the uncertainty inherent for taking
the value range of $632,167, in creating models in this project by utilizing the Monte Carlo tool
for simulating the risk analysis. Every time, a different set of random values is utilized from
9
As the probability distribution is 32% for any given factor has the uncertainty inherent for taking
the value range of $632,167, in creating models in this project by utilizing the Monte Carlo tool
for simulating the risk analysis. Every time, a different set of random values is utilized from
9

datasets, utilizing the Monte Carlo tool for outcome calculations over and over for the
investment results as a diagram is shown below,
Probability functions of the cost and profit (Bramston, 2012).
Sales Price Profit % change Land Cost Profit % change
-150%
-100%
-50%
0%
50%
100%
150%
monte carlo simulation
Series1 Series2 Series3 Series4 Series5
Series6 Series7 Series8 Series9 Series10
Influence diagram
10
Secure Best Marks with AI Grader
Need help grading? Try our AI Grader for instant feedback on your assignments.

Fuzzy set
11
11

Neural Network
12
12

Sensitivity analysis
We shall be making use of the Sensitivity Analysis technique of investigating for the output
model (e.g. profit, schedule, and budget) of the modifications and variables in the original
presumptions and parameters for variable input values. The uncertainty in the output of a
mathematical system or model can be classified and given to various sources of input
uncertainties, and this is the principle used when we are using the Sensitivity Analysis tool.
Utilising the credible optional forecasts or value parameters, the resultants for the project has to
be analysed, studied and the after results will be reported for this model. These uncertain values
are the outcomes of the “epistemic uncertainty” (knowledge) and the “aleatoric uncertainty”
(natural variability) (Lee and McCormick, 2011). Across a range of most likely results, we shall
be utilising a singular variable at a time and for keeping all but one parameter. Optimistic values
or Pessimistic value are the possible values for the range of the outcomes of this tool. $135, 000,
$115,000, $100,000 and the unit price is 6 for our case study. Utilising relevant data, expert data and 9%
of expert opinion, we can calculate the rate of the financial budget cost. Most of the variables used for this
are time consuming. They can increase by say 5%/10%/15% and decreases of 9%/10%/12%. As
this is a simple mechanical approach to the model, a detailed forecast for the values of the
pessimistic and optimistic values is not required (Davidson Frame 2014). There is no outcome
for the guidance by what is likely to be experienced, as there is no logical justification to the
extreme values. It is simple, quick to use and apply and this method is applicable to all the
parameters.
Initial unit’s prices of the baseline budget table,
Variable Column1 Scenario Column2
optimistic Likely Pessimistic
unit sales(#) 6 6 6
sales price per unit($) $135,000 $115,000 $100,000
Land:purchase price($) $160,000 $170,000 $200,000
Construction per unit($) $65,000 $70,000 $75000
Finance-interest rate (%) 9% 10% 12%
Time period(land)(month)* 1 2 3
13
Paraphrase This Document
Need a fresh take? Get an instant paraphrase of this document with our AI Paraphraser

Time period(construction)(month)** 6 8 12
Risk Event analysis
.
The variable risk and the fixed risk are the part of the risk analysis methodology. To keep the loss
(an undesirable outcome) at the minimum, the risk evaluation can be made for the potential that a
chosen or activity (including the choice of inaction). The "expected value" for personal risk
events is the accidental reserve size is based on. E.q for determining the crashes by utilizing the
expected value an assessment was included by making use of Risk Analysis (ERA) (Mac and
others, 1998). Calculate the allowance based on the average and maximum risk.
The two risks involved are
Fixed risk
Cost variable risk
Fixed risk
Whole of the events or not is the query here. Requirement is for more access road. No danger
will occur if this happens for the maximum cost occurrence.
Average cost = maximum cost * probability of its occurrence
Risk events will start happening with the maximum risk payments.
Variable risks
The outcomes are uncertain (e.g. depth Foundation bases) for occurring events. On the basis of
past experience Posts (e.g. maximum length of maximum), maximum risk allowance, will be
10% project team evaluation. Assuming that the mathematical relationship is maximally or
estimated the average risk allowance is approximate for 50% higher value. The environmental
effects of the fullness of the identifiable risk events, and for which the 50% risk positions were
selected as the worst values.
Below are the two outcomes of the evaluation of variable risk event:
one time variable time sponsor budget
Two time variable time sponsor budget
The one time variable budget produces a model (e.g. budget, schedule, investment) utilising
14

maximum mostly baseline approximates for all variables. Select the variables of uncertain value
to be subject to sensitivity analysis. In simple projects it may be practicable to analyse all
variables for sensitive of project outcomes. In more complex projects this may not be practicable.
Considerations in selecting a set of variables for sensitivity analysis are time and cost for
analysis is limited, only those variables that can be investigated quickly and cheaply are
analysed. Change the value of one variable, one at a time within a range of possible results,
whilst all other variables are held at their most probable outcomes. Evaluate the effect on the
project outcome (e.g. cost, duration, profit) for each change in value in the variable on the
uncertain variable.
Two times variable
An alternative approach can be to compare the effects on the project outcome of the changing
values of two variables at the same time. To the effects for the 2 varying variables
simultaneously, this provides a bit more improved understanding of the sensitivity of the project
results. All the other values give the most possible answers, than this project shall give outcome
as $64,167 as loss, in this example which are pessimistic values for construction cost ($75,000)
and the sale price ($100,000) to occur. Also, if the construction cost ($65,000) and the sale price
($135,000) are the optimistic values occurring without any change in the other values, than we
shall have $209,833 as profit. The variable cost for finding the optimistic for the total benefit is $
234,050 when compared to the following risk event.
Contingency recommendation
We shall consider risk of two types here and also we can consider of removing the probable
opportunities (first type). This gives us the fact that to identify only a fair probability is required
and where the accidents cover up all the risks. Other than this, we should define individually the
less important probables with more strength moods, cost-impact risks, etc. Management
existence has to be considered as another type of coincidence can manage the risk of the second
type. This is not the only one to be debated but there is also identification Process Group or
Project Group (described later is the two types of reversals). The initial to find the cost variable
of the maximum and minimum optimistic on the probability of contingency analysis is show in
15

below,
The determination values of the holidays analysis,
16
The determination values of the holidays analysis,
16
Secure Best Marks with AI Grader
Need help grading? Try our AI Grader for instant feedback on your assignments.

Like the work type and scope level definition, the percentage addition method is seen as the
qualitative nature, on the basis of approach subject by making use of the project functions and by
experience. On the basis of the project stage and the historical experience, many firms are
recommending contingency percentage levels.
Contingency percentages in cost estimates are,
17
qualitative nature, on the basis of approach subject by making use of the project functions and by
experience. On the basis of the project stage and the historical experience, many firms are
recommending contingency percentage levels.
Contingency percentages in cost estimates are,
17

Most sensitive analysis of cost variable
Evaluated by the quantitative risk assessment tool and the Sensitivity analysis, we shall
consider the modifications for the particular model parameter, affecting the result of the studied
model. Within the stipulated time of the project, to identify which task's duration with
uncertainty has the strongest correlation, we shall be making use of this tool. By applying the
relative sensitivity for each of the parameter, the risk manager considers all the parameters
required for the management action. The most sensitive analysis of the variable cost they can
used for the 2 types that are includes the,
One variable at time
Two variable at time
Once all these variables have been identified, those which are the most sensitive and the risks
involved with each of these parameters will be further analysed and studied. To know more about
these parameters and for a more detailed and in-depth value of the sensitive variables, use of
additional information and data analysis will be carried out. As per the data analysis and the
outcome from it, identify the tasks that are important or which are more sensitive to the project.
The sensitive ones can be given to the contractors for a fixed price contract after the parameters
can be taken up by the risk management team. Special precaution has to be taken for the decision
making process when the model is subject to a high degree of sensitivity and when there are
sensitive parameters being used for the project. Finding the cost profit on the parameters and the
values of the each sensitive task value is 690000 for the initial income of the 6 unit sales. $4,
20,000 which is derived after the analysing the risk management data is the cost variable on
construction profit (Leybourne, Warburton and Kanabar 2014). 10% of the evaluating total cost
profit gives the value of 170000 (reducing) for the land finance unit value as the 10 month of the
budget cost duration. The outcome from the finance-construction for value unit budget sales is
$4, 20,000, and for a period of eight months evaluation of model quantities values will result in
discount as 10% for the base line budget value of 926000 (reducing). Sales price is less than 10%
of total sales of $ 115,000 and they are the result of the probability shown on $ 103,500 and the
loss of most values is estimated at $ 11,167, -119% and $ 236000 for the total project risk
analysis. Transaction profits less than 10% value is the Sensitivity risk analysis.
18

To finding the one variable at time on the sensitivity analysis table,
A B C $ 1,15,000.00 D E F H
1
INCOM
E
2 unit sales 6 690000
3 cost
4 Land: $170,000
5 construction 6
₹
70,000.00 420000
6 finance-land $ 1,70,000.00 10 10% 170000
7
finance-
const 4,20,000.00₹ 8
10% 336000
8
Total
Costs 926000
9 PROFIT -236000
Changing the variable profit of the sensitivity table analysis,
Sales Price Profit % change Land Cost Profit % change
-10% $-11,167 -119% 10% $39,417 -32%
-5% $23,333 -60% 5% $48,625 -16%
5% $92,333 60% -5% $67,042 16%
10% $126,833 119% -10% $76,250 32%
Construction
Cost Profit % change Interest Profit % change
Rate
10% $13,033 -77% 10% $53,617 -7%
5% $35,433 -39% 5% $55,725 -4%
-5% $80,233 39% -5% $59,942 4%
-10% $102,633 77% -10% $62,050 7%
Units are important for changes in sale prices. Prior to land acquisition before land acquisition (-
10%): More gathering of data for unit sales (-119%), for reducing the errors in prediction; Utilize
market aggressiveness for getting high or higher prices of sales; Prior sell off, try buying the land
19
Paraphrase This Document
Need a fresh take? Get an instant paraphrase of this document with our AI Paraphraser

at high or high price for selling. Infact, additional cost data of the cost of construction and
financial expenses on the baseline budget.
Two variable at time of the sensitivity analysis table,
Analysis risk of all variables in the risk analysis indicating the profit limit used in the three
phases of sensitivity analysis involving profit risk rate, profit confidence rate and profit
maximization. $ 234,050 check the sensitivity analysis risk factor and value in profits; Much of
the reliable $ 134,000 is the risk assessment loss and higher than $ 57,833
Effect on optimistic profit analysis,
20

Effect on loss pessimistic profit analysis,
21
21

Sensitivity risk event analysis
The outcomes for the variable inputs and modifying of the initial assumptions shall be
derived, by utilising the methodology of inspection of effect on the output of the model (like
profits, budget, and schedule). The fundamental analyses of the effects for the project's outcomes
with the same time result of recordings shall be done by using variables outputs within the
credible and model alternative assumptions. The fundamental step before calibration will be
carried out of all parameters for the sensitivity analysis. The uncertainty of the parameters used
in the project depends upon the effects of aleatoric, which the attempts to provide a measure of
the sensitivity of either parameters for Sensitivity analysis, or function forcing, or sub-models for
the variable states of higher interest in the model. The simplest utilised tool is the Sensitivity
analysis for the analysis for the risk of quantitative analysis, though the warning was given by
the variable recognizing which are very delicate model as utilised. The outcome result shall be
affected in the model and the result of the risk analysis, by the risk managers taking this tool as
they are experienced which shall affect the result from this model and the risk analysis results, to
know the sensitive parameters for the model shall give the outcome of the model and the risk
evaluation outcomes. Application for the sensitivity access of the outcome for the project which
will be a simple explicit recognition for the unknown related value for use (Mir and pinning ton
2014).
Two variables of the modifying values and including the mixed effects for the similar time
evaluation of the Sale price and construction costs, as in this example where we have considered
a pessimistic element like the sale price ($100,000) and the construction cost ($75,000)
happening for the similar time, then the resultant of the model shall be a loss of $64,167, with no
change in other parameters. Unlike let us think of the optimistic elements in the sale price
($135,000) and the construction cost ($65,000) happening, the result of which shall give this
model to a profit of $209,833, with no change in other parameters.
22
Secure Best Marks with AI Grader
Need help grading? Try our AI Grader for instant feedback on your assignments.

Calculating the risk event on the Loss Profit,
Keeping all the other parameters same, now shall evaluate effects for the delicateness for every
variable. We shall analyses the modification for the profit whilst all unchanged parameters and
keeping them at same likely values, by changing each variable one at a time, for example like
+10%/+5%/-5%/-10%. The project shall make a loss of $11,167, change of -119% well below
and likely profits for $57,833, where Sale Price was less 10% (i.e. $103,500) and most apt value
($115,000), and most likely value all the other variables. For cost budget investment (Project
Management Institute), the effect for the profit by varying every variable by +10%/+5%/-5%/-
10%,
Break event analysis
By unchanging every variable for the same value or most apt value, we shall analyse and test all
the variables for their break-even threshold limit value. The parameter will be removed from the
study if this out-come project value as risk manager calculates for the project which is lesser then
value of the break-even at the given parameter. The break-even evaluation is a pessimistic
23

viewpoint, as these levels will define the break-even element and the decision for this project for
continuation or not to final point where the risk managers shall take.
The risk factor analysis of the Quantitative techniques of the sensitive
analysis,
Construction Cost
Profit
% change
Interest
Profit
% change
-100% -80% -60% -40% -20% 0% 20% 40% 60% 80% 100%
0.1
0
-0.77
0.1
0
-0.07
0.05
0
-0.39
0.05
0
-0.04
-0.05
0
0.39
-0.05
0
0.04
-0.1
0
0.77
-0.1
0
0.07
Chart Title
Series4 Series3 Series2 Series1
Comparing baseline budget on the organization policy probability
Measuring the shareholders by acting the basic budgets or the control management. A
part of the project is approved project (80%) approved. If performance efficiency is acceptable
guidelines than, actual performance comparison is with performance efficiency. At least four
projects are included in the project. Usually the project budgets are set against the financial
sector guidelines that monitor against targeted targets for one year, but the project to monitor
specific areas of the project may require its own targets. One of the proposals is a set of
24

milestones and related activities in the project schedule.
The initial budget of the base line that can denote as, 1 to 70,000 months to set up the
financial land, starting from March 1 to 10 months. On January 30, the monthly report of the
17,000 budget ended only 10%. And $ 236000 only cannot complete the project's activities. The
project manager should set up budget tasks to monitor and do the project. Funding of the initial
budget should be $ 4, 20,000 in the monthly budget report; the plan was only 10% of the 336,000
expenditures planned for 8 months. Cost of the total for the project period is $ 926000. Total
sales were sold at $ 115,000, estimated at 11,167, -119%, and $ 236000, as sales totaled less than
10% and they were $ 103,500 loss. Less than 10% of the transaction profits is the Sensitivity risk
analysis. For the sales price changes the units are important. $ 234,050 Profit sensitivity analysis
detects risk; Higher than $ 57,833.
Now we analyze the sensitivity outcomes for every variable and no change in other
parameters. 10% / 5% / - 5% / - 10%, for example, profits need to be checked for transition and
all no change in parameter values and their often values. Now the sales price is 10 times less (ie
$ 103,500) and its highest value ($ 115,000), and all other variables. The reliable loss of $
134,000 risk assessment. Prior to land acquisition (-10%): To collect additional information
about unit sales (-119%), try to reduce the forecast errors; Marketing Aggressively application to
reach the highest or sale higher prices; Try to buy a higher or higher selling price before it sells.
In fact, more data on the cost constructions and financing costs are smaller risk management.
Conclusion
By making use of the Monte Carlo Quantitative tool and simulating the same on the
palisade prediction, we have evaluated and analyzed how the Quantitative Risk Analysis makes
use of the consequences of risk and the numerical values for the probability. Microsoft Excel will
be used for all the calculations of the Risk analysis, and same has been completed.
For analyzing and evaluating methods for this project and study, we have used the below tools,
Sensitivity analysis
Fault trees
25
Paraphrase This Document
Need a fresh take? Get an instant paraphrase of this document with our AI Paraphraser

Influence diagrams
Monte Carlo simulation
Probability analysis
Event trees
Decision trees
Fuzzy set theory
Artificial neural networks
The Sensitivity Analysis for the Risk Management has been successfully implemented
and utilized in the project by use of the below parameters,
Analysis
Duration
Investment
Profit/ Cost
Identification
Baseline estimates for all variable analysis
Treatment and control of risk events of the budget
Schedule
Used in the analysis and evaluation of the base line budgets for our project, we have finished
checking the various modules. The first module will be used of the investigation of the quantise
analysis risk and sensitivity analysis risk. The statistics of the risk evaluation shall be done by the
second module. In the third module Probability of the risk evaluation shall be done. The fourth
module will contain the Monte Carlo simulation of the risk analysis. The contingency analysis
will be carried out in the fifth and the final module to find the estimate value for changes that
may be required once the project is completed.
Appendix
Below are the values of the one cost variable is displayed,
Utilizing the most likely baseline estimates for all variable will produce a model (e.g. budget, schedule,
26

investment)
-150%
-100%
-50%
0%
50%
100%
150%
Chart Title
% change Land Cost Profit % change
The variation utilization for the variables are not controllable shall there be the parameters likely
in Risk management, which will then feel more sure in utilising the changing controls for the
controllable variables. The forecasted values of some of the parameters which are more or less
accurate and reliable, have omitted out of the analysis. With gaining more and also adequate
experience, the judgement of choosing the variables which are mostly delicate for the data can be
done. When for a given project, if there is limited time period and analysing the cost factor is
then simpler variables, lesser time taken and cheaper comparatively for investigation should be
selected first.
Selected values
Sales Price Profit % change Land Cost Profit % change
-10% $-11,167 -119% 10% $39,417 -32%
-5% $23,333 -60% 5% $48,625 -16%
5% $92,333 60% -5% $67,042 16%
10% $126,833 119% -10% $76,250 32%
Construction
Cost Profit % change Interest Profit % change
Rate
10% $13,033 -77% 10% $53,617 -7%
27

5% $35,433 -39% 5% $55,725 -4%
-5% $80,233 39% -5% $59,942 4%
-10% $102,633 77% -10% $62,050 7%
For one of the risk events Probability of occurrence
Frequency distribution event,
Column1 58 59 60 61 62 63 mid point
Frequency 1 1 4 2 3 1 87.5
Relative frequency 8.3 8.3 33.3 16.6 25 8.3 89
cumulative frequency 1 2 6 8 11 12 90.5
Relative cumulative
frequency
8.3 16.2 50 66.6 91.6 100 93.5
Absolute frequency, a Statistical term is the number of times particular data piece, or value,
happens during a trial or set of trials.
All the plotted values of all the events is shown below as a Frequency distribution diagram,
0 1 2 3 4 5 6 7
0
0.5
1
1.5
2
2.5
3
3.5
4
4.5
frequency distribution
Series2 Series4
28
Secure Best Marks with AI Grader
Need help grading? Try our AI Grader for instant feedback on your assignments.

0 1 2 3 4 5 6 7
0
2
4
6
8
10
12
14
Frequency cumulative
Correlation matrix
A variable shall have more of the effect for the output models, between the input/output
variables, as the bar is longer and the bar length is the “degree of correlation”. More effective of
the input variable has for the output variable, in case there has been correlation of higher degree
between the output / input variables, as measured by the “rank order correlation”. The top down
approach in a decreasing size of correlation is the normal method of the variables has to be
displayed. Where there are positive / negative correlations including placement, with a positive
correlation to right, left shall be negative correlation, and the outcome of this will be in the shape
of Tornado.
Note: “Negative correlation” means, decrease in the output variable or opposite increase with
an increase and decrease in an input variable. “Positive correlation” means a parallel
decrease / increase for the output variable with an increase or decrease in an input variable.
29

(note:
Construction Cost
Profit
% change
Interest
Profit
% change
-100% -80% -60% -40% -20% 0% 20% 40% 60% 80% 100%
0.1
0
-0.77
0.1
0
-0.07
0.05
0
-0.39
0.05
0
-0.04
-0.05
0
0.39
-0.05
0
0.04
-0.1
0
0.77
-0.1
0
0.07
Chart Title
Series4 Series3 Series2 Series1
Quantitative Budget Probability
53617 -7%
55725 -4%
59942 4%
62050 7%
13,033 10%
35,433 5%
80,233 -5%
1,02,633 -10%
39,417 10%
48,625 5%
67,042 -5%
76,250 -10%
30

Reference
Davidson Frame, J. 2014. "Reconstructing Project Management". Project Management
Journal45 (1): e2-e2. doi:10.1002/pmj.21387.
Leybourne, Steve A, Roger Warburton, and Vijay Kanabar. 2014. "Is Project Management
The New Management 2.0?". Organisational Project Management 1 (1): 16.
doi:10.5130/opm.v1i1.3959.
Mir, Farzana Asad, and Ashly H. Pinnington. 2014. "Exploring The Value Of Project
Management: Linking Project Management Performance And Project
31
Paraphrase This Document
Need a fresh take? Get an instant paraphrase of this document with our AI Paraphraser

Success". International Journal Of Project Management 32 (2): 202-217.
doi:10.1016/j.ijproman.2013.05.012.
32
doi:10.1016/j.ijproman.2013.05.012.
32

33
1 out of 33
Related Documents

Your All-in-One AI-Powered Toolkit for Academic Success.
+13062052269
info@desklib.com
Available 24*7 on WhatsApp / Email
Unlock your academic potential
© 2024 | Zucol Services PVT LTD | All rights reserved.