MSc Project Management: Risk Management in Projects, Teesside Uni
VerifiedAdded on 2023/06/12
|19
|2674
|71
Report
AI Summary
This report provides a comprehensive analysis of risk management in projects, specifically addressing a scenario for The Pulsometer Pump Company. It employs various decision-making criteria such as Maximax, Maximin, Minimax, EMV calculations, and Bayes' theorem to evaluate different strategies. The report also includes an excel simulation to assess insurance deductibles and their impact, along with a risk assessment using @RISK software. Furthermore, it includes network diagrams, variance calculations, and probability assessments for project completion, offering a detailed examination of risk exposure and mitigation strategies. This document is available on Desklib, a platform offering a wide range of study resources.

MSc PROJECT MANAGEMENT
Risk Management in Projects
Name of the Student
Name of the University
Risk Management in Projects
Name of the Student
Name of the University
Paraphrase This Document
Need a fresh take? Get an instant paraphrase of this document with our AI Paraphraser

Table of Contents
Answer to question 1....................................................................................................3
Answer to question 3:...................................................................................................6
Answer to question 4:...................................................................................................8
Answer to question 5:.................................................................................................13
References:................................................................................................................18
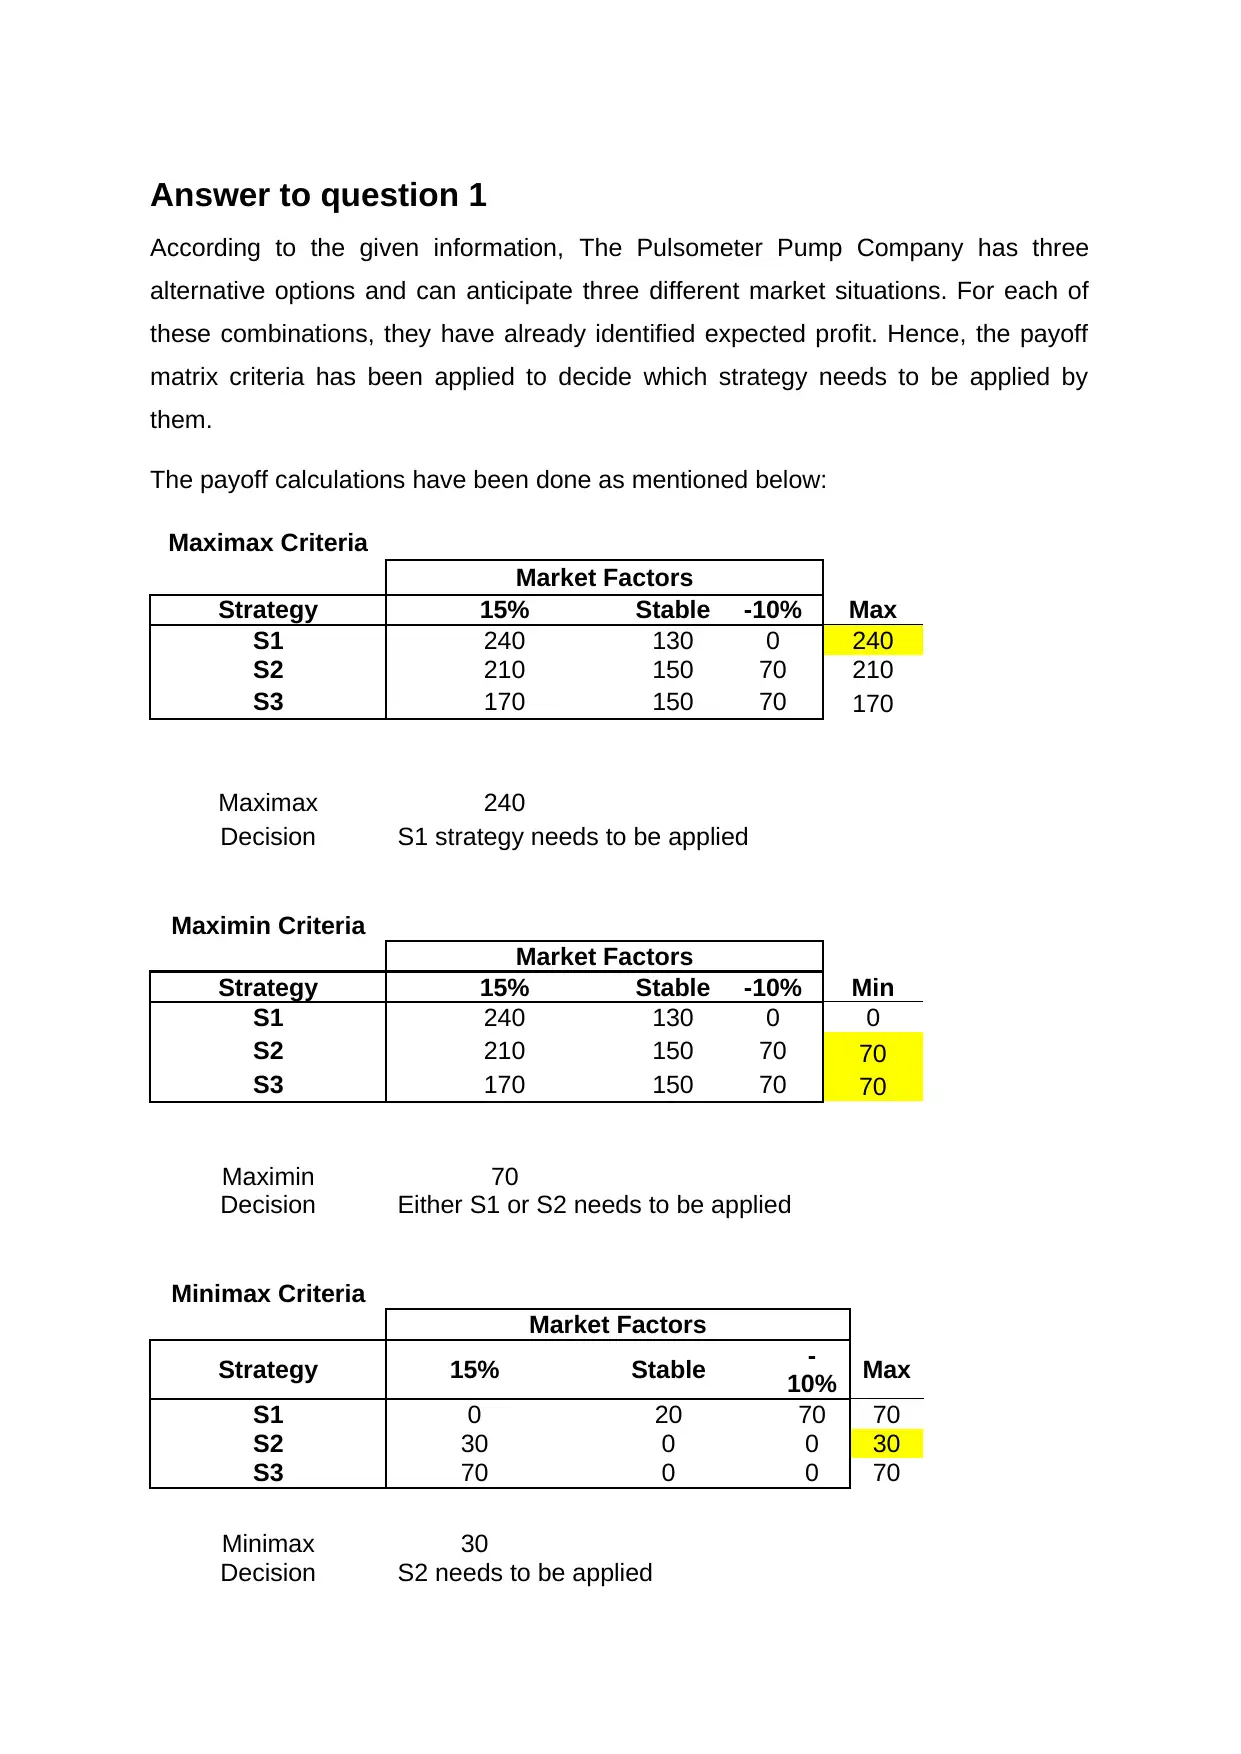
Answer to question 1
According to the given information, The Pulsometer Pump Company has three
alternative options and can anticipate three different market situations. For each of
these combinations, they have already identified expected profit. Hence, the payoff
matrix criteria has been applied to decide which strategy needs to be applied by
them.
The payoff calculations have been done as mentioned below:
Maximax Criteria
Market Factors
Strategy 15% Stable -10% Max
S1 240 130 0 240
S2 210 150 70 210
S3 170 150 70 170
Maximax 240
Decision S1 strategy needs to be applied
Maximin Criteria
Market Factors
Strategy 15% Stable -10% Min
S1 240 130 0 0
S2 210 150 70 70
S3 170 150 70 70
Maximin 70
Decision Either S1 or S2 needs to be applied
Minimax Criteria
Market Factors
Strategy 15% Stable -
10% Max
S1 0 20 70 70
S2 30 0 0 30
S3 70 0 0 70
Minimax 30
Decision S2 needs to be applied
⊘ This is a preview!⊘
Do you want full access?
Subscribe today to unlock all pages.
Trusted by 1+ million students worldwide

Paraphrase This Document
Need a fresh take? Get an instant paraphrase of this document with our AI Paraphraser
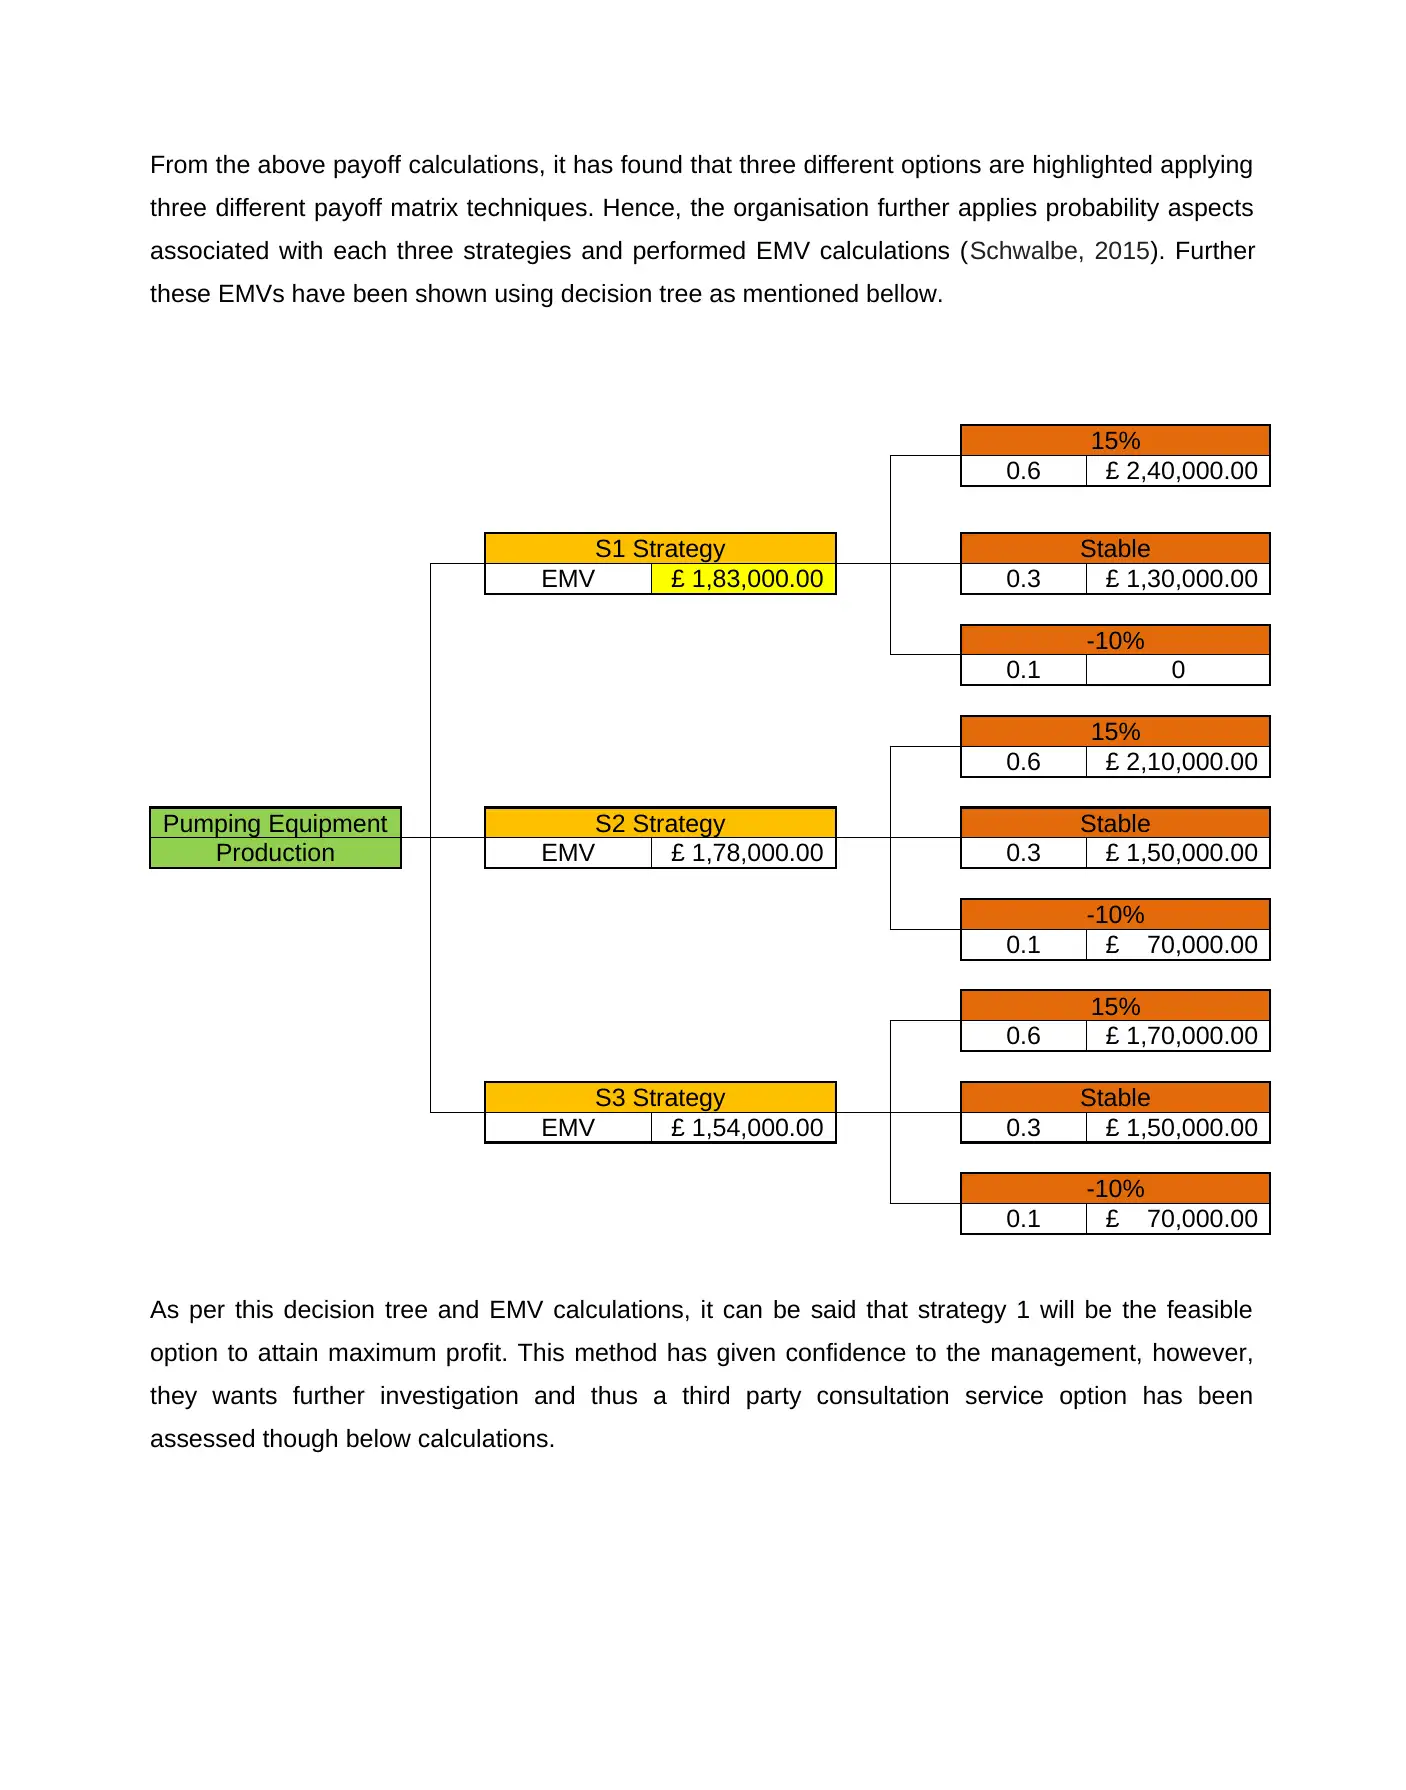
From the above payoff calculations, it has found that three different options are highlighted applying
three different payoff matrix techniques. Hence, the organisation further applies probability aspects
associated with each three strategies and performed EMV calculations (Schwalbe, 2015). Further
these EMVs have been shown using decision tree as mentioned bellow.
15%
0.6 £ 2,40,000.00
S1 Strategy Stable
EMV £ 1,83,000.00 0.3 £ 1,30,000.00
-10%
0.1 0
15%
0.6 £ 2,10,000.00
Pumping Equipment S2 Strategy Stable
Production EMV £ 1,78,000.00 0.3 £ 1,50,000.00
-10%
0.1 £ 70,000.00
15%
0.6 £ 1,70,000.00
S3 Strategy Stable
EMV £ 1,54,000.00 0.3 £ 1,50,000.00
-10%
0.1 £ 70,000.00
As per this decision tree and EMV calculations, it can be said that strategy 1 will be the feasible
option to attain maximum profit. This method has given confidence to the management, however,
they wants further investigation and thus a third party consultation service option has been
assessed though below calculations.
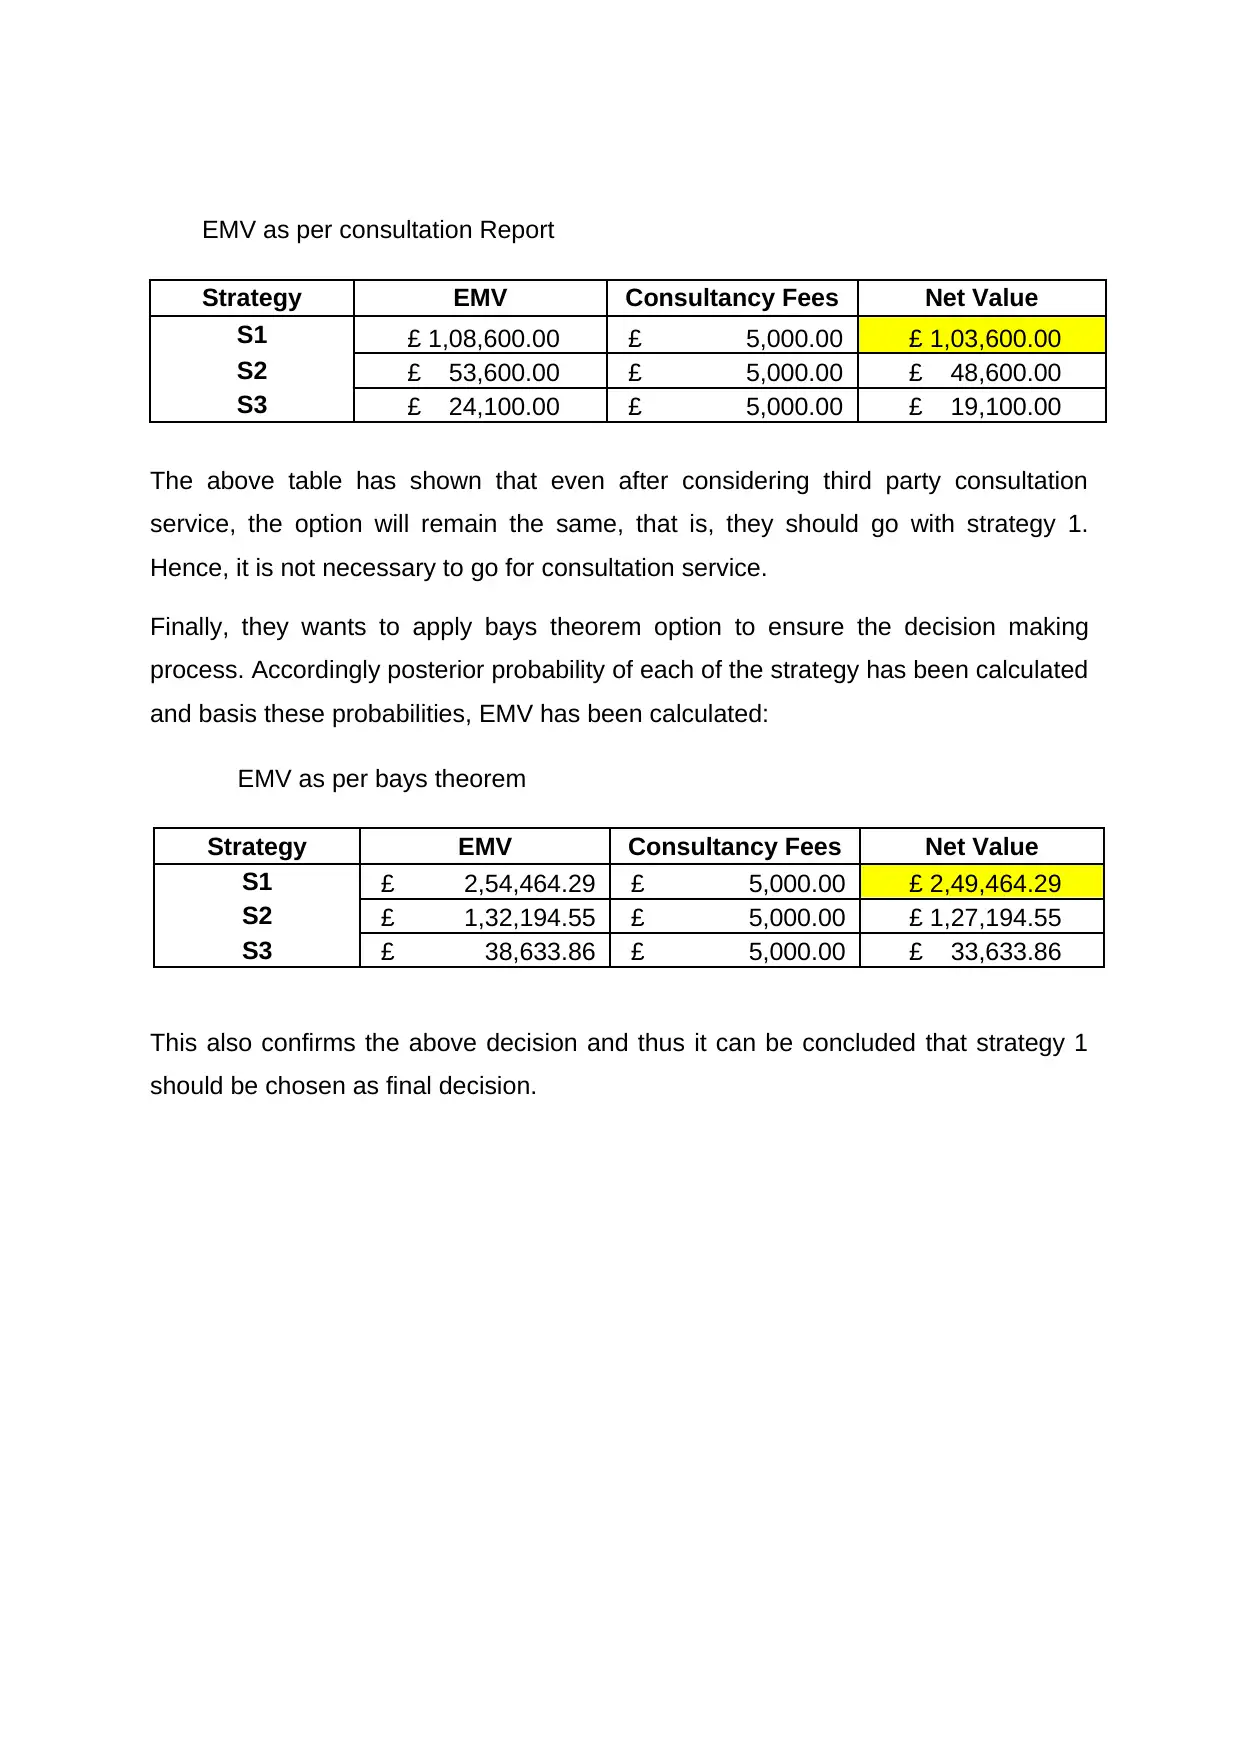
EMV as per consultation Report
Strategy EMV Consultancy Fees Net Value
S1 £ 1,08,600.00 £ 5,000.00 £ 1,03,600.00
S2 £ 53,600.00 £ 5,000.00 £ 48,600.00
S3 £ 24,100.00 £ 5,000.00 £ 19,100.00
The above table has shown that even after considering third party consultation
service, the option will remain the same, that is, they should go with strategy 1.
Hence, it is not necessary to go for consultation service.
Finally, they wants to apply bays theorem option to ensure the decision making
process. Accordingly posterior probability of each of the strategy has been calculated
and basis these probabilities, EMV has been calculated:
EMV as per bays theorem
Strategy EMV Consultancy Fees Net Value
S1 £ 2,54,464.29 £ 5,000.00 £ 2,49,464.29
S2 £ 1,32,194.55 £ 5,000.00 £ 1,27,194.55
S3 £ 38,633.86 £ 5,000.00 £ 33,633.86
This also confirms the above decision and thus it can be concluded that strategy 1
should be chosen as final decision.
Strategy EMV Consultancy Fees Net Value
S1 £ 1,08,600.00 £ 5,000.00 £ 1,03,600.00
S2 £ 53,600.00 £ 5,000.00 £ 48,600.00
S3 £ 24,100.00 £ 5,000.00 £ 19,100.00
The above table has shown that even after considering third party consultation
service, the option will remain the same, that is, they should go with strategy 1.
Hence, it is not necessary to go for consultation service.
Finally, they wants to apply bays theorem option to ensure the decision making
process. Accordingly posterior probability of each of the strategy has been calculated
and basis these probabilities, EMV has been calculated:
EMV as per bays theorem
Strategy EMV Consultancy Fees Net Value
S1 £ 2,54,464.29 £ 5,000.00 £ 2,49,464.29
S2 £ 1,32,194.55 £ 5,000.00 £ 1,27,194.55
S3 £ 38,633.86 £ 5,000.00 £ 33,633.86
This also confirms the above decision and thus it can be concluded that strategy 1
should be chosen as final decision.
⊘ This is a preview!⊘
Do you want full access?
Subscribe today to unlock all pages.
Trusted by 1+ million students worldwide
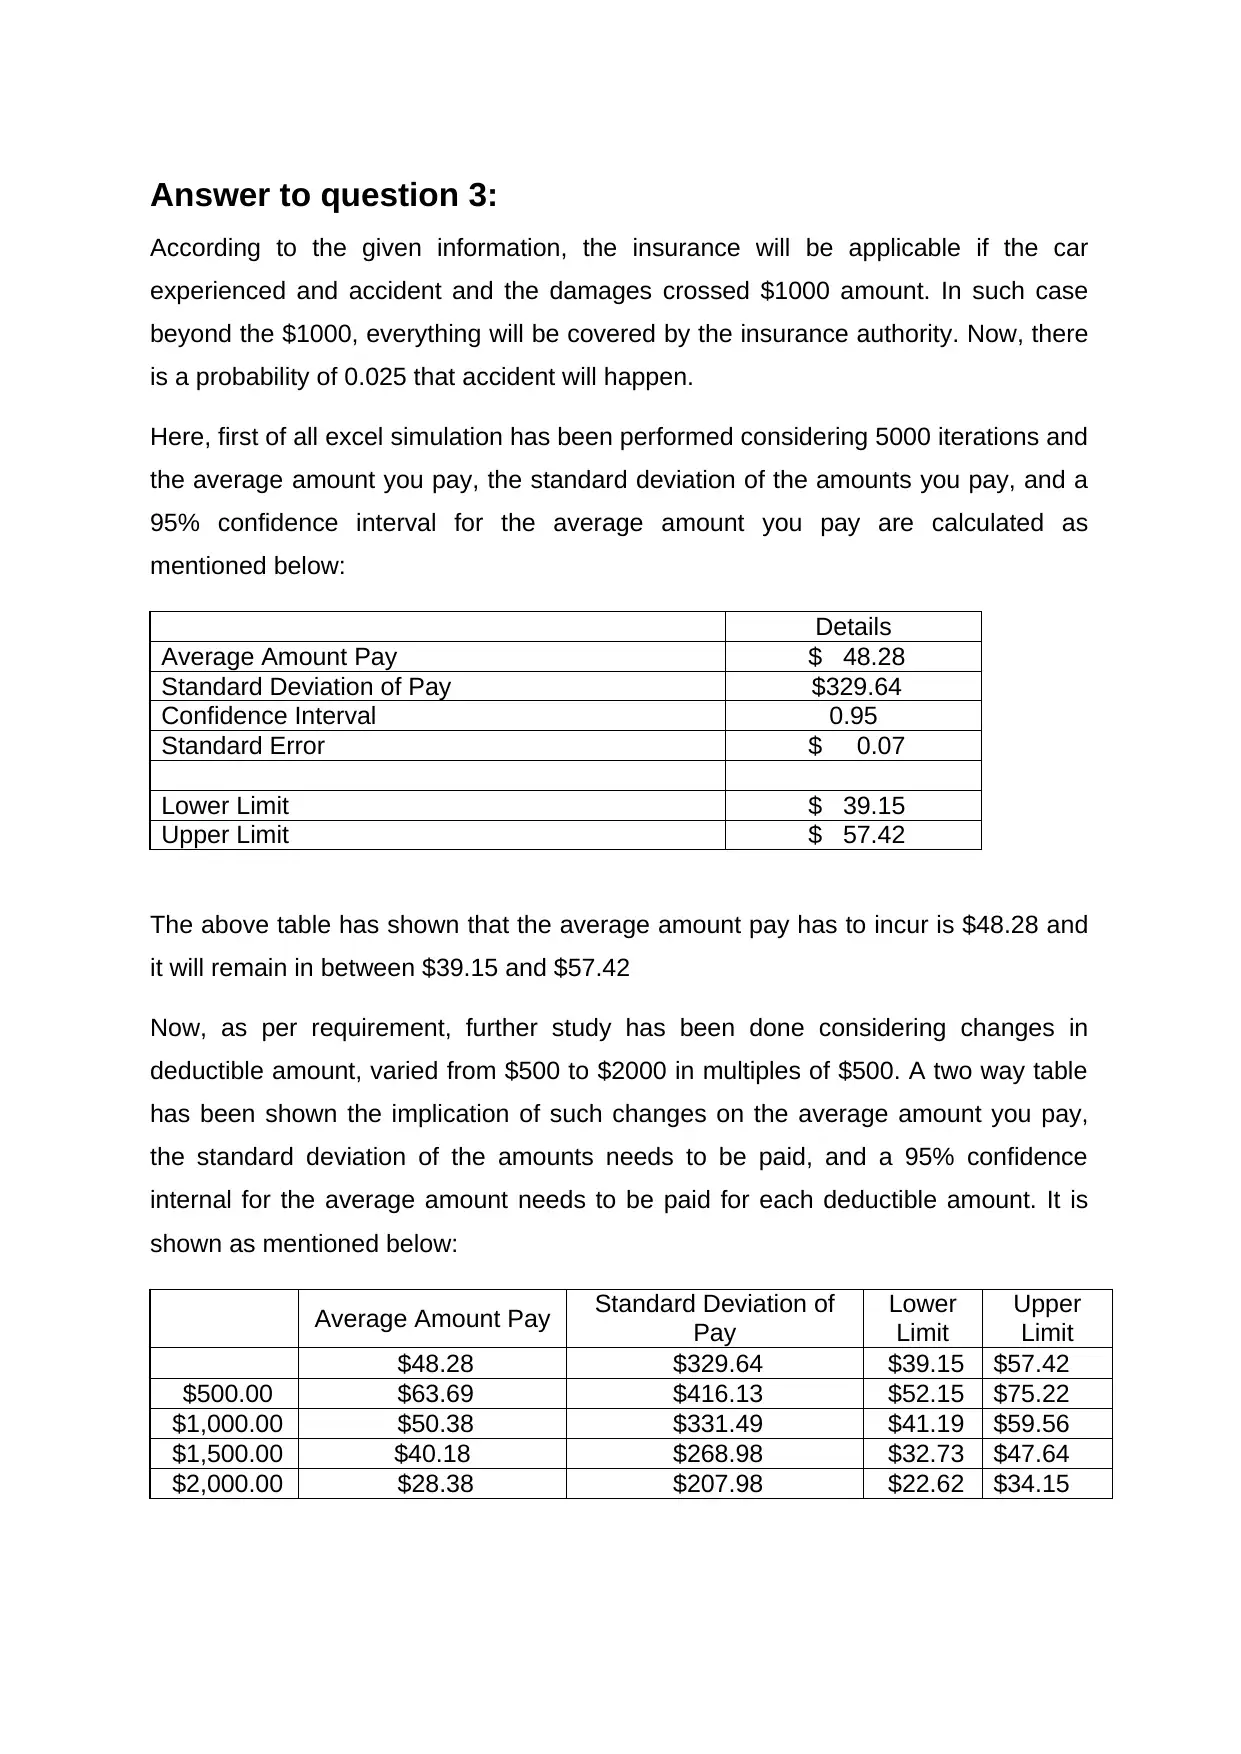
Answer to question 3:
According to the given information, the insurance will be applicable if the car
experienced and accident and the damages crossed $1000 amount. In such case
beyond the $1000, everything will be covered by the insurance authority. Now, there
is a probability of 0.025 that accident will happen.
Here, first of all excel simulation has been performed considering 5000 iterations and
the average amount you pay, the standard deviation of the amounts you pay, and a
95% confidence interval for the average amount you pay are calculated as
mentioned below:
Details
Average Amount Pay $ 48.28
Standard Deviation of Pay $329.64
Confidence Interval 0.95
Standard Error $ 0.07
Lower Limit $ 39.15
Upper Limit $ 57.42
The above table has shown that the average amount pay has to incur is $48.28 and
it will remain in between $39.15 and $57.42
Now, as per requirement, further study has been done considering changes in
deductible amount, varied from $500 to $2000 in multiples of $500. A two way table
has been shown the implication of such changes on the average amount you pay,
the standard deviation of the amounts needs to be paid, and a 95% confidence
internal for the average amount needs to be paid for each deductible amount. It is
shown as mentioned below:
Average Amount Pay Standard Deviation of
Pay
Lower
Limit
Upper
Limit
$48.28 $329.64 $39.15 $57.42
$500.00 $63.69 $416.13 $52.15 $75.22
$1,000.00 $50.38 $331.49 $41.19 $59.56
$1,500.00 $40.18 $268.98 $32.73 $47.64
$2,000.00 $28.38 $207.98 $22.62 $34.15
Paraphrase This Document
Need a fresh take? Get an instant paraphrase of this document with our AI Paraphraser
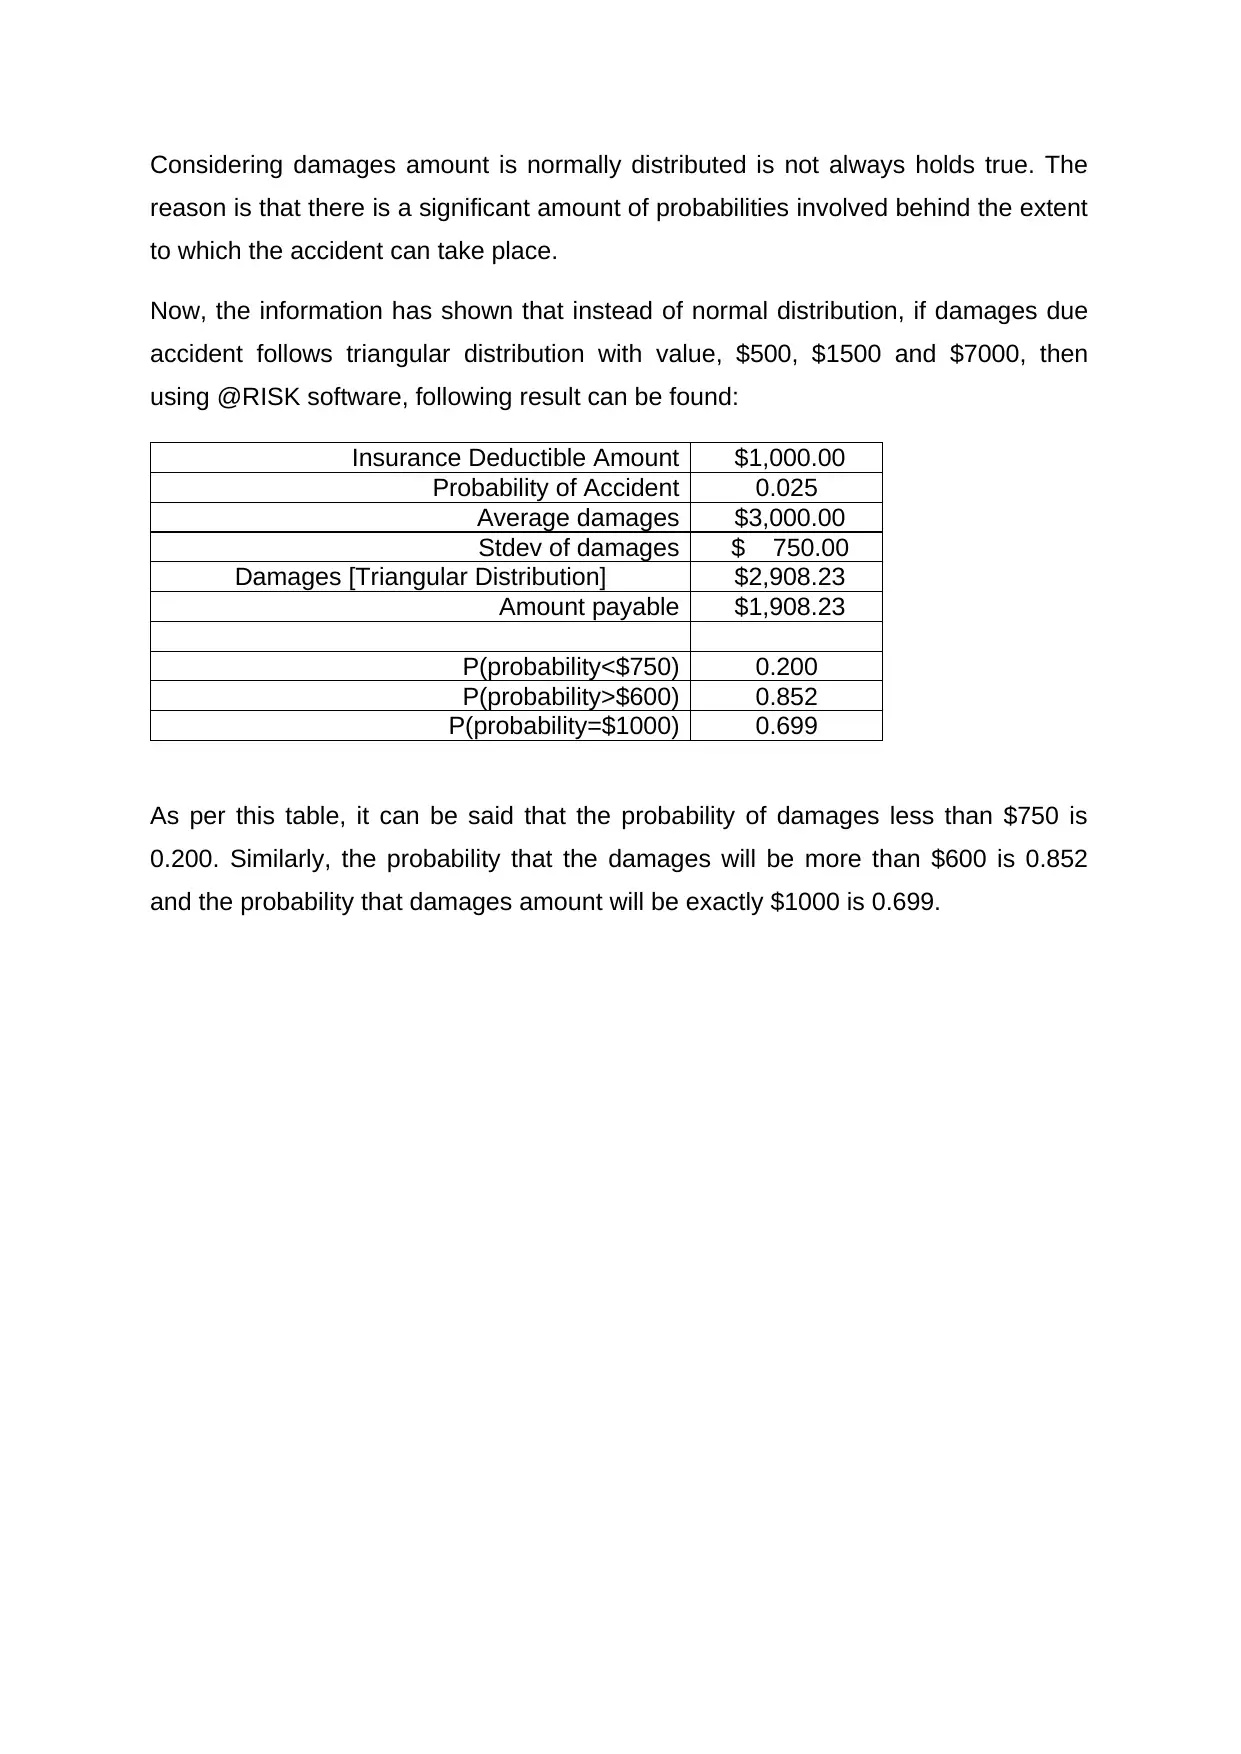
Considering damages amount is normally distributed is not always holds true. The
reason is that there is a significant amount of probabilities involved behind the extent
to which the accident can take place.
Now, the information has shown that instead of normal distribution, if damages due
accident follows triangular distribution with value, $500, $1500 and $7000, then
using @RISK software, following result can be found:
Insurance Deductible Amount $1,000.00
Probability of Accident 0.025
Average damages $3,000.00
Stdev of damages $ 750.00
Damages [Triangular Distribution] $2,908.23
Amount payable $1,908.23
P(probability<$750) 0.200
P(probability>$600) 0.852
P(probability=$1000) 0.699
As per this table, it can be said that the probability of damages less than $750 is
0.200. Similarly, the probability that the damages will be more than $600 is 0.852
and the probability that damages amount will be exactly $1000 is 0.699.
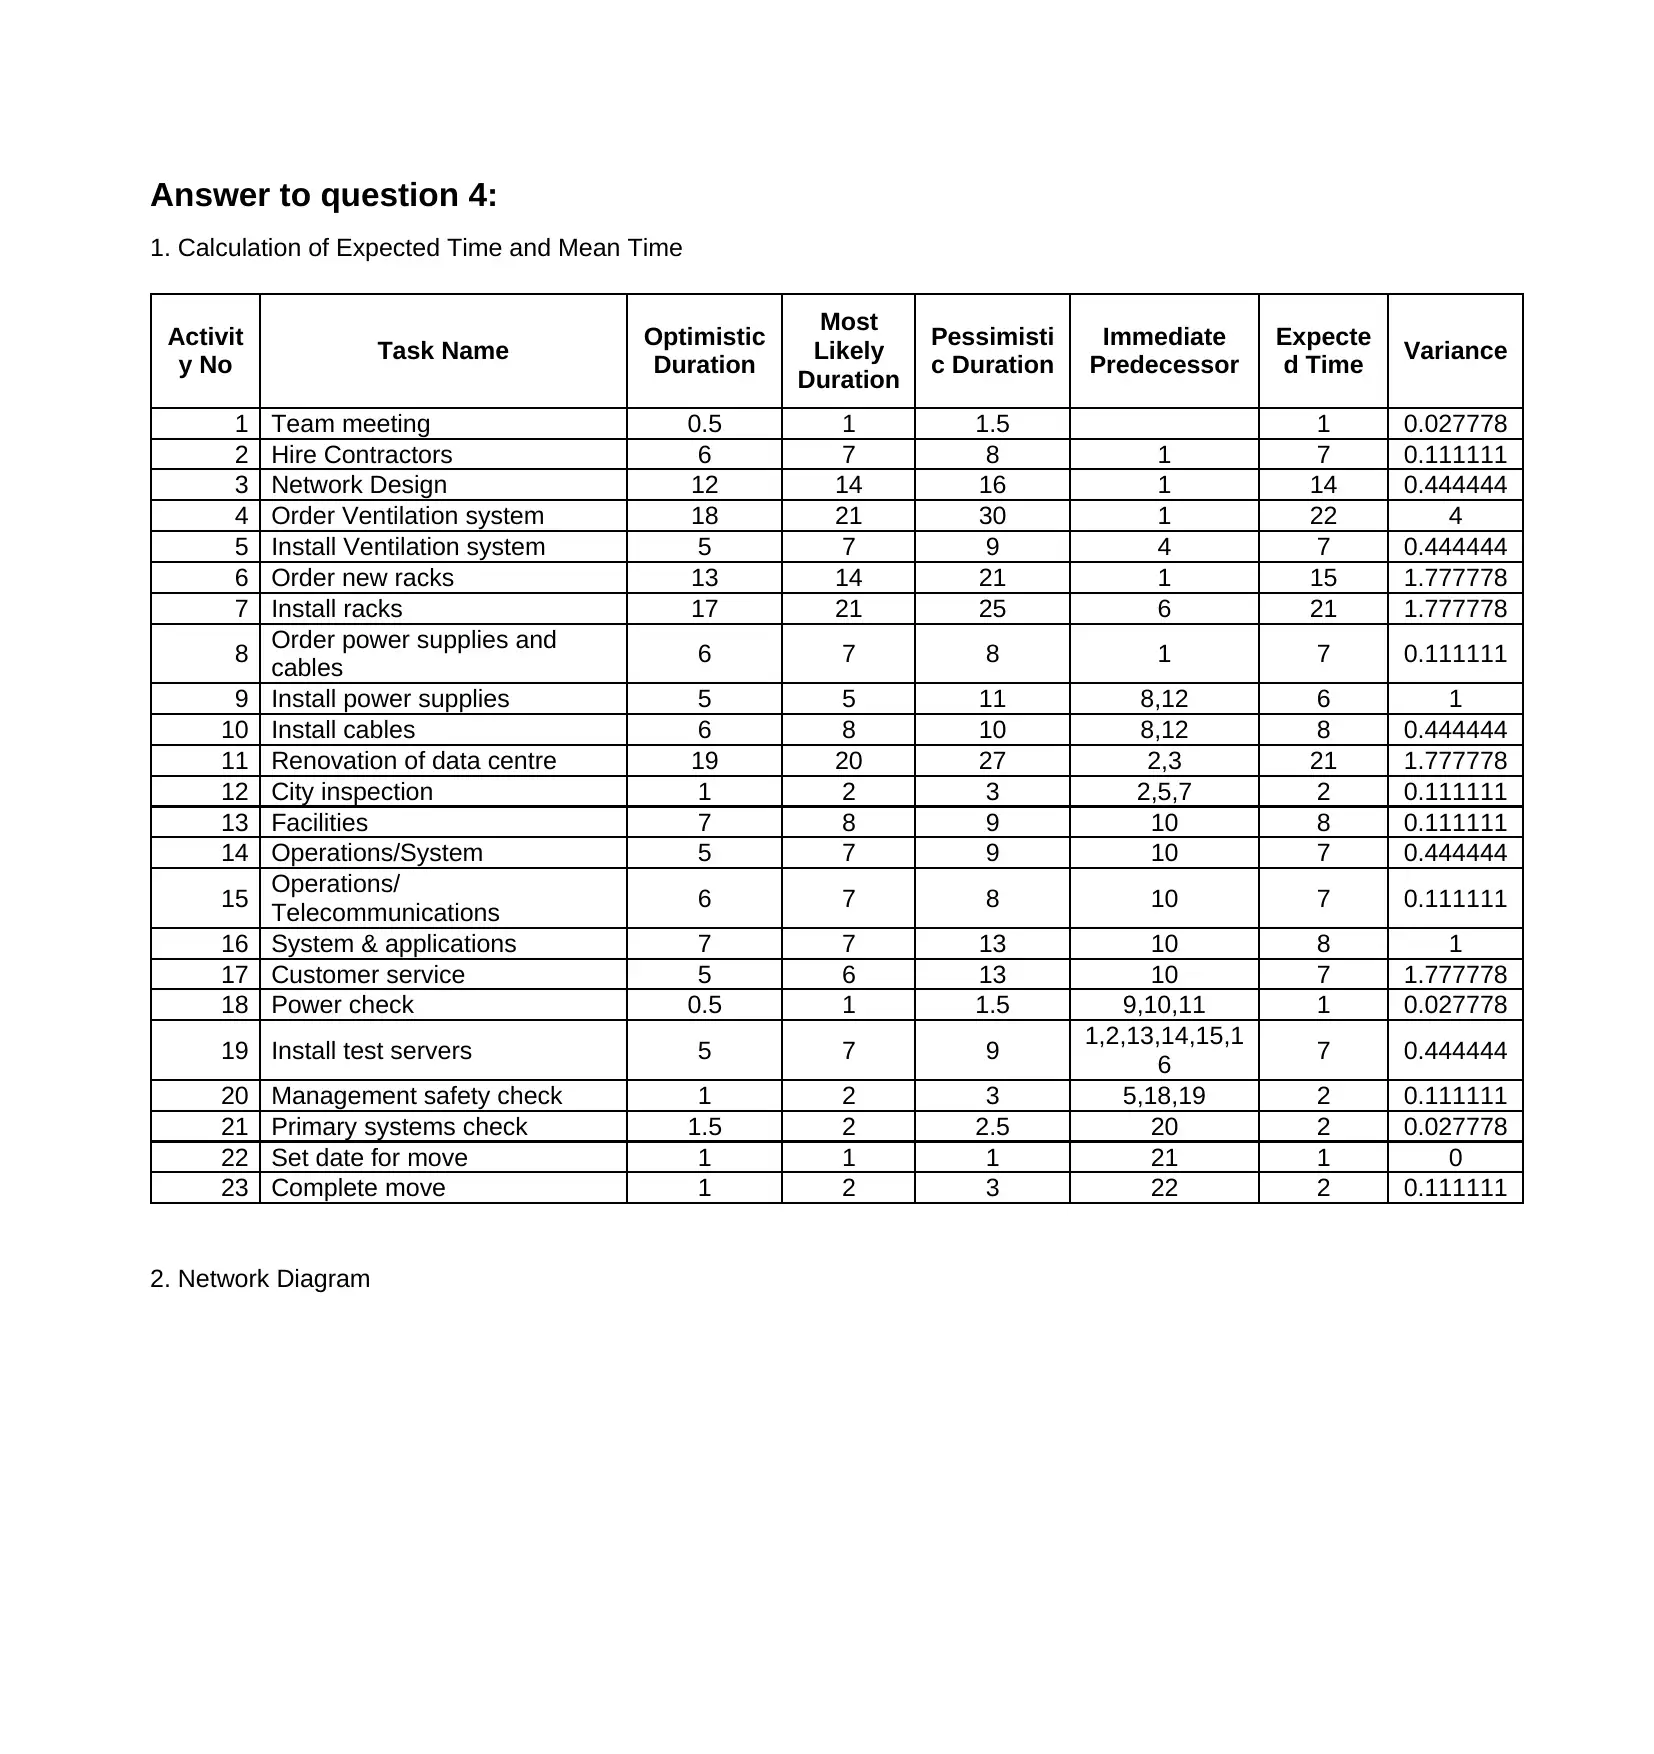
Answer to question 4:
1. Calculation of Expected Time and Mean Time
Activit
y No Task Name Optimistic
Duration
Most
Likely
Duration
Pessimisti
c Duration
Immediate
Predecessor
Expecte
d Time Variance
1 Team meeting 0.5 1 1.5 1 0.027778
2 Hire Contractors 6 7 8 1 7 0.111111
3 Network Design 12 14 16 1 14 0.444444
4 Order Ventilation system 18 21 30 1 22 4
5 Install Ventilation system 5 7 9 4 7 0.444444
6 Order new racks 13 14 21 1 15 1.777778
7 Install racks 17 21 25 6 21 1.777778
8 Order power supplies and
cables 6 7 8 1 7 0.111111
9 Install power supplies 5 5 11 8,12 6 1
10 Install cables 6 8 10 8,12 8 0.444444
11 Renovation of data centre 19 20 27 2,3 21 1.777778
12 City inspection 1 2 3 2,5,7 2 0.111111
13 Facilities 7 8 9 10 8 0.111111
14 Operations/System 5 7 9 10 7 0.444444
15 Operations/
Telecommunications 6 7 8 10 7 0.111111
16 System & applications 7 7 13 10 8 1
17 Customer service 5 6 13 10 7 1.777778
18 Power check 0.5 1 1.5 9,10,11 1 0.027778
19 Install test servers 5 7 9 1,2,13,14,15,1
6 7 0.444444
20 Management safety check 1 2 3 5,18,19 2 0.111111
21 Primary systems check 1.5 2 2.5 20 2 0.027778
22 Set date for move 1 1 1 21 1 0
23 Complete move 1 2 3 22 2 0.111111
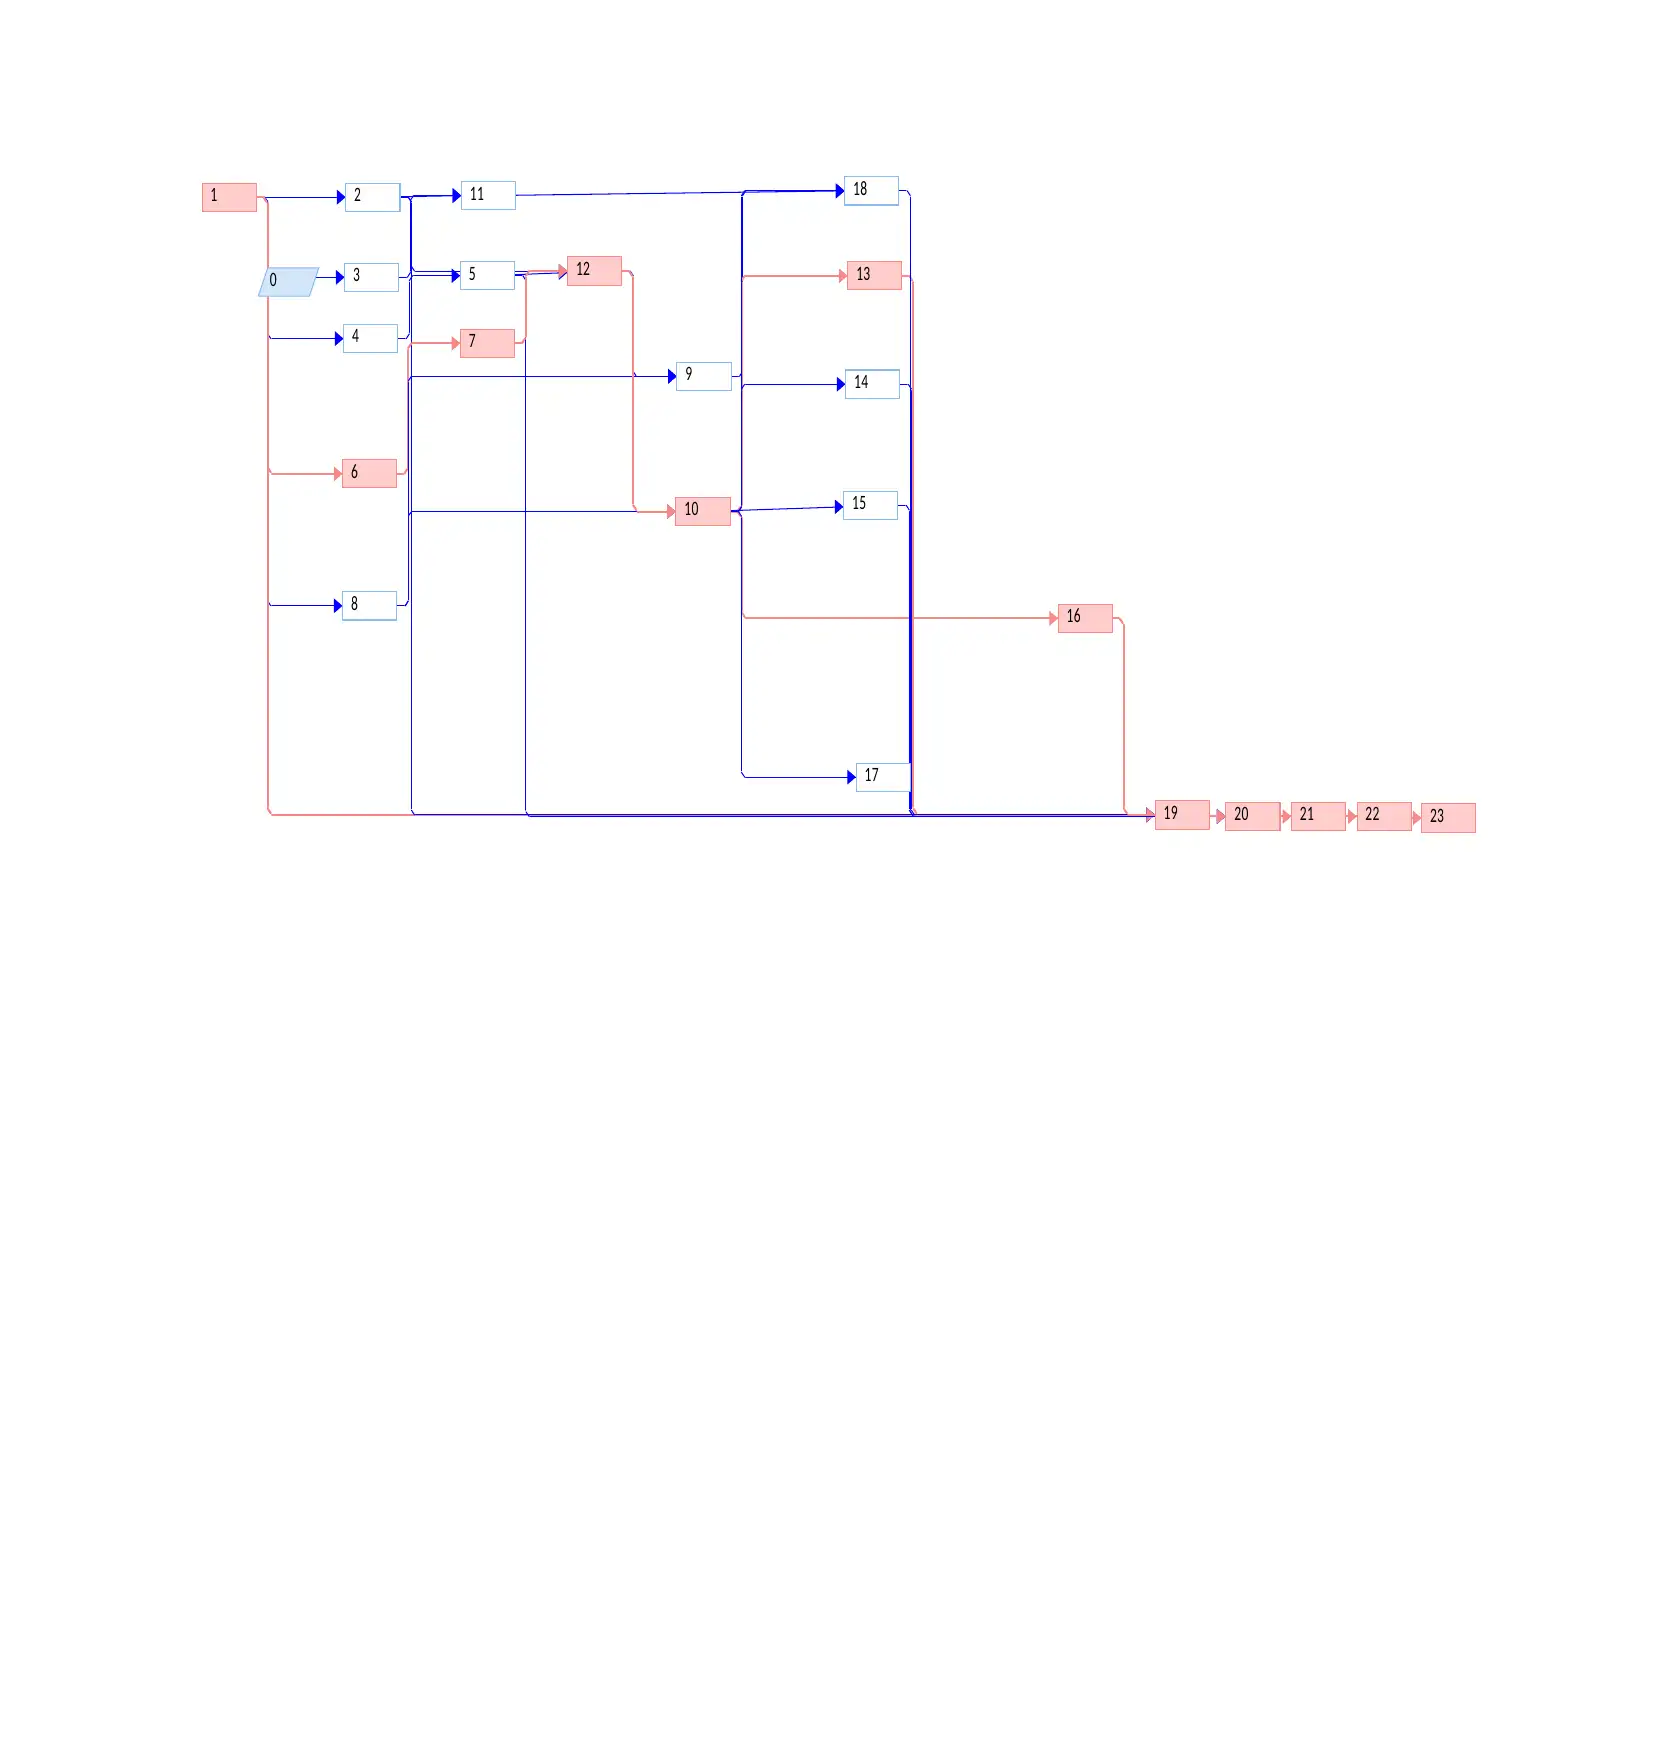
2. Network Diagram
1. Calculation of Expected Time and Mean Time
Activit
y No Task Name Optimistic
Duration
Most
Likely
Duration
Pessimisti
c Duration
Immediate
Predecessor
Expecte
d Time Variance
1 Team meeting 0.5 1 1.5 1 0.027778
2 Hire Contractors 6 7 8 1 7 0.111111
3 Network Design 12 14 16 1 14 0.444444
4 Order Ventilation system 18 21 30 1 22 4
5 Install Ventilation system 5 7 9 4 7 0.444444
6 Order new racks 13 14 21 1 15 1.777778
7 Install racks 17 21 25 6 21 1.777778
8 Order power supplies and
cables 6 7 8 1 7 0.111111
9 Install power supplies 5 5 11 8,12 6 1
10 Install cables 6 8 10 8,12 8 0.444444
11 Renovation of data centre 19 20 27 2,3 21 1.777778
12 City inspection 1 2 3 2,5,7 2 0.111111
13 Facilities 7 8 9 10 8 0.111111
14 Operations/System 5 7 9 10 7 0.444444
15 Operations/
Telecommunications 6 7 8 10 7 0.111111
16 System & applications 7 7 13 10 8 1
17 Customer service 5 6 13 10 7 1.777778
18 Power check 0.5 1 1.5 9,10,11 1 0.027778
19 Install test servers 5 7 9 1,2,13,14,15,1
6 7 0.444444
20 Management safety check 1 2 3 5,18,19 2 0.111111
21 Primary systems check 1.5 2 2.5 20 2 0.027778
22 Set date for move 1 1 1 21 1 0
23 Complete move 1 2 3 22 2 0.111111
2. Network Diagram
⊘ This is a preview!⊘
Do you want full access?
Subscribe today to unlock all pages.
Trusted by 1+ million students worldwide
2
14
1
3
4
6
50
8
13
11 18
19
9
232120
16
17
1510
12
7
22
14
1
3
4
6
50
8
13
11 18
19
9
232120
16
17
1510
12
7
22
Paraphrase This Document
Need a fresh take? Get an instant paraphrase of this document with our AI Paraphraser
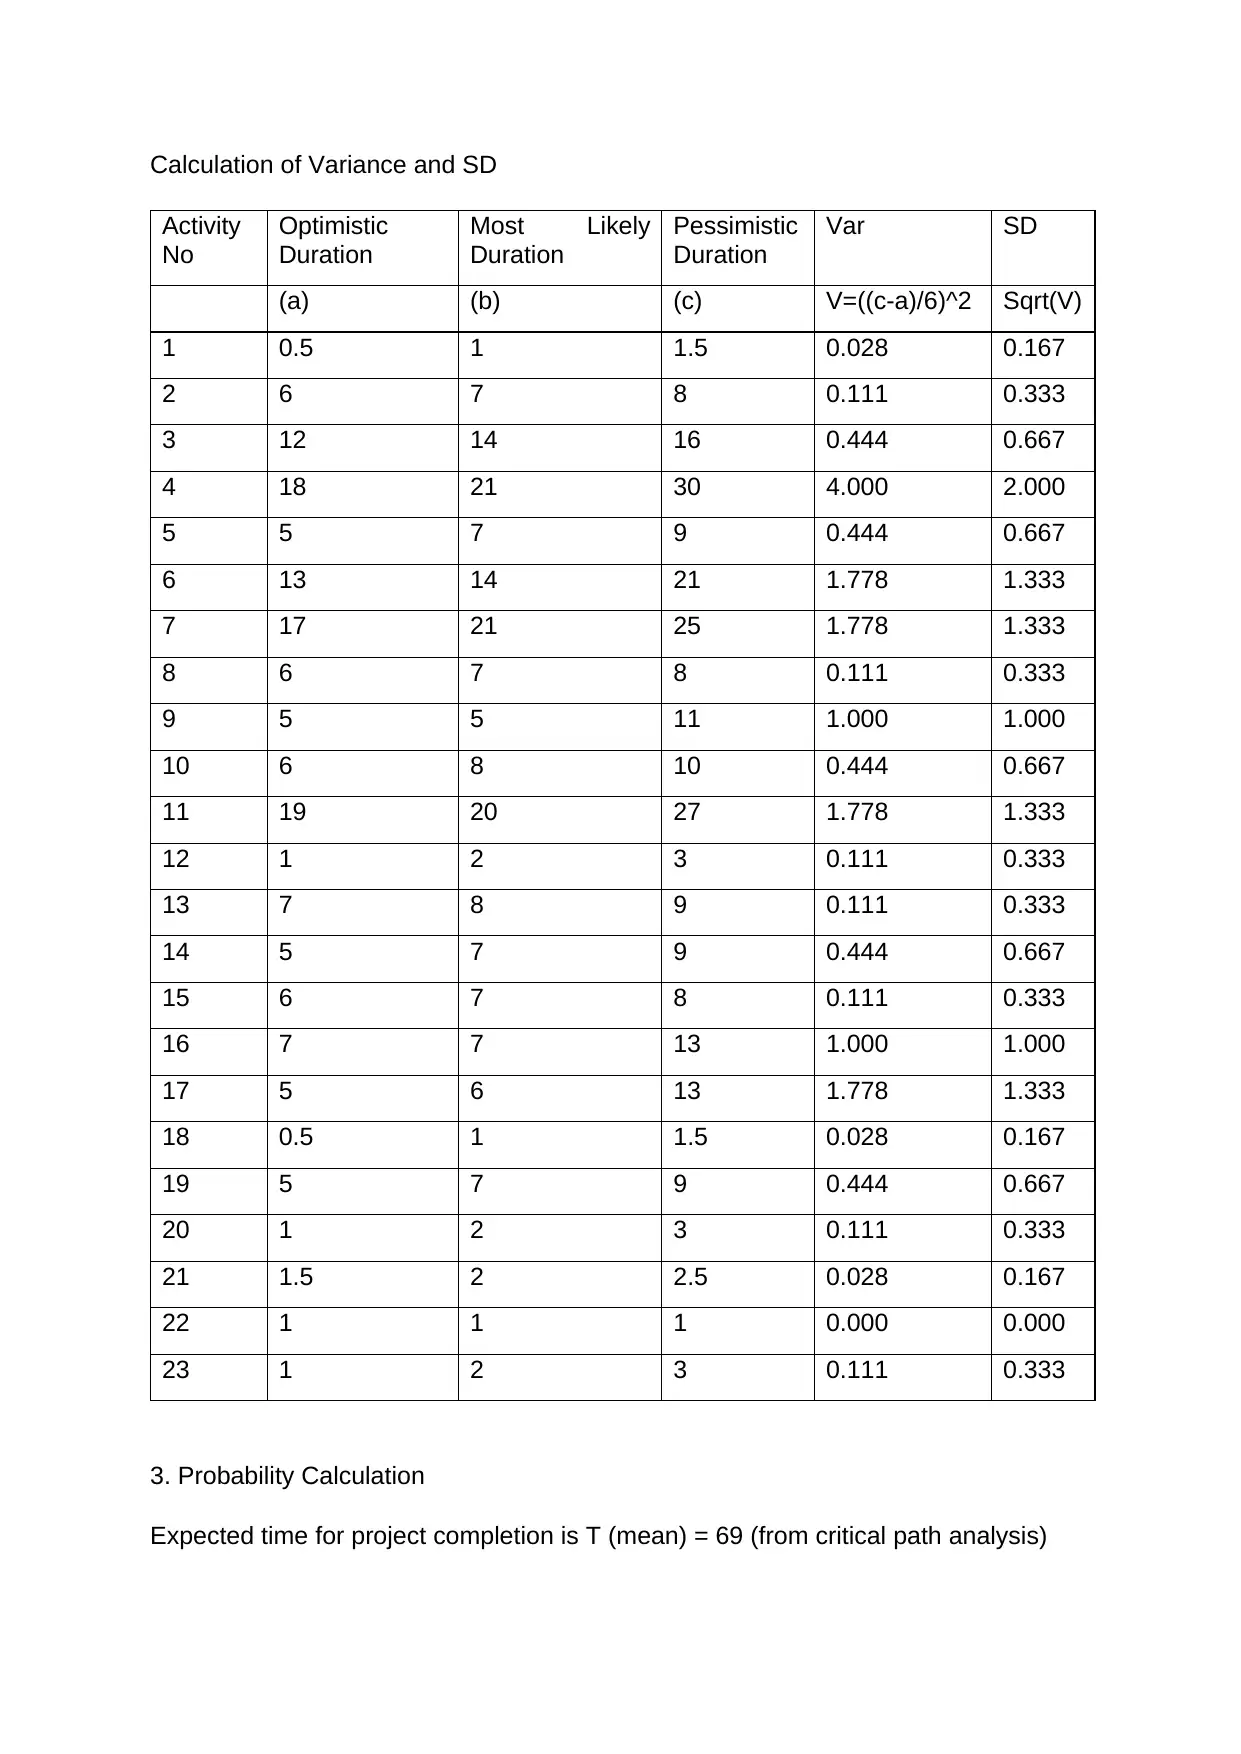
Calculation of Variance and SD
Activity
No
Optimistic
Duration
Most Likely
Duration
Pessimistic
Duration
Var SD
(a) (b) (c) V=((c-a)/6)^2 Sqrt(V)
1 0.5 1 1.5 0.028 0.167
2 6 7 8 0.111 0.333
3 12 14 16 0.444 0.667
4 18 21 30 4.000 2.000
5 5 7 9 0.444 0.667
6 13 14 21 1.778 1.333
7 17 21 25 1.778 1.333
8 6 7 8 0.111 0.333
9 5 5 11 1.000 1.000
10 6 8 10 0.444 0.667
11 19 20 27 1.778 1.333
12 1 2 3 0.111 0.333
13 7 8 9 0.111 0.333
14 5 7 9 0.444 0.667
15 6 7 8 0.111 0.333
16 7 7 13 1.000 1.000
17 5 6 13 1.778 1.333
18 0.5 1 1.5 0.028 0.167
19 5 7 9 0.444 0.667
20 1 2 3 0.111 0.333
21 1.5 2 2.5 0.028 0.167
22 1 1 1 0.000 0.000
23 1 2 3 0.111 0.333
3. Probability Calculation
Expected time for project completion is T (mean) = 69 (from critical path analysis)
Variance (V) = 5.833
SD = 2.415
Z= -1/2.415
Since, Z= -0.4140
Therefore, applying normal distribution function for Z,
Probability= 33.94%
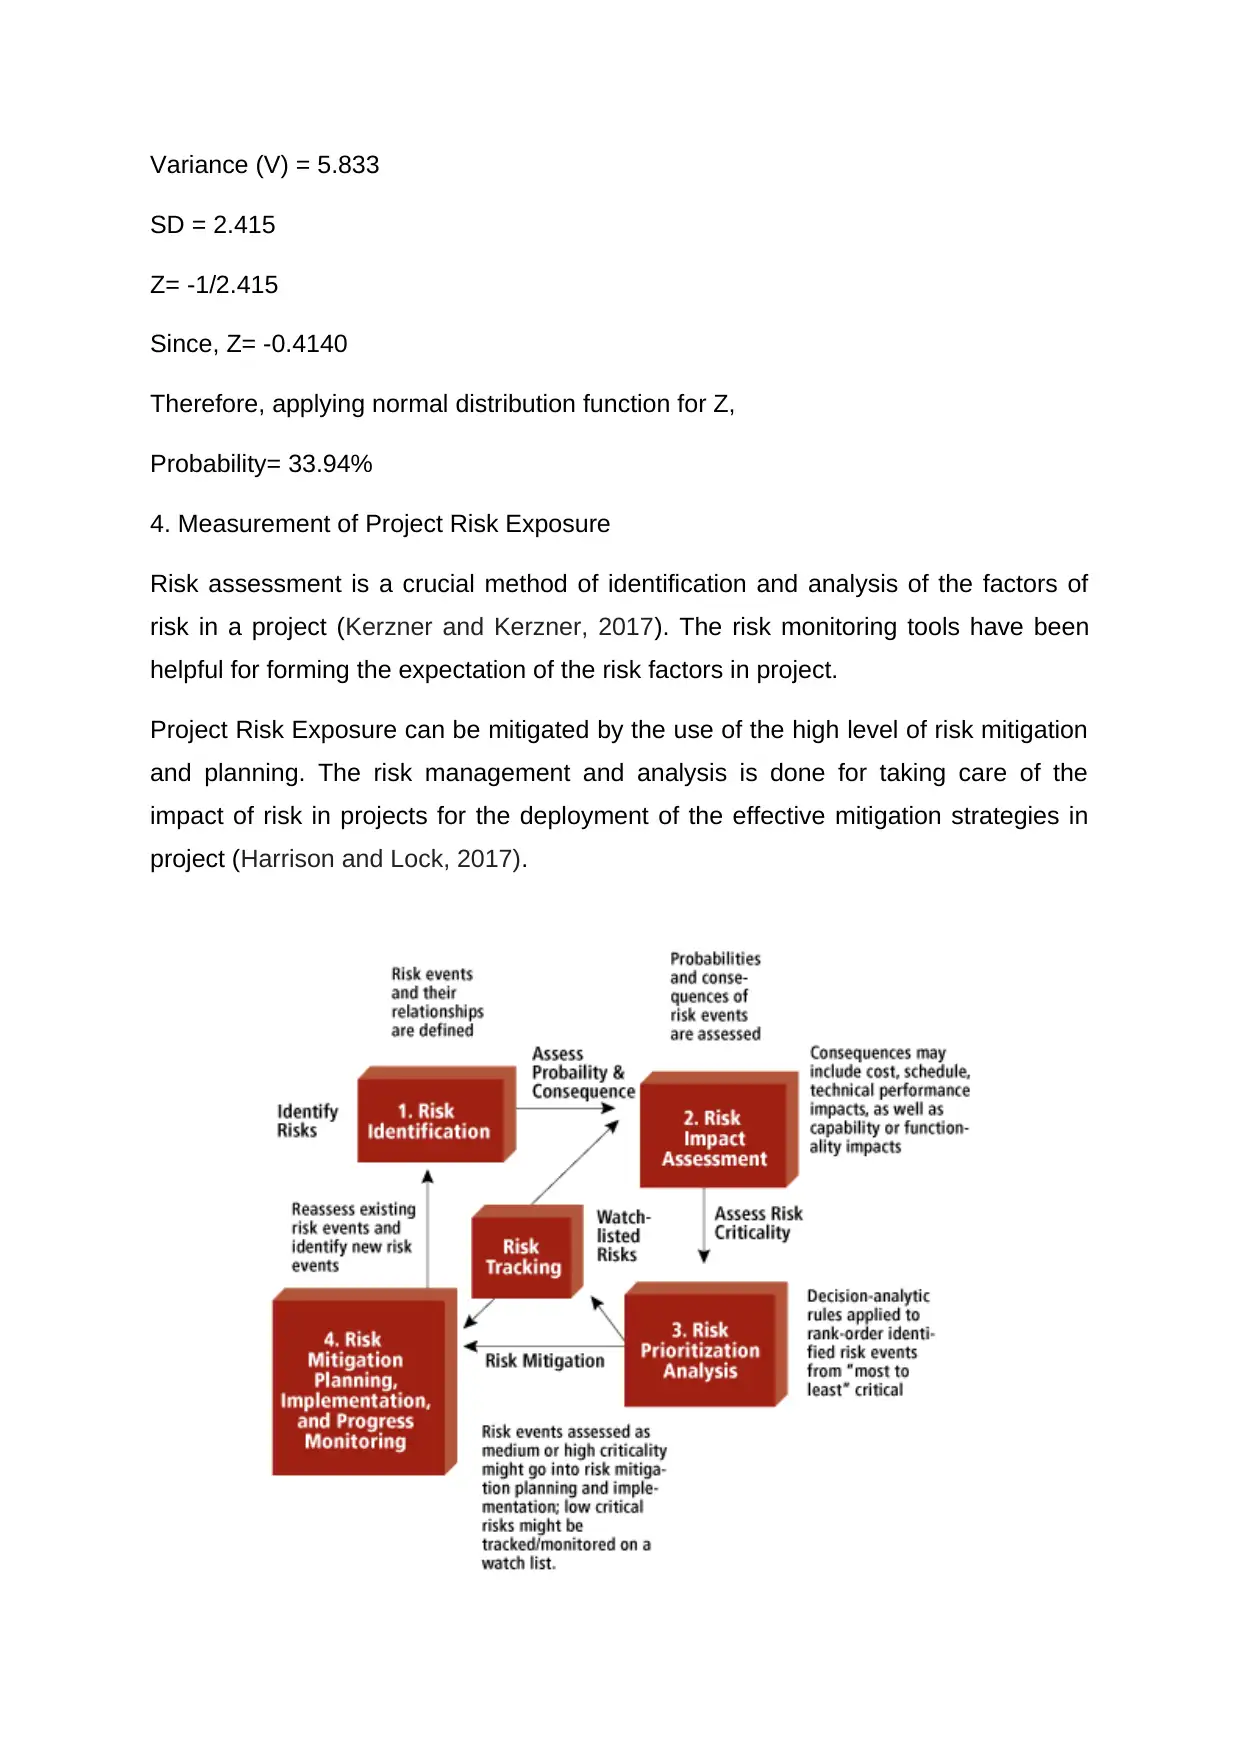
4. Measurement of Project Risk Exposure
Risk assessment is a crucial method of identification and analysis of the factors of
risk in a project (Kerzner and Kerzner, 2017). The risk monitoring tools have been
helpful for forming the expectation of the risk factors in project.
Project Risk Exposure can be mitigated by the use of the high level of risk mitigation
and planning. The risk management and analysis is done for taking care of the
impact of risk in projects for the deployment of the effective mitigation strategies in
project (Harrison and Lock, 2017).
SD = 2.415
Z= -1/2.415
Since, Z= -0.4140
Therefore, applying normal distribution function for Z,
Probability= 33.94%
4. Measurement of Project Risk Exposure
Risk assessment is a crucial method of identification and analysis of the factors of
risk in a project (Kerzner and Kerzner, 2017). The risk monitoring tools have been
helpful for forming the expectation of the risk factors in project.
Project Risk Exposure can be mitigated by the use of the high level of risk mitigation
and planning. The risk management and analysis is done for taking care of the
impact of risk in projects for the deployment of the effective mitigation strategies in
project (Harrison and Lock, 2017).
⊘ This is a preview!⊘
Do you want full access?
Subscribe today to unlock all pages.
Trusted by 1+ million students worldwide
1 out of 19

Your All-in-One AI-Powered Toolkit for Academic Success.
+13062052269
info@desklib.com
Available 24*7 on WhatsApp / Email
![[object Object]](/_next/static/media/star-bottom.7253800d.svg)
Unlock your academic potential
Copyright © 2020–2026 A2Z Services. All Rights Reserved. Developed and managed by ZUCOL.