Project Report: Scheduling, PERT Analysis, and Project Crashing
VerifiedAdded on 2021/06/15
|13
|1191
|90
Report
AI Summary
This report provides an analysis of project management tools, specifically scheduling, PERT analysis, and project crashing. It includes a basic project schedule with a Gantt chart illustrating project activities, durations, and estimated costs, highlighting the critical path and total project cost. The report also presents a PERT analysis with optimistic, normal, and pessimistic durations, along with a network diagram. Furthermore, it explores project crashing scenarios and concludes with the importance of improved project management principles. The deployment of the operations had supported the utilization of the activities favouring the implication of the improved operation development. Desklib provides students with access to this and other solved assignments for academic support.
Running head: PROJECT REPORT
Project Report:
Scheduling, Pert Analysis, and Crashing
Name of the Student:
Student ID:
Name of the University:
Author’s note:
Project Report:
Scheduling, Pert Analysis, and Crashing
Name of the Student:
Student ID:
Name of the University:
Author’s note:
Paraphrase This Document
Need a fresh take? Get an instant paraphrase of this document with our AI Paraphraser
1PROJECT REPORT
Table of Contents
Introduction......................................................................................................................................2
a. Project Basic Schedule.................................................................................................................2
b. Pert Analysis and Network Diagram...........................................................................................6
c. Project Crashing...........................................................................................................................9
Conclusion.....................................................................................................................................11
Bibliography..................................................................................................................................12
2PROJECT REPORT
Introduction
The following assignment is made for analysing the project management tools of scheduling, analysing project using Pert method, and crashing a project according to given scenario. The deployment of the operations
had supported the utilization of the activities favouring the implication of the improved operation development.
a. Project Basic Schedule
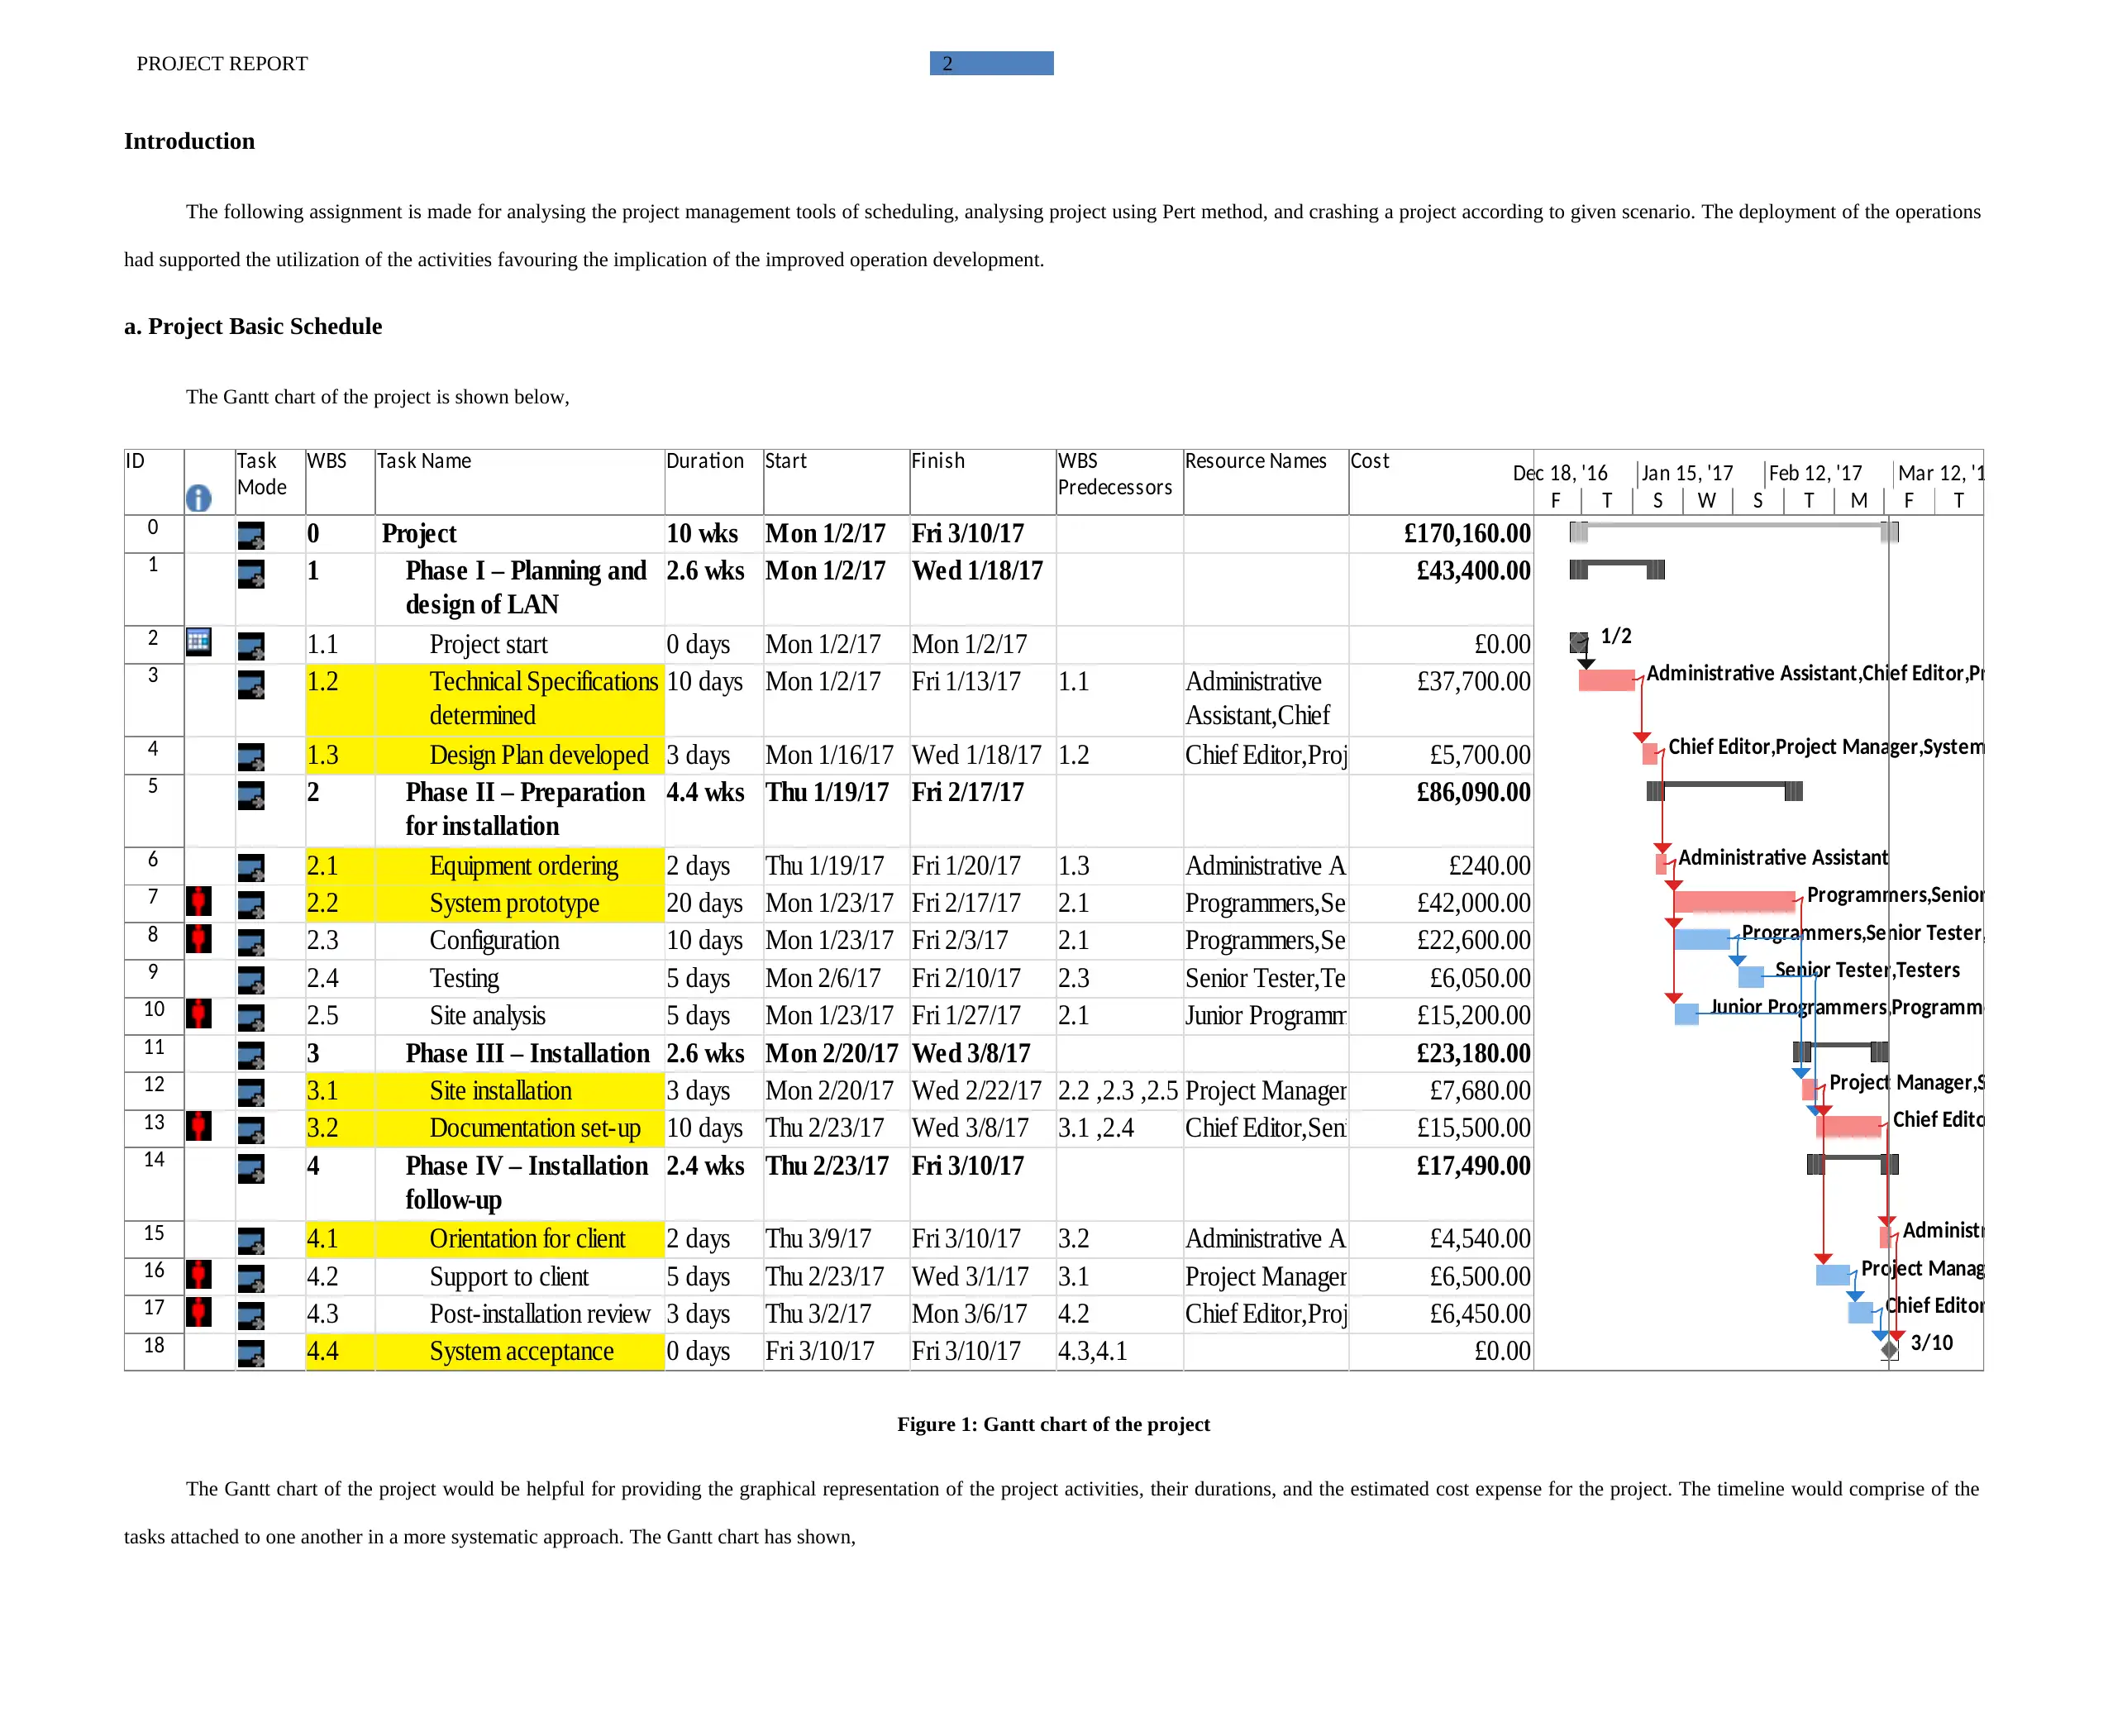
The Gantt chart of the project is shown below,
ID Task
Mode
WBS Task Name Duration Start Finish WBS
Predecessors
Resource Names Cost
0 0 Project 10 wks Mon 1/2/17 Fri 3/10/17 £170,160.00
1 1 Phase I – Planning and
design of LAN
2.6 wks Mon 1/2/17 Wed 1/18/17 £43,400.00
2 1.1 Project start 0 days Mon 1/2/17 Mon 1/2/17 £0.00
3 1.2 Technical Specifications
determined
10 days Mon 1/2/17 Fri 1/13/17 1.1 Administrative
Assistant,Chief
Editor,Project
£37,700.00
4 1.3 Design Plan developed 3 days Mon 1/16/17 Wed 1/18/17 1.2 Chief Editor,Project Manager,System Analysts,Vice President-Management Information Systems£5,700.00
5 2 Phase II – Preparation
for installation
4.4 wks Thu 1/19/17 Fri 2/17/17 £86,090.00
6 2.1 Equipment ordering 2 days Thu 1/19/17 Fri 1/20/17 1.3 Administrative Assistant £240.00
7 2.2 System prototype 20 days Mon 1/23/17 Fri 2/17/17 2.1 Programmers,Senior Programmer,System Analysts,Systems Consultant£42,000.00
8 2.3 Configuration 10 days Mon 1/23/17 Fri 2/3/17 2.1 Programmers,Senior Tester,Systems Consultant,Testers£22,600.00
9 2.4 Testing 5 days Mon 2/6/17 Fri 2/10/17 2.3 Senior Tester,Testers £6,050.00
10 2.5 Site analysis 5 days Mon 1/23/17 Fri 1/27/17 2.1 Junior Programmers,Programmers,System Analysts,Testers£15,200.00
11 3 Phase III – Installation 2.6 wks Mon 2/20/17 Wed 3/8/17 £23,180.00
12 3.1 Site installation 3 days Mon 2/20/17 Wed 2/22/17 2.2 ,2.3 ,2.5 Project Manager,Senior Tester,System Analysts,Systems Consultant,Testers£7,680.00
13 3.2 Documentation set-up 10 days Thu 2/23/17 Wed 3/8/17 3.1 ,2.4 Chief Editor,Senior Writer,Writers£15,500.00
14 4 Phase IV – Installation
follow-up
2.4 wks Thu 2/23/17 Fri 3/10/17 £17,490.00
15 4.1 Orientation for client 2 days Thu 3/9/17 Fri 3/10/17 3.2 Administrative Assistant,Programmers,Project Manager,System Analysts,Systems Consultant£4,540.00
16 4.2 Support to client 5 days Thu 2/23/17 Wed 3/1/17 3.1 Project Manager,Senior Programmer,Senior Tester,Senior Writer,Systems Consultant£6,500.00
17 4.3 Post-installation review 3 days Thu 3/2/17 Mon 3/6/17 4.2 Chief Editor,Project Manager,System Analysts,Systems Consultant,Vice President-Management£6,450.00
18 4.4 System acceptance 0 days Fri 3/10/17 Fri 3/10/17 4.3,4.1 £0.00
1/2
Administrative Assistant,Chief Editor,Project Manager
Chief Editor,Project Manager,System Analysts,Vice
Administrative Assistant
Programmers,Senior Programmer,S
Programmers,Senior Tester,Systems Consu
Senior Tester,Testers
Junior Programmers,Programmers,System Ana
Project Manager,Senior Tester,S
Chief Editor,Senior Write
Administrative Assistant
Project Manager,Senior Prog
Chief Editor,Project Manag
3/10
F T S W S T M F T S
Dec 18, '16 Jan 15, '17 Feb 12, '17 Mar 12, '17
Figure 1: Gantt chart of the project
The Gantt chart of the project would be helpful for providing the graphical representation of the project activities, their durations, and the estimated cost expense for the project. The timeline would comprise of the
tasks attached to one another in a more systematic approach. The Gantt chart has shown,
Introduction
The following assignment is made for analysing the project management tools of scheduling, analysing project using Pert method, and crashing a project according to given scenario. The deployment of the operations
had supported the utilization of the activities favouring the implication of the improved operation development.
a. Project Basic Schedule
The Gantt chart of the project is shown below,
ID Task
Mode
WBS Task Name Duration Start Finish WBS
Predecessors
Resource Names Cost
0 0 Project 10 wks Mon 1/2/17 Fri 3/10/17 £170,160.00
1 1 Phase I – Planning and
design of LAN
2.6 wks Mon 1/2/17 Wed 1/18/17 £43,400.00
2 1.1 Project start 0 days Mon 1/2/17 Mon 1/2/17 £0.00
3 1.2 Technical Specifications
determined
10 days Mon 1/2/17 Fri 1/13/17 1.1 Administrative
Assistant,Chief
Editor,Project
£37,700.00
4 1.3 Design Plan developed 3 days Mon 1/16/17 Wed 1/18/17 1.2 Chief Editor,Project Manager,System Analysts,Vice President-Management Information Systems£5,700.00
5 2 Phase II – Preparation
for installation
4.4 wks Thu 1/19/17 Fri 2/17/17 £86,090.00
6 2.1 Equipment ordering 2 days Thu 1/19/17 Fri 1/20/17 1.3 Administrative Assistant £240.00
7 2.2 System prototype 20 days Mon 1/23/17 Fri 2/17/17 2.1 Programmers,Senior Programmer,System Analysts,Systems Consultant£42,000.00
8 2.3 Configuration 10 days Mon 1/23/17 Fri 2/3/17 2.1 Programmers,Senior Tester,Systems Consultant,Testers£22,600.00
9 2.4 Testing 5 days Mon 2/6/17 Fri 2/10/17 2.3 Senior Tester,Testers £6,050.00
10 2.5 Site analysis 5 days Mon 1/23/17 Fri 1/27/17 2.1 Junior Programmers,Programmers,System Analysts,Testers£15,200.00
11 3 Phase III – Installation 2.6 wks Mon 2/20/17 Wed 3/8/17 £23,180.00
12 3.1 Site installation 3 days Mon 2/20/17 Wed 2/22/17 2.2 ,2.3 ,2.5 Project Manager,Senior Tester,System Analysts,Systems Consultant,Testers£7,680.00
13 3.2 Documentation set-up 10 days Thu 2/23/17 Wed 3/8/17 3.1 ,2.4 Chief Editor,Senior Writer,Writers£15,500.00
14 4 Phase IV – Installation
follow-up
2.4 wks Thu 2/23/17 Fri 3/10/17 £17,490.00
15 4.1 Orientation for client 2 days Thu 3/9/17 Fri 3/10/17 3.2 Administrative Assistant,Programmers,Project Manager,System Analysts,Systems Consultant£4,540.00
16 4.2 Support to client 5 days Thu 2/23/17 Wed 3/1/17 3.1 Project Manager,Senior Programmer,Senior Tester,Senior Writer,Systems Consultant£6,500.00
17 4.3 Post-installation review 3 days Thu 3/2/17 Mon 3/6/17 4.2 Chief Editor,Project Manager,System Analysts,Systems Consultant,Vice President-Management£6,450.00
18 4.4 System acceptance 0 days Fri 3/10/17 Fri 3/10/17 4.3,4.1 £0.00
1/2
Administrative Assistant,Chief Editor,Project Manager
Chief Editor,Project Manager,System Analysts,Vice
Administrative Assistant
Programmers,Senior Programmer,S
Programmers,Senior Tester,Systems Consu
Senior Tester,Testers
Junior Programmers,Programmers,System Ana
Project Manager,Senior Tester,S
Chief Editor,Senior Write
Administrative Assistant
Project Manager,Senior Prog
Chief Editor,Project Manag
3/10
F T S W S T M F T S
Dec 18, '16 Jan 15, '17 Feb 12, '17 Mar 12, '17
Figure 1: Gantt chart of the project
The Gantt chart of the project would be helpful for providing the graphical representation of the project activities, their durations, and the estimated cost expense for the project. The timeline would comprise of the
tasks attached to one another in a more systematic approach. The Gantt chart has shown,
⊘ This is a preview!⊘
Do you want full access?
Subscribe today to unlock all pages.
Trusted by 1+ million students worldwide
3PROJECT REPORT
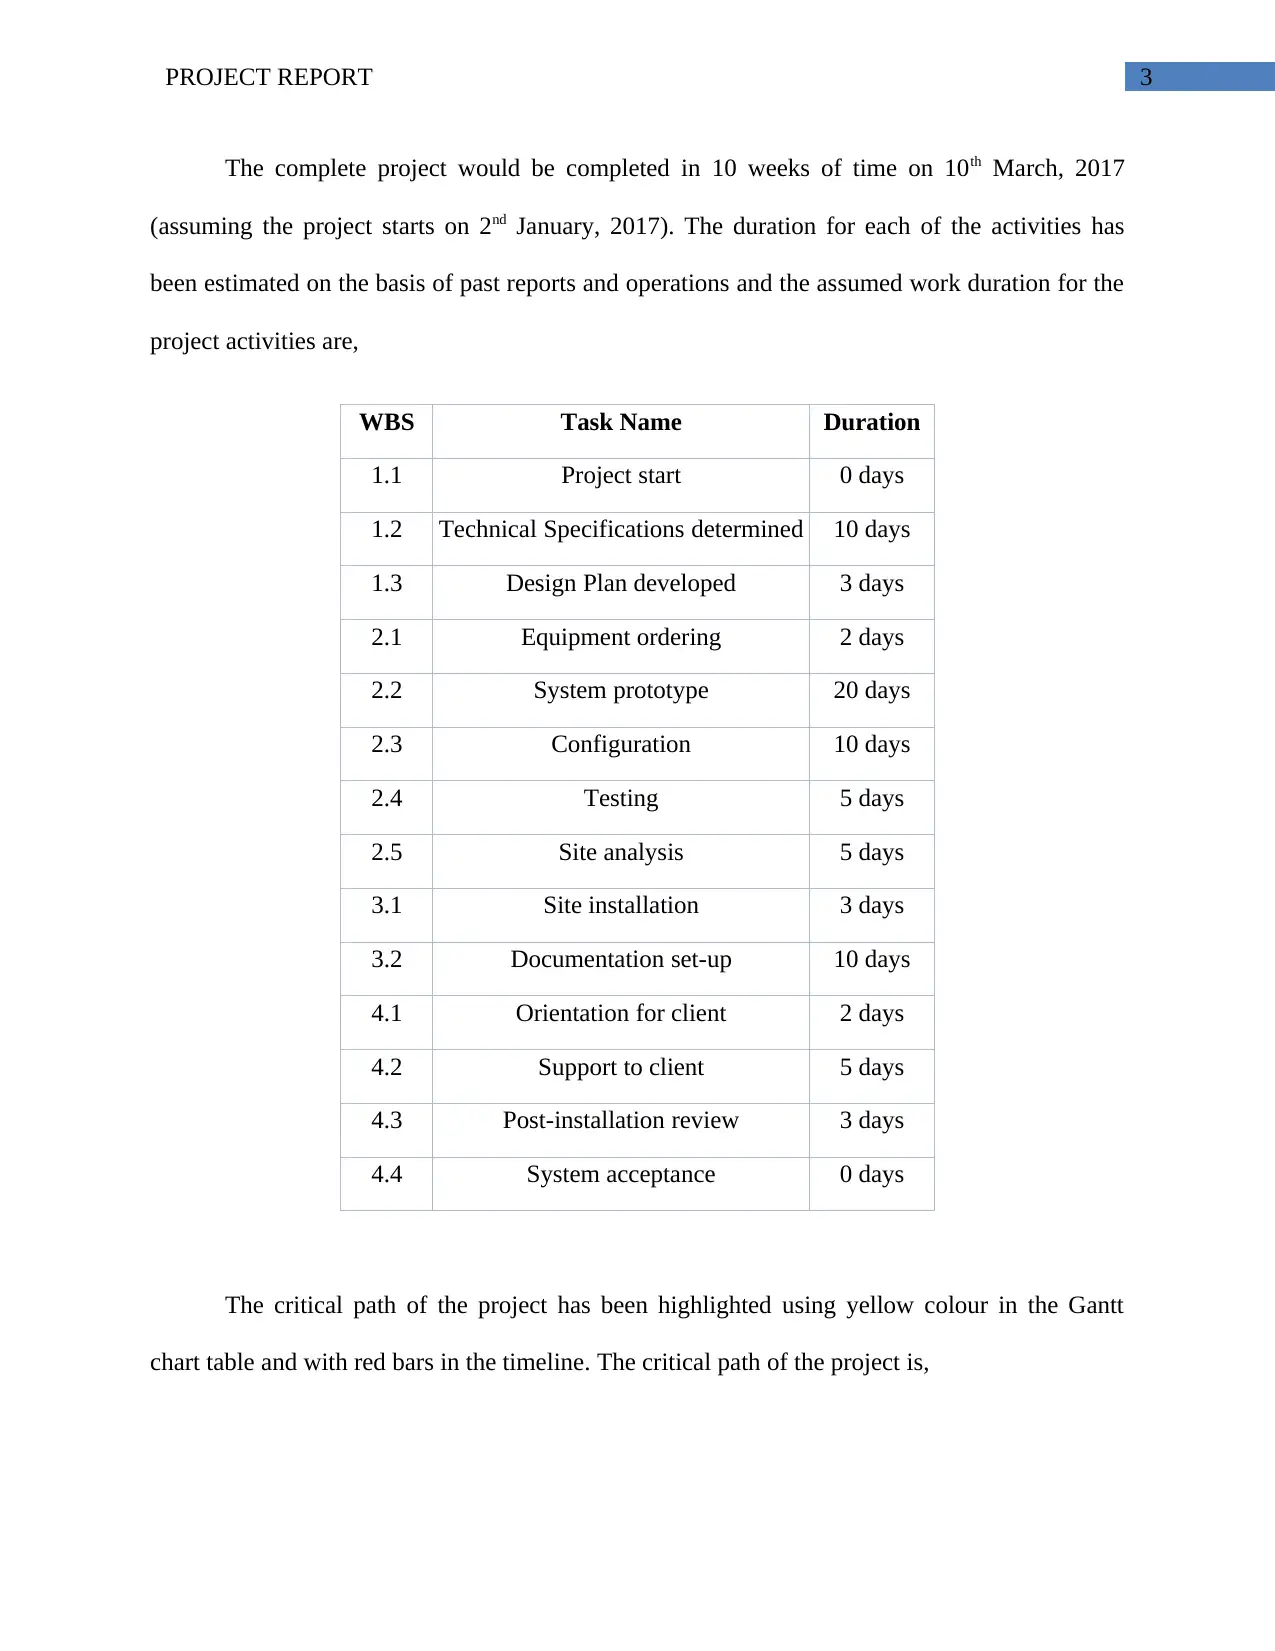
The complete project would be completed in 10 weeks of time on 10th March, 2017
(assuming the project starts on 2nd January, 2017). The duration for each of the activities has
been estimated on the basis of past reports and operations and the assumed work duration for the
project activities are,
WBS Task Name Duration
1.1 Project start 0 days
1.2 Technical Specifications determined 10 days
1.3 Design Plan developed 3 days
2.1 Equipment ordering 2 days
2.2 System prototype 20 days
2.3 Configuration 10 days
2.4 Testing 5 days
2.5 Site analysis 5 days
3.1 Site installation 3 days
3.2 Documentation set-up 10 days
4.1 Orientation for client 2 days
4.2 Support to client 5 days
4.3 Post-installation review 3 days
4.4 System acceptance 0 days
The critical path of the project has been highlighted using yellow colour in the Gantt
chart table and with red bars in the timeline. The critical path of the project is,
Paraphrase This Document
Need a fresh take? Get an instant paraphrase of this document with our AI Paraphraser
4PROJECT REPORT
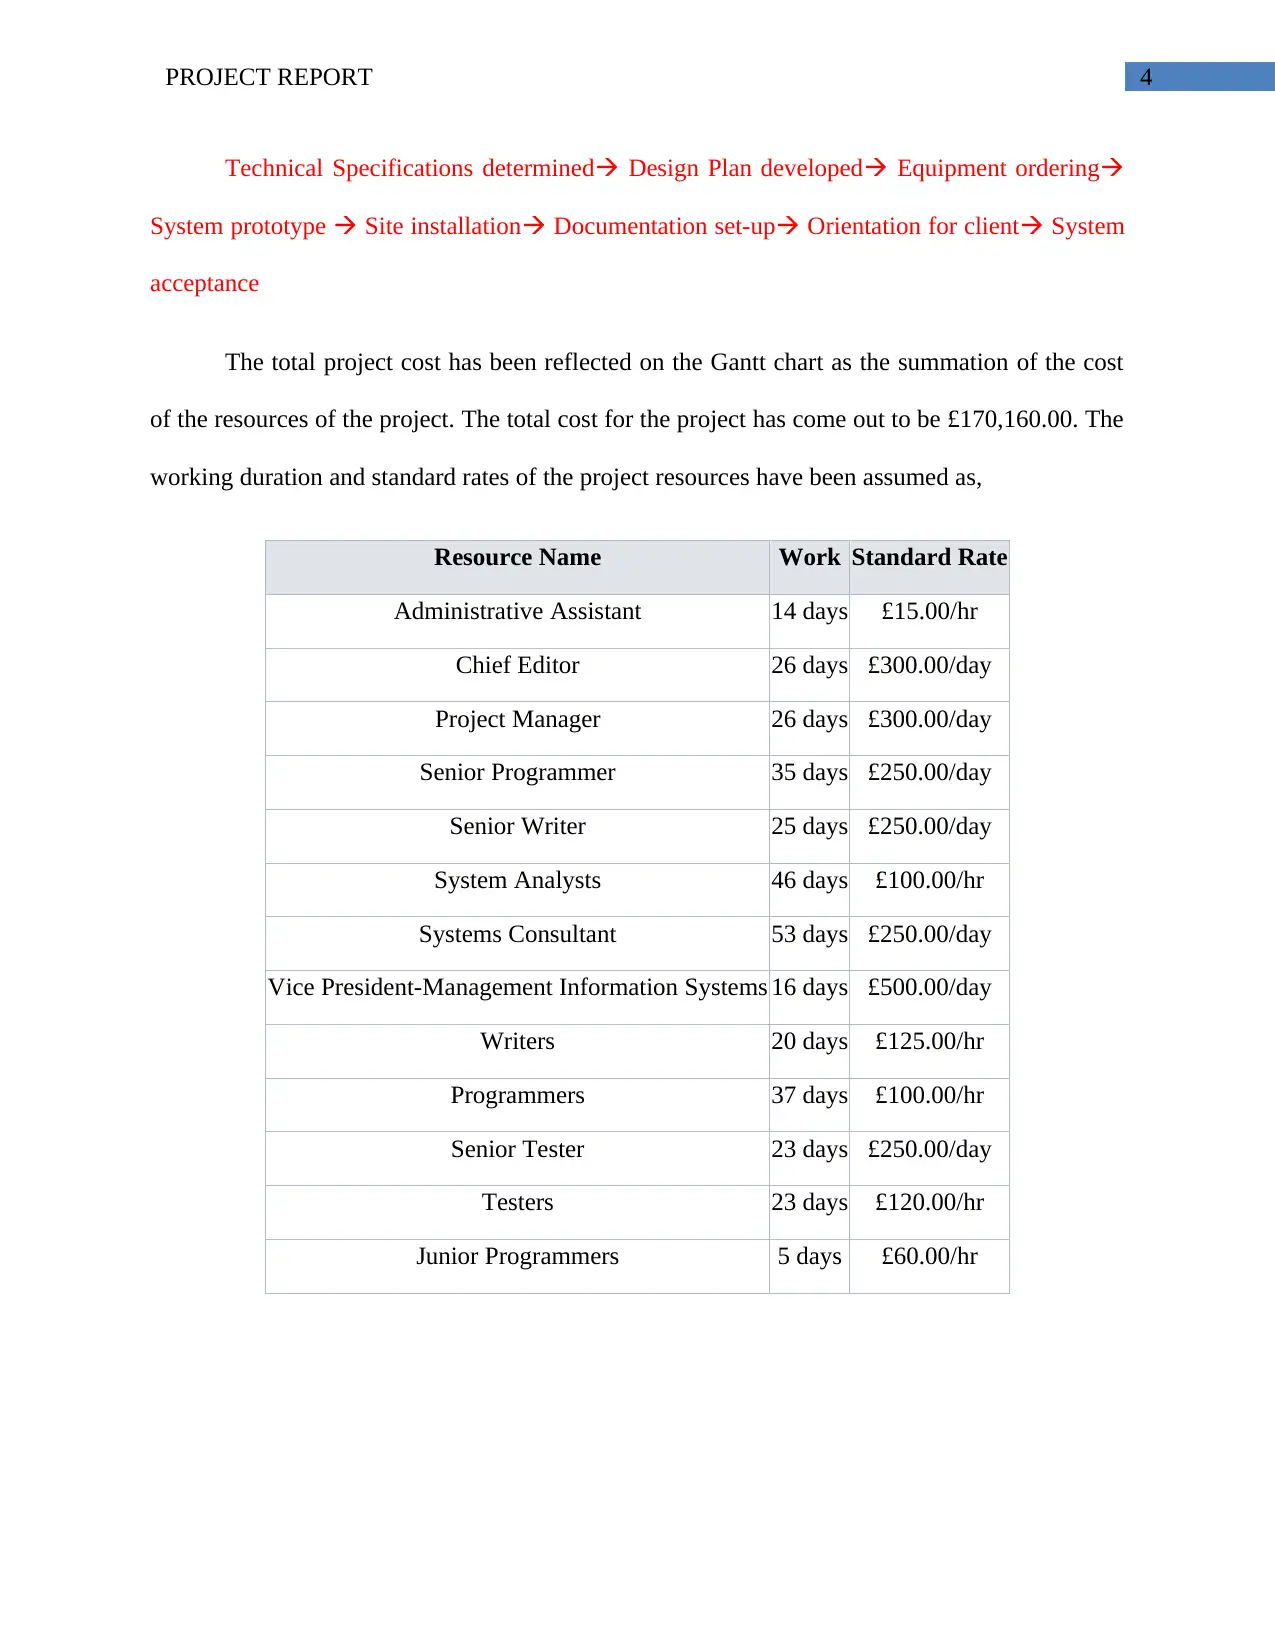
Technical Specifications determined Design Plan developed Equipment ordering
System prototype Site installation Documentation set-up Orientation for client System
acceptance
The total project cost has been reflected on the Gantt chart as the summation of the cost
of the resources of the project. The total cost for the project has come out to be £170,160.00. The
working duration and standard rates of the project resources have been assumed as,
Resource Name Work Standard Rate
Administrative Assistant 14 days £15.00/hr
Chief Editor 26 days £300.00/day
Project Manager 26 days £300.00/day
Senior Programmer 35 days £250.00/day
Senior Writer 25 days £250.00/day
System Analysts 46 days £100.00/hr
Systems Consultant 53 days £250.00/day
Vice President-Management Information Systems 16 days £500.00/day
Writers 20 days £125.00/hr
Programmers 37 days £100.00/hr
Senior Tester 23 days £250.00/day
Testers 23 days £120.00/hr
Junior Programmers 5 days £60.00/hr
5PROJECT REPORT
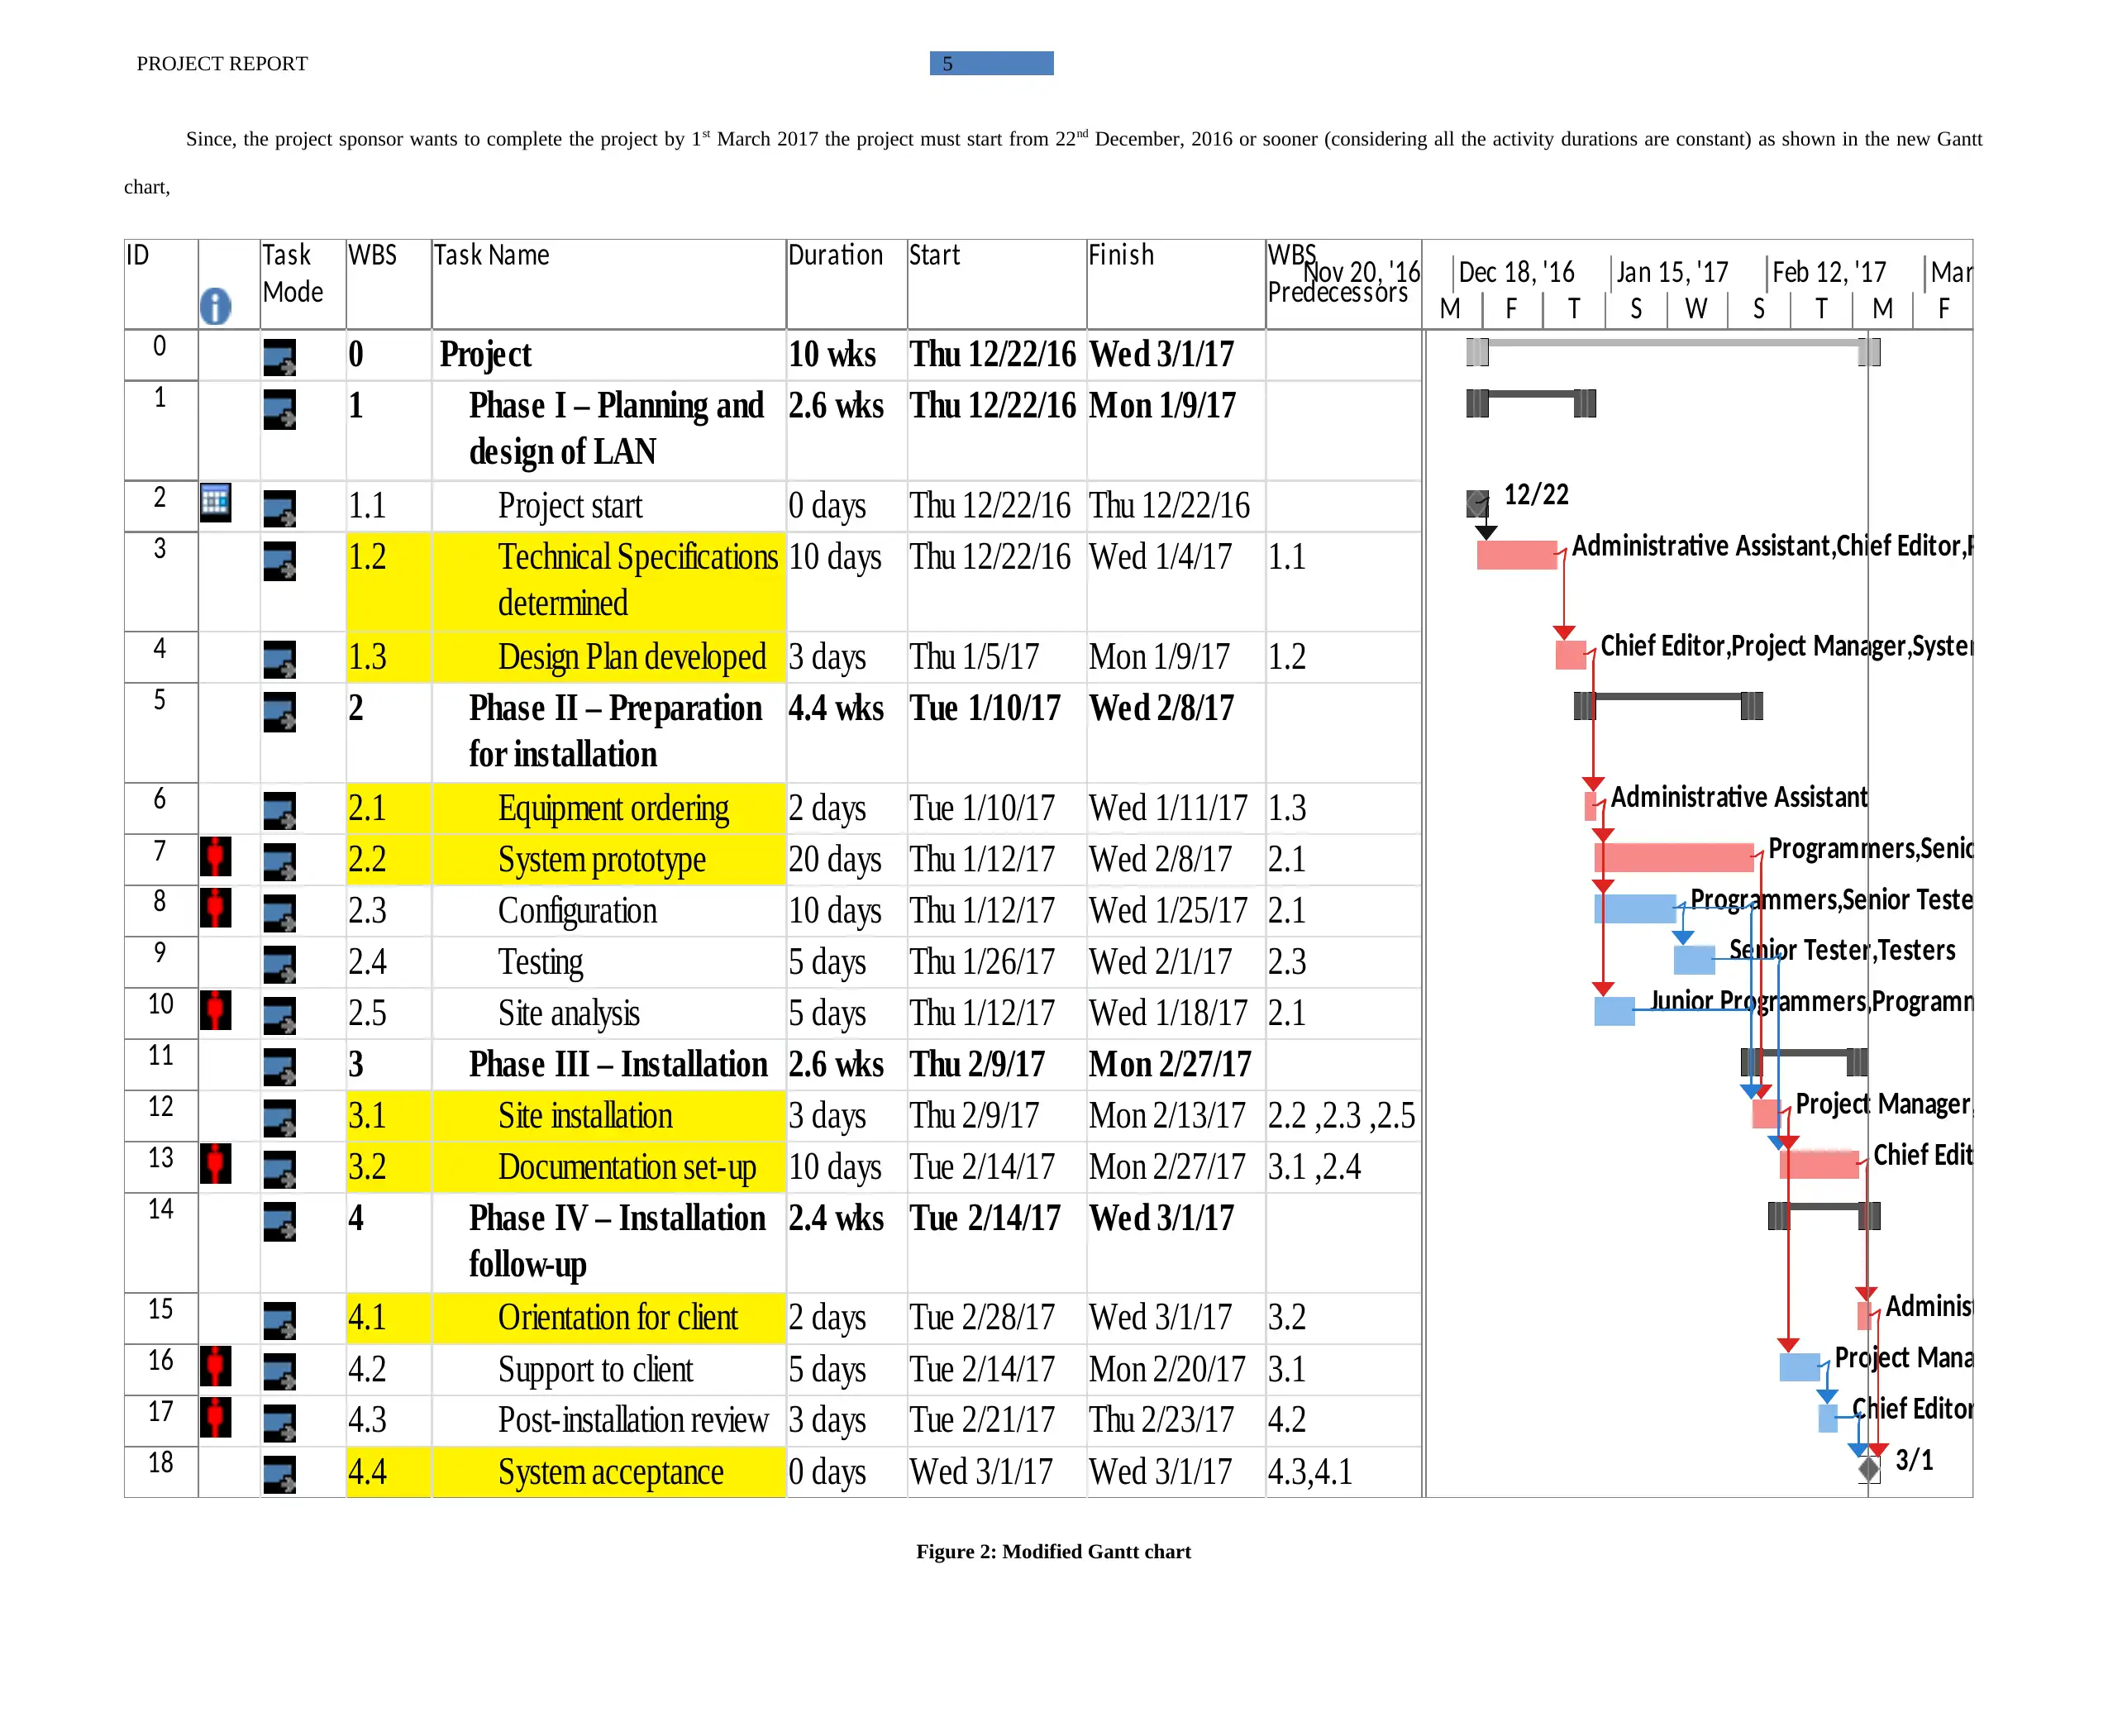
Since, the project sponsor wants to complete the project by 1st March 2017 the project must start from 22nd December, 2016 or sooner (considering all the activity durations are constant) as shown in the new Gantt
chart,
ID Task
Mode
WBS Task Name Duration Start Finish WBS
Predecessors
0 0 Project 10 wks Thu 12/22/16 Wed 3/1/17
1 1 Phase I – Planning and
design of LAN
2.6 wks Thu 12/22/16 Mon 1/9/17
2 1.1 Project start 0 days Thu 12/22/16 Thu 12/22/16
3 1.2 Technical Specifications
determined
10 days Thu 12/22/16 Wed 1/4/17 1.1
4 1.3 Design Plan developed 3 days Thu 1/5/17 Mon 1/9/17 1.2
5 2 Phase II – Preparation
for installation
4.4 wks Tue 1/10/17 Wed 2/8/17
6 2.1 Equipment ordering 2 days Tue 1/10/17 Wed 1/11/17 1.3
7 2.2 System prototype 20 days Thu 1/12/17 Wed 2/8/17 2.1
8 2.3 Configuration 10 days Thu 1/12/17 Wed 1/25/17 2.1
9 2.4 Testing 5 days Thu 1/26/17 Wed 2/1/17 2.3
10 2.5 Site analysis 5 days Thu 1/12/17 Wed 1/18/17 2.1
11 3 Phase III – Installation 2.6 wks Thu 2/9/17 Mon 2/27/17
12 3.1 Site installation 3 days Thu 2/9/17 Mon 2/13/17 2.2 ,2.3 ,2.5
13 3.2 Documentation set-up 10 days Tue 2/14/17 Mon 2/27/17 3.1 ,2.4
14 4 Phase IV – Installation
follow-up
2.4 wks Tue 2/14/17 Wed 3/1/17
15 4.1 Orientation for client 2 days Tue 2/28/17 Wed 3/1/17 3.2
16 4.2 Support to client 5 days Tue 2/14/17 Mon 2/20/17 3.1
17 4.3 Post-installation review 3 days Tue 2/21/17 Thu 2/23/17 4.2
18 4.4 System acceptance 0 days Wed 3/1/17 Wed 3/1/17 4.3,4.1
12/22
Administrative Assistant,Chief Editor,Project Manag
Chief Editor,Project Manager,System Analysts,Vi
Administrative Assistant
Programmers,Senior Programme
Programmers,Senior Tester,Systems Co
Senior Tester,Testers
Junior Programmers,Programmers,System A
Project Manager,Senior Teste
Chief Editor,Senior Wr
Administrative Assist
Project Manager,Senior Pr
Chief Editor,Project Man
3/1
M F T S W S T M F
Nov 20, '16 Dec 18, '16 Jan 15, '17 Feb 12, '17 Mar 12, '17
Figure 2: Modified Gantt chart
⊘ This is a preview!⊘
Do you want full access?
Subscribe today to unlock all pages.
Trusted by 1+ million students worldwide
6PROJECT REPORT
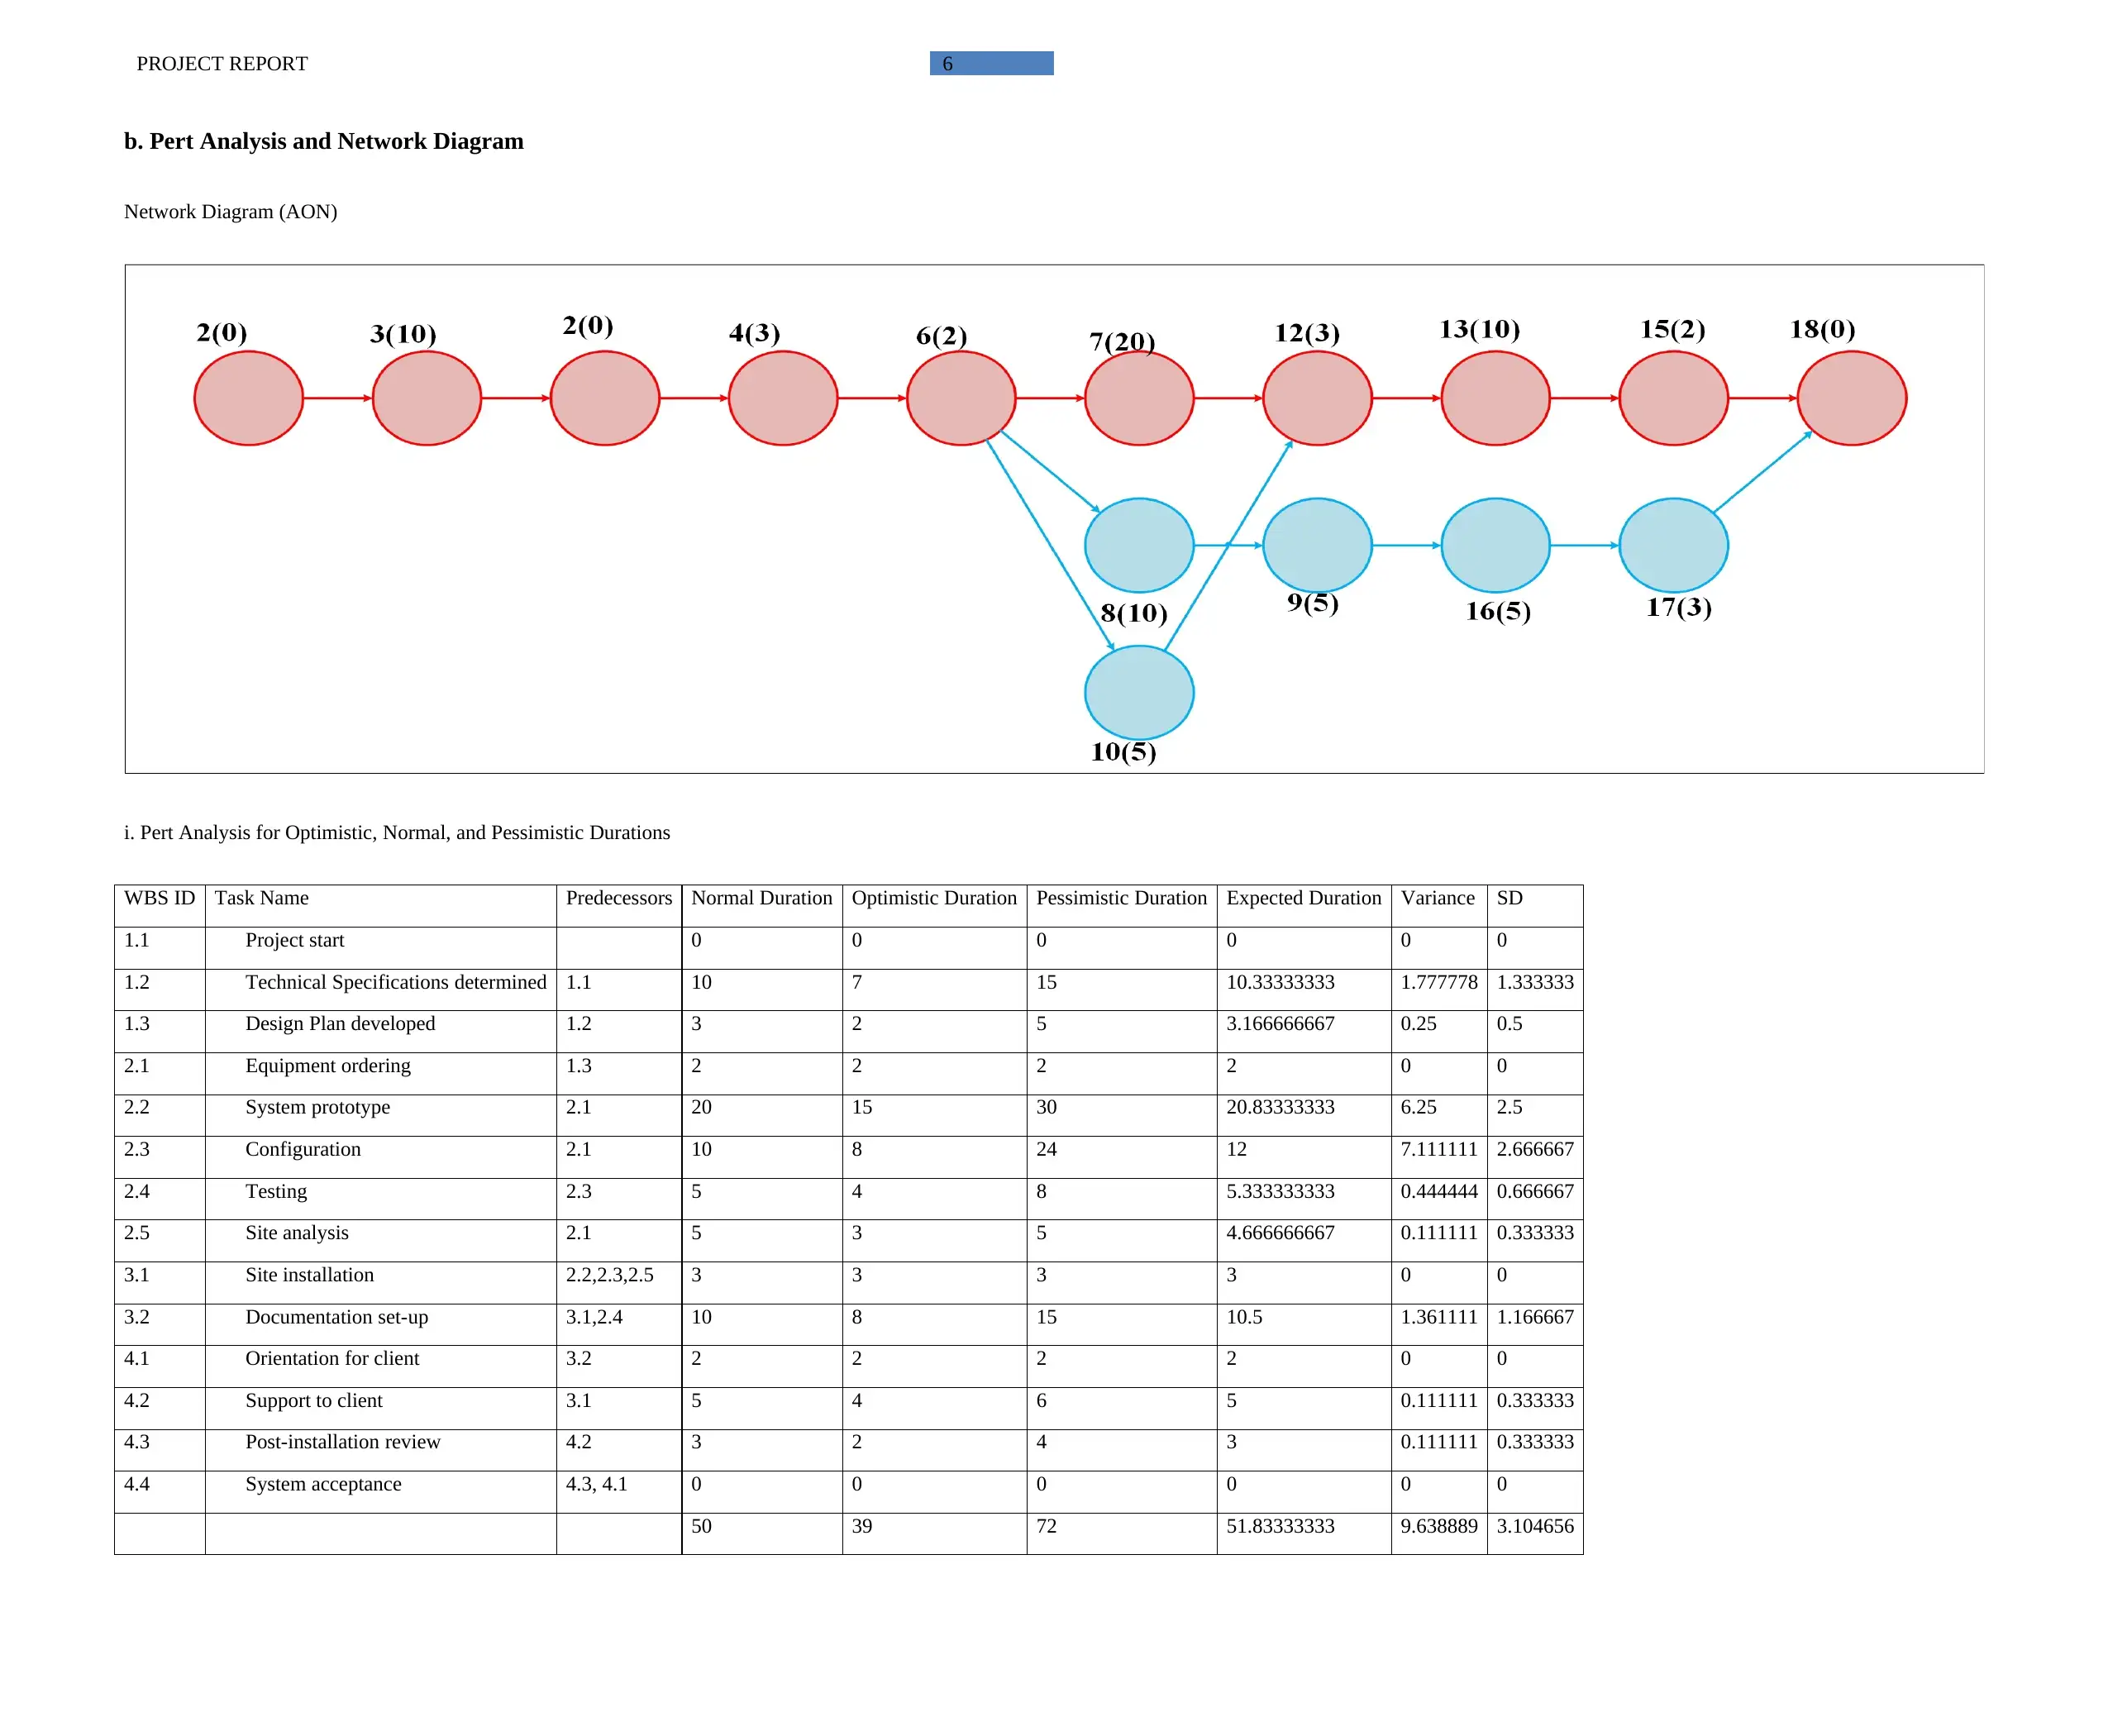
b. Pert Analysis and Network Diagram
Network Diagram (AON)
i. Pert Analysis for Optimistic, Normal, and Pessimistic Durations
WBS ID Task Name Predecessors Normal Duration Optimistic Duration Pessimistic Duration Expected Duration Variance SD
1.1 Project start 0 0 0 0 0 0
1.2 Technical Specifications determined 1.1 10 7 15 10.33333333 1.777778 1.333333
1.3 Design Plan developed 1.2 3 2 5 3.166666667 0.25 0.5
2.1 Equipment ordering 1.3 2 2 2 2 0 0
2.2 System prototype 2.1 20 15 30 20.83333333 6.25 2.5
2.3 Configuration 2.1 10 8 24 12 7.111111 2.666667
2.4 Testing 2.3 5 4 8 5.333333333 0.444444 0.666667
2.5 Site analysis 2.1 5 3 5 4.666666667 0.111111 0.333333
3.1 Site installation 2.2,2.3,2.5 3 3 3 3 0 0
3.2 Documentation set-up 3.1,2.4 10 8 15 10.5 1.361111 1.166667
4.1 Orientation for client 3.2 2 2 2 2 0 0
4.2 Support to client 3.1 5 4 6 5 0.111111 0.333333
4.3 Post-installation review 4.2 3 2 4 3 0.111111 0.333333
4.4 System acceptance 4.3, 4.1 0 0 0 0 0 0
50 39 72 51.83333333 9.638889 3.104656
Paraphrase This Document
Need a fresh take? Get an instant paraphrase of this document with our AI Paraphraser
7PROJECT REPORT
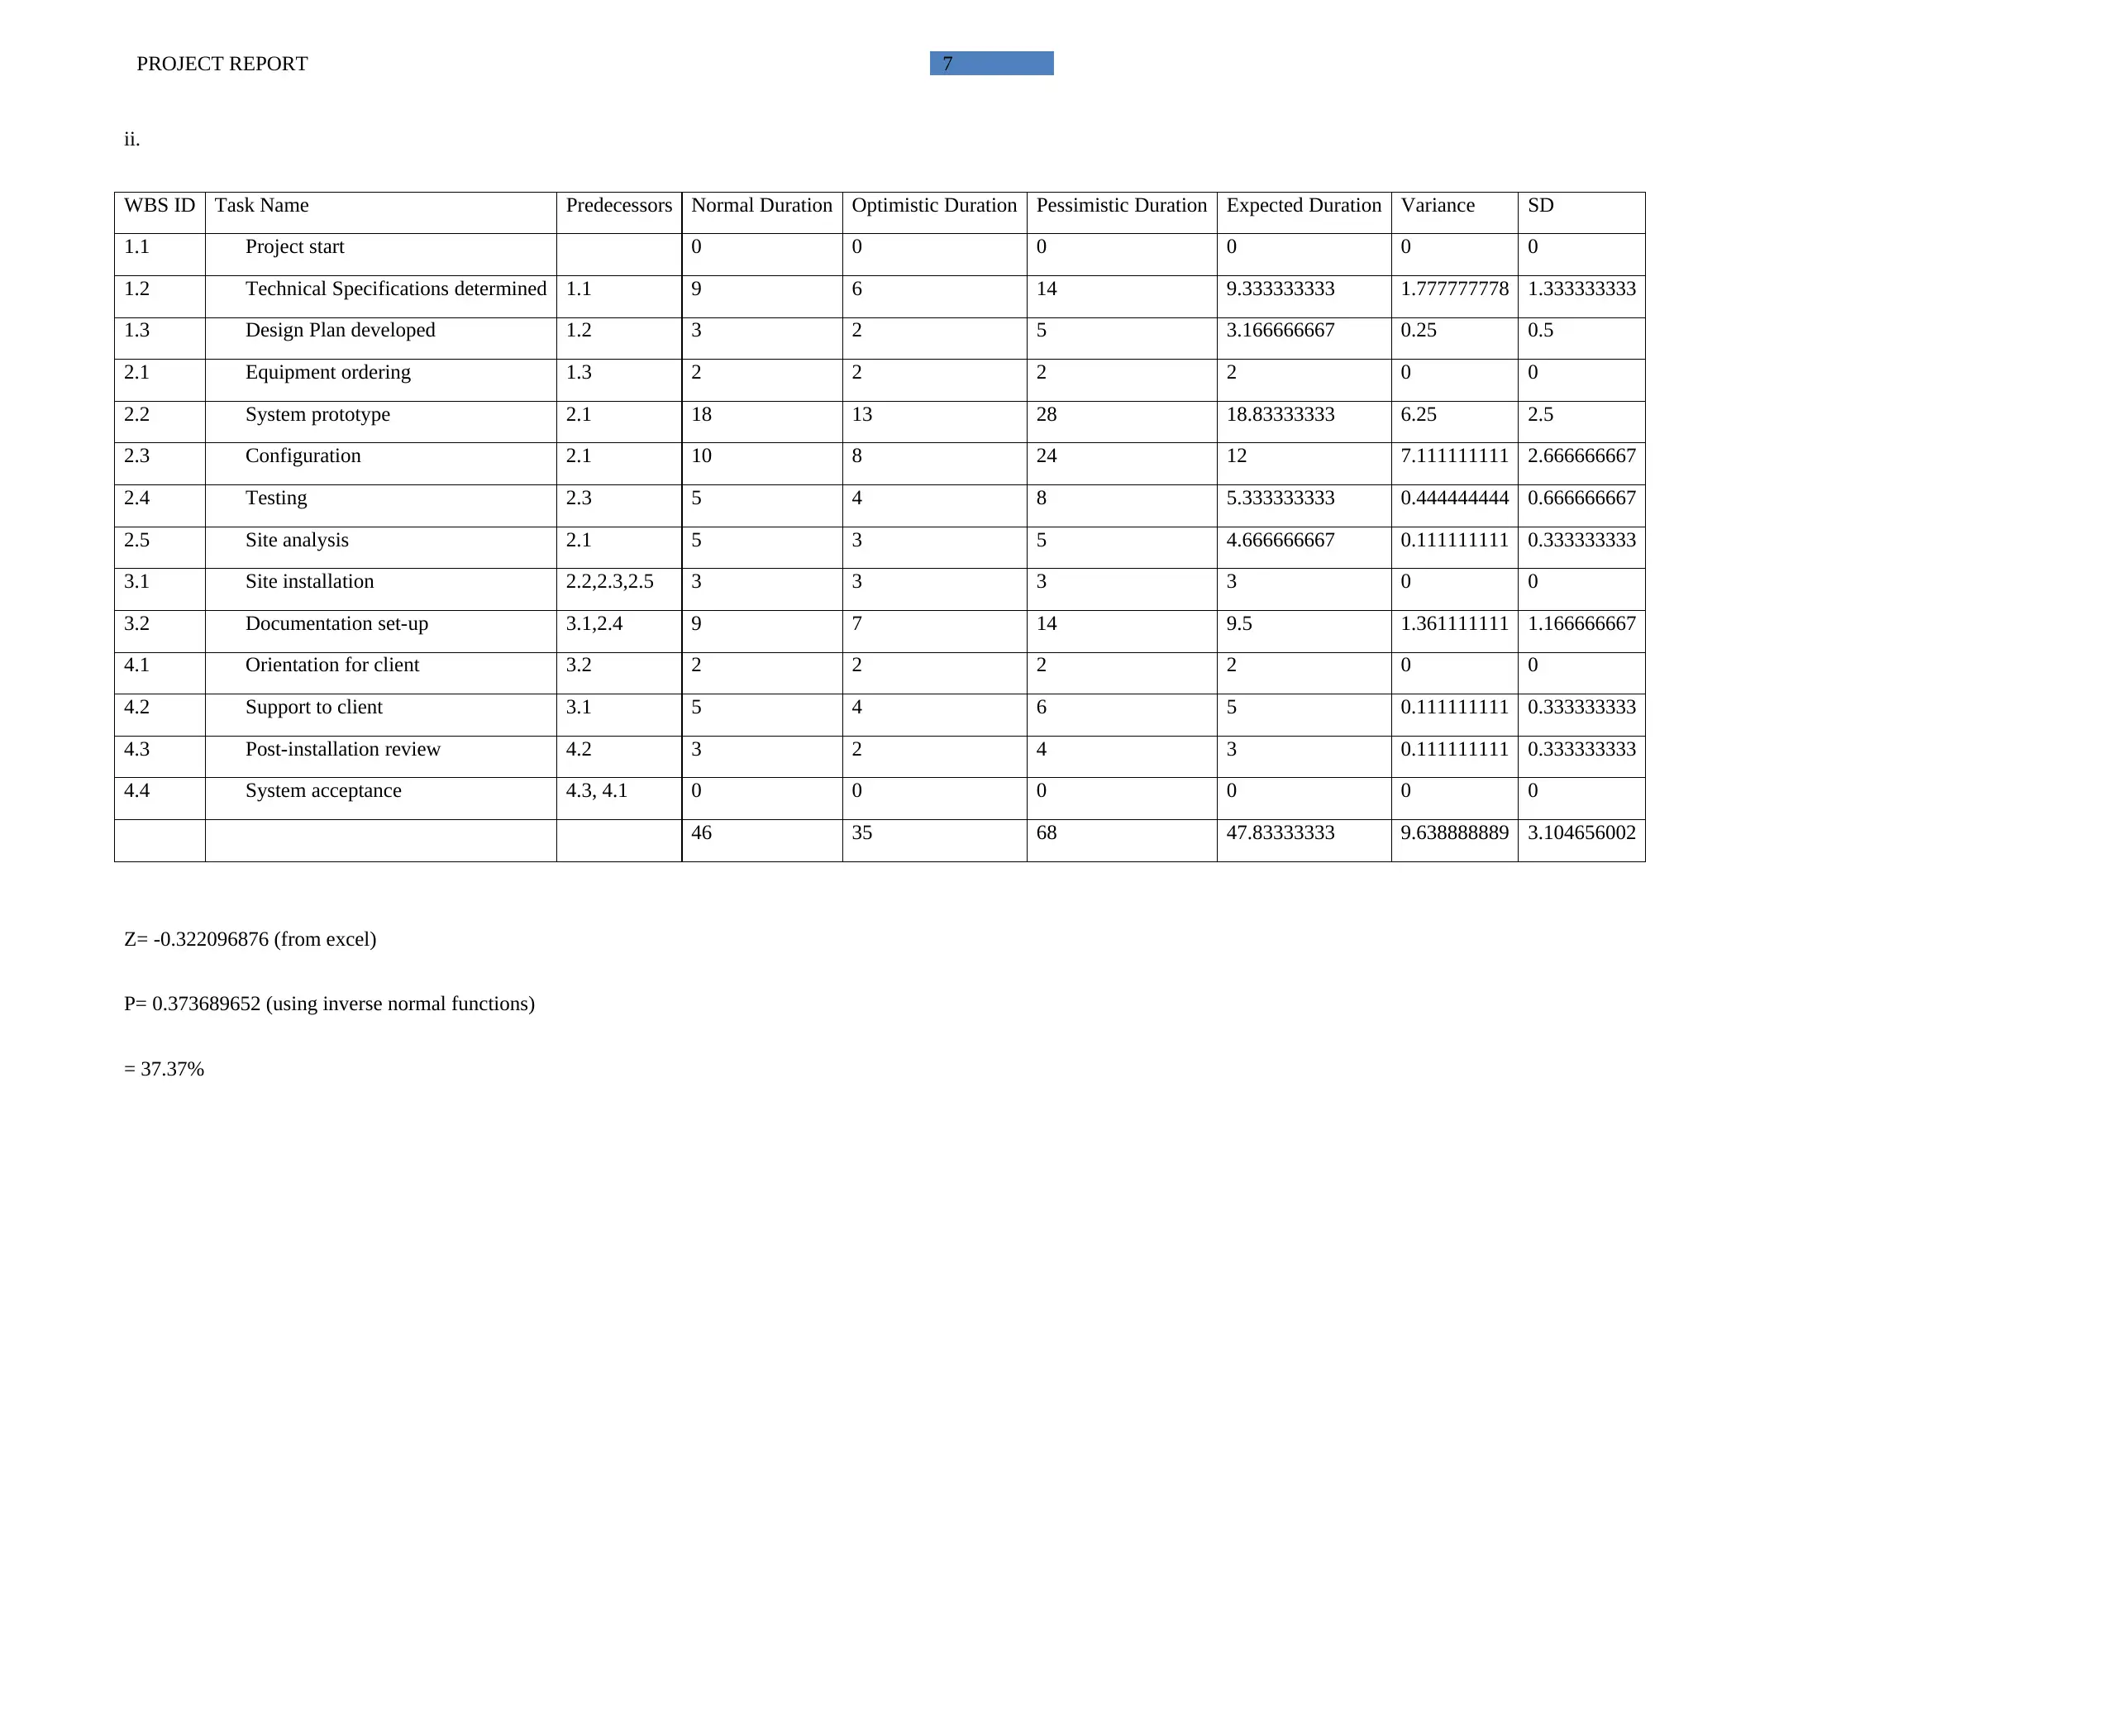
ii.
WBS ID Task Name Predecessors Normal Duration Optimistic Duration Pessimistic Duration Expected Duration Variance SD
1.1 Project start 0 0 0 0 0 0
1.2 Technical Specifications determined 1.1 9 6 14 9.333333333 1.777777778 1.333333333
1.3 Design Plan developed 1.2 3 2 5 3.166666667 0.25 0.5
2.1 Equipment ordering 1.3 2 2 2 2 0 0
2.2 System prototype 2.1 18 13 28 18.83333333 6.25 2.5
2.3 Configuration 2.1 10 8 24 12 7.111111111 2.666666667
2.4 Testing 2.3 5 4 8 5.333333333 0.444444444 0.666666667
2.5 Site analysis 2.1 5 3 5 4.666666667 0.111111111 0.333333333
3.1 Site installation 2.2,2.3,2.5 3 3 3 3 0 0
3.2 Documentation set-up 3.1,2.4 9 7 14 9.5 1.361111111 1.166666667
4.1 Orientation for client 3.2 2 2 2 2 0 0
4.2 Support to client 3.1 5 4 6 5 0.111111111 0.333333333
4.3 Post-installation review 4.2 3 2 4 3 0.111111111 0.333333333
4.4 System acceptance 4.3, 4.1 0 0 0 0 0 0
46 35 68 47.83333333 9.638888889 3.104656002
Z= -0.322096876 (from excel)
P= 0.373689652 (using inverse normal functions)
= 37.37%
8PROJECT REPORT
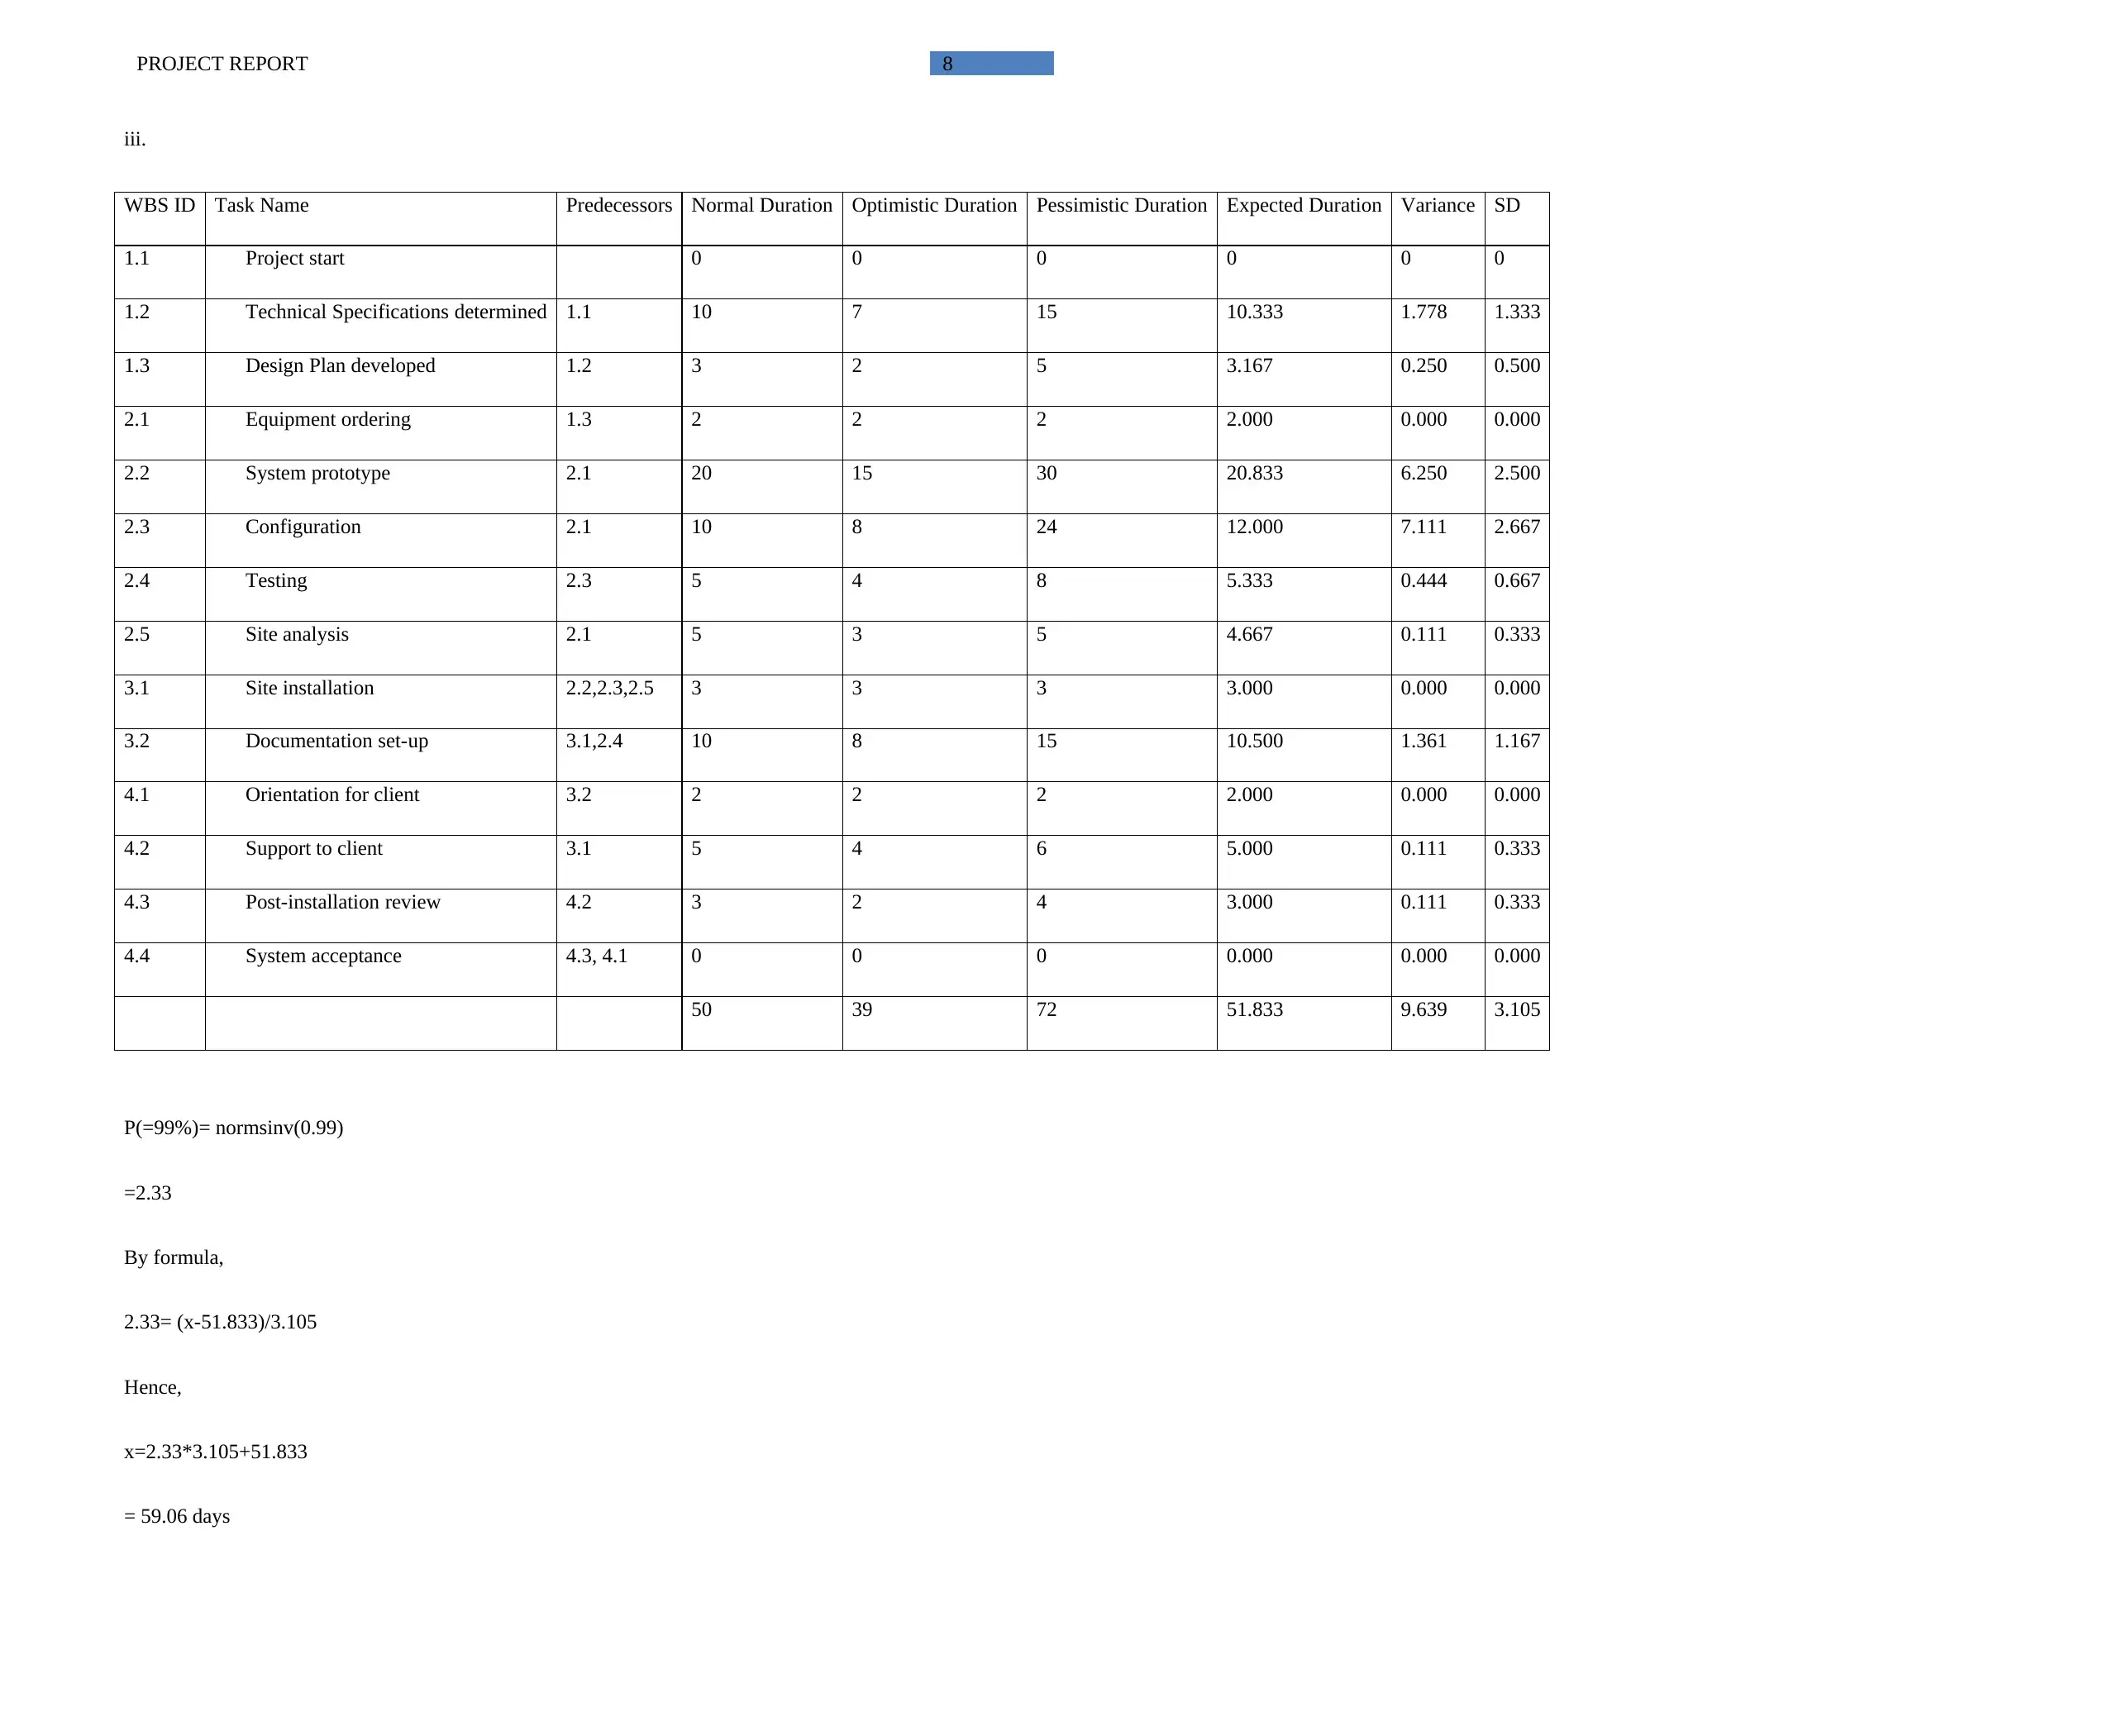
iii.
WBS ID Task Name Predecessors Normal Duration Optimistic Duration Pessimistic Duration Expected Duration Variance SD
1.1 Project start 0 0 0 0 0 0
1.2 Technical Specifications determined 1.1 10 7 15 10.333 1.778 1.333
1.3 Design Plan developed 1.2 3 2 5 3.167 0.250 0.500
2.1 Equipment ordering 1.3 2 2 2 2.000 0.000 0.000
2.2 System prototype 2.1 20 15 30 20.833 6.250 2.500
2.3 Configuration 2.1 10 8 24 12.000 7.111 2.667
2.4 Testing 2.3 5 4 8 5.333 0.444 0.667
2.5 Site analysis 2.1 5 3 5 4.667 0.111 0.333
3.1 Site installation 2.2,2.3,2.5 3 3 3 3.000 0.000 0.000
3.2 Documentation set-up 3.1,2.4 10 8 15 10.500 1.361 1.167
4.1 Orientation for client 3.2 2 2 2 2.000 0.000 0.000
4.2 Support to client 3.1 5 4 6 5.000 0.111 0.333
4.3 Post-installation review 4.2 3 2 4 3.000 0.111 0.333
4.4 System acceptance 4.3, 4.1 0 0 0 0.000 0.000 0.000
50 39 72 51.833 9.639 3.105
P(=99%)= normsinv(0.99)
=2.33
By formula,
2.33= (x-51.833)/3.105
Hence,
x=2.33*3.105+51.833
= 59.06 days
⊘ This is a preview!⊘
Do you want full access?
Subscribe today to unlock all pages.
Trusted by 1+ million students worldwide
9PROJECT REPORT
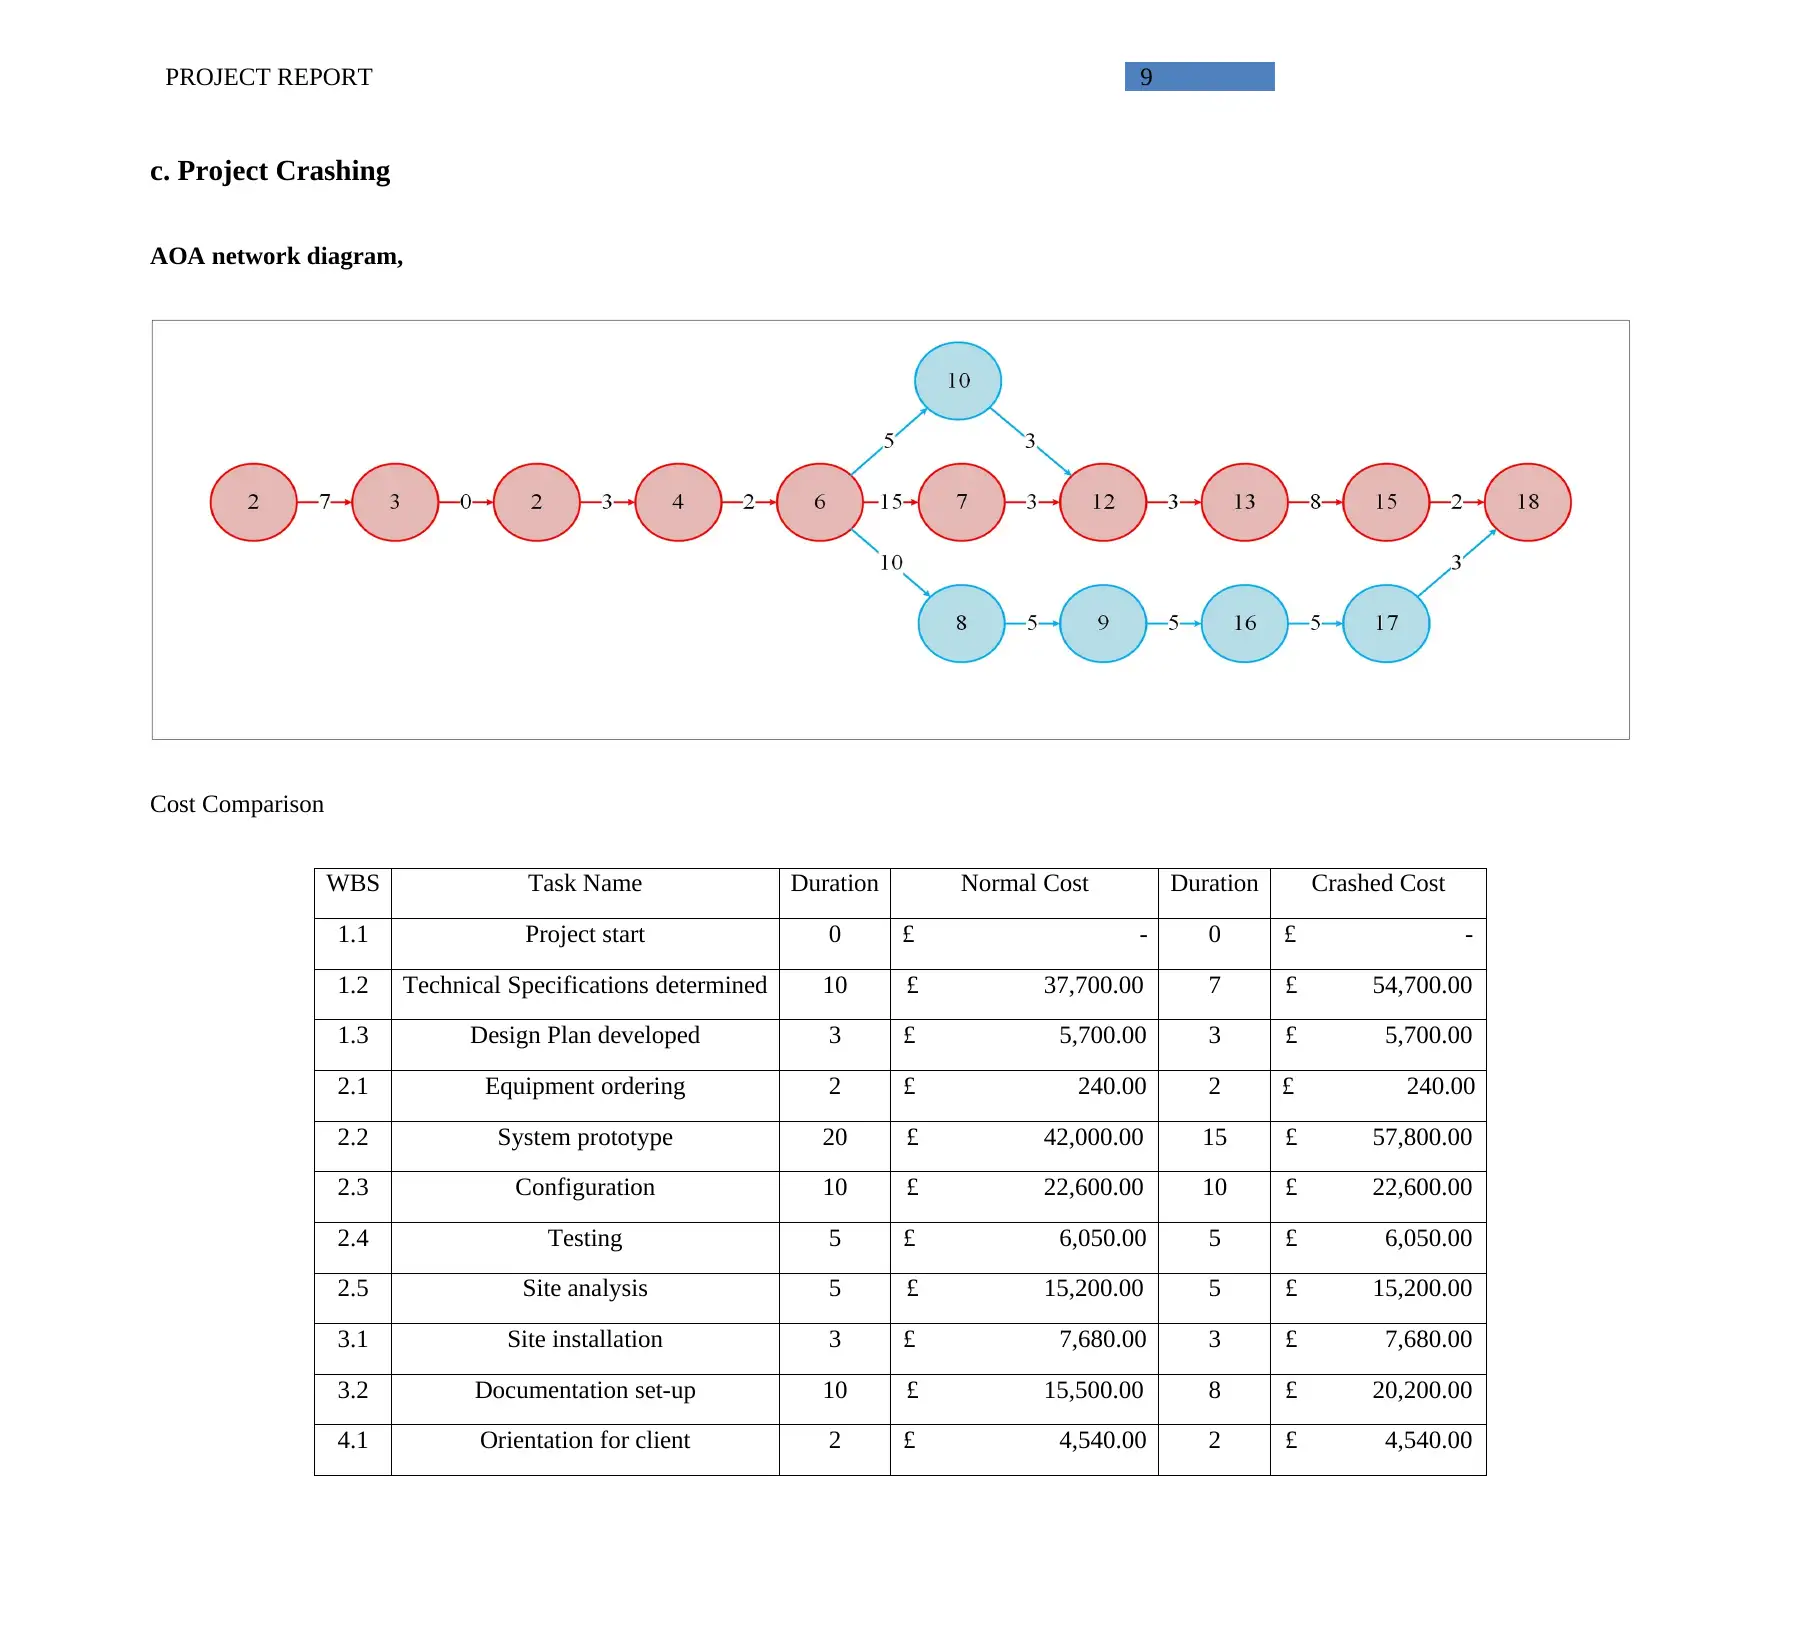
c. Project Crashing
AOA network diagram,
Cost Comparison
WBS Task Name Duration Normal Cost Duration Crashed Cost
1.1 Project start 0 £ - 0 £ -
1.2 Technical Specifications determined 10 £ 37,700.00 7 £ 54,700.00
1.3 Design Plan developed 3 £ 5,700.00 3 £ 5,700.00
2.1 Equipment ordering 2 £ 240.00 2 £ 240.00
2.2 System prototype 20 £ 42,000.00 15 £ 57,800.00
2.3 Configuration 10 £ 22,600.00 10 £ 22,600.00
2.4 Testing 5 £ 6,050.00 5 £ 6,050.00
2.5 Site analysis 5 £ 15,200.00 5 £ 15,200.00
3.1 Site installation 3 £ 7,680.00 3 £ 7,680.00
3.2 Documentation set-up 10 £ 15,500.00 8 £ 20,200.00
4.1 Orientation for client 2 £ 4,540.00 2 £ 4,540.00
Paraphrase This Document
Need a fresh take? Get an instant paraphrase of this document with our AI Paraphraser
10PROJECT REPORT
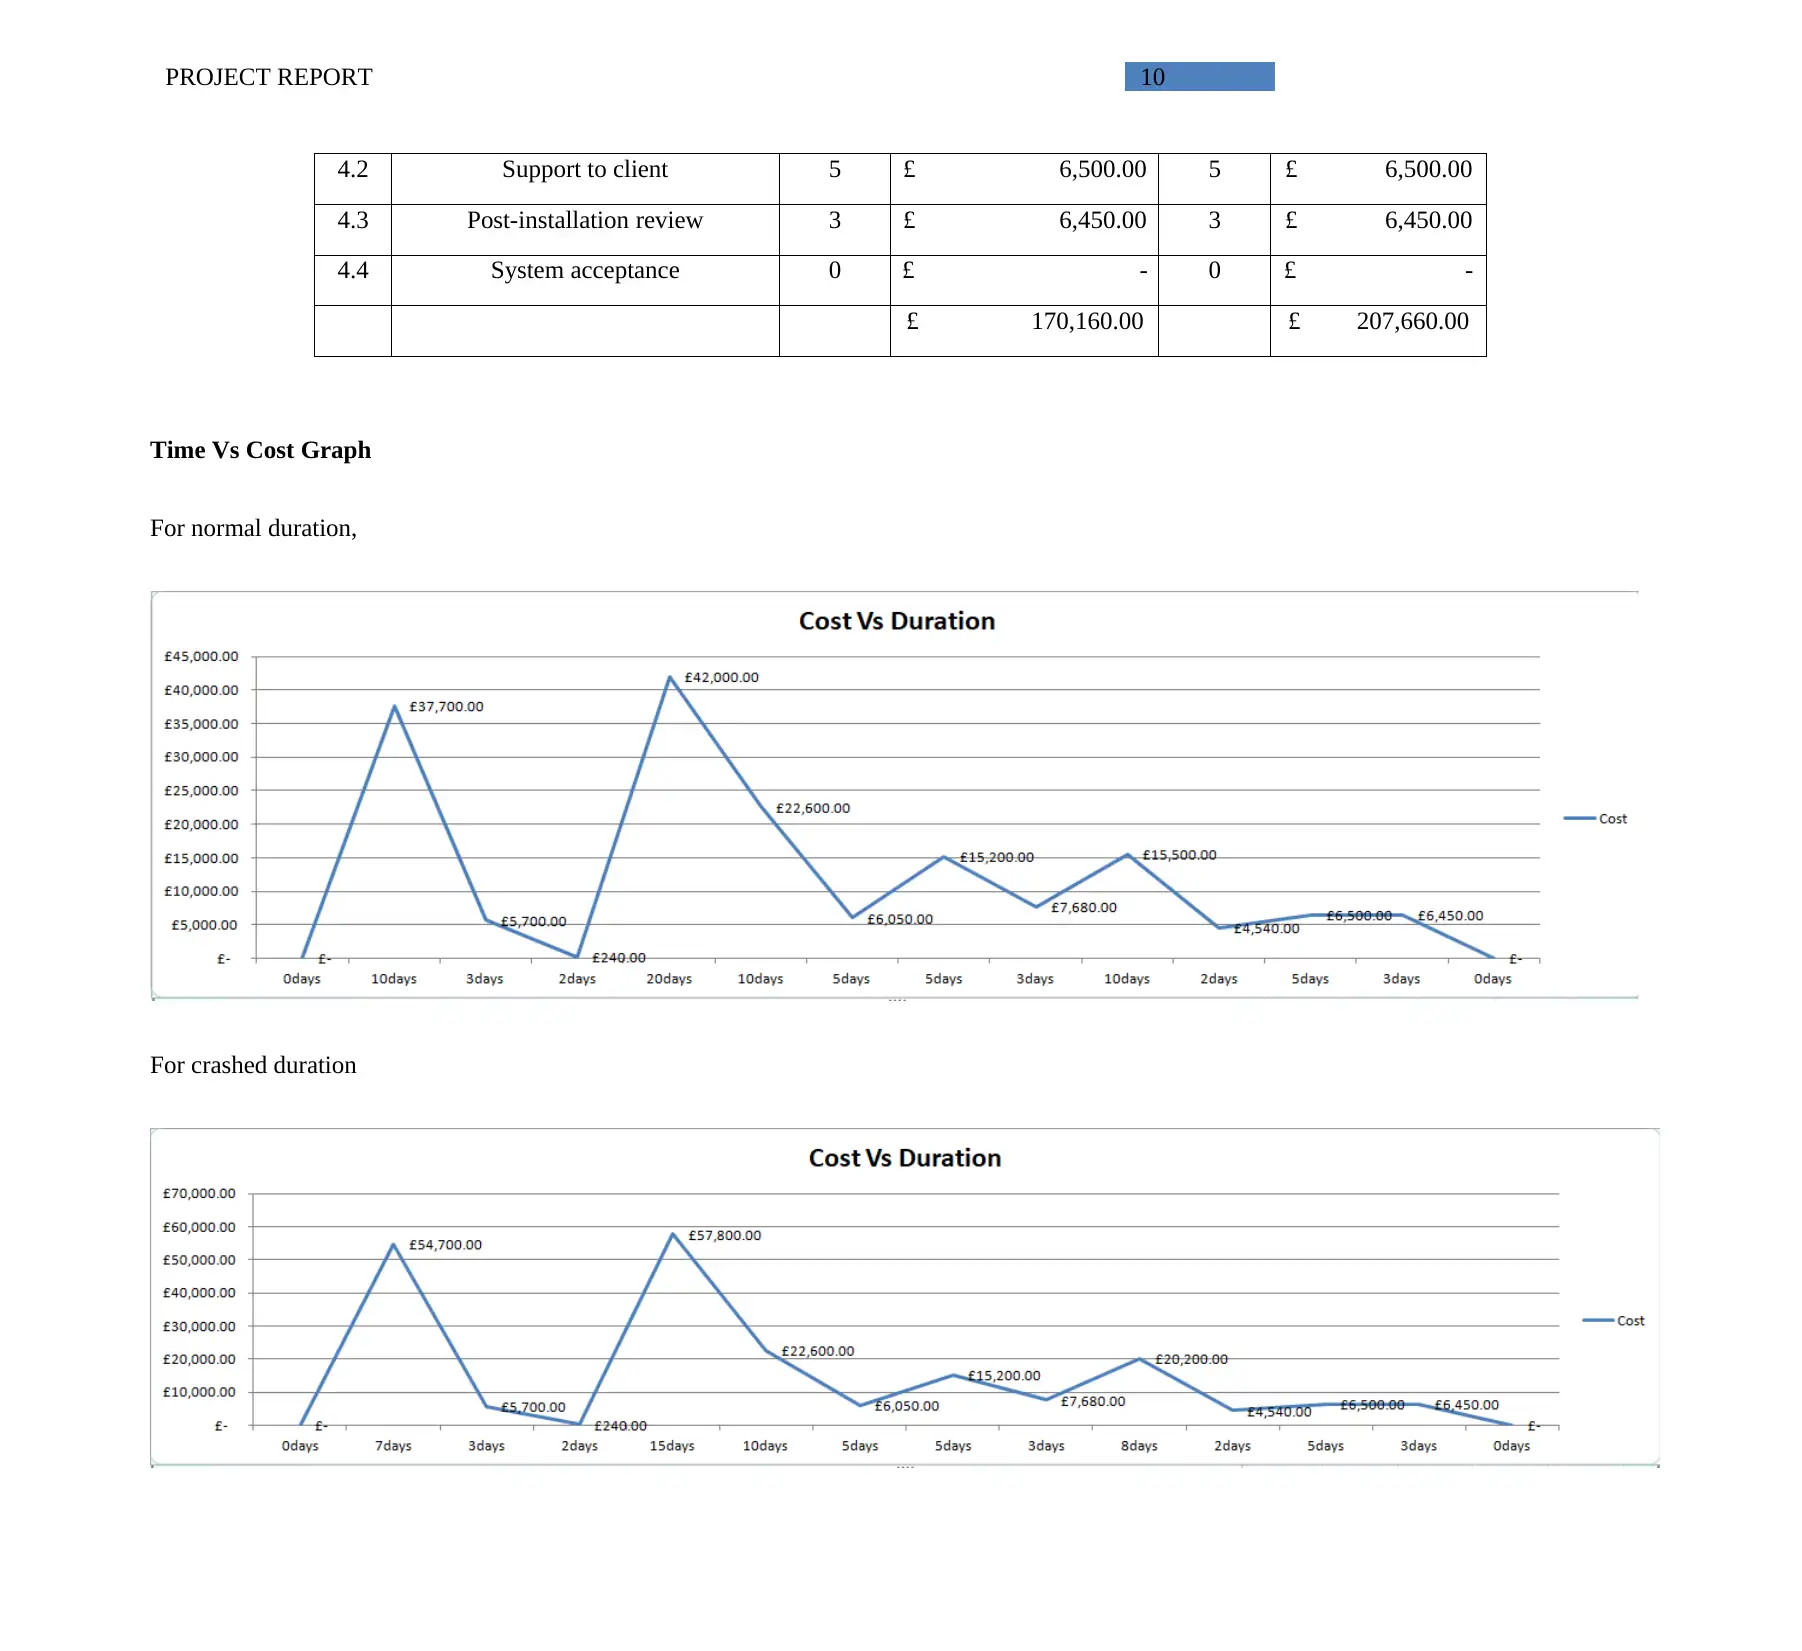
4.2 Support to client 5 £ 6,500.00 5 £ 6,500.00
4.3 Post-installation review 3 £ 6,450.00 3 £ 6,450.00
4.4 System acceptance 0 £ - 0 £ -
£ 170,160.00 £ 207,660.00
Time Vs Cost Graph
For normal duration,
For crashed duration
4.2 Support to client 5 £ 6,500.00 5 £ 6,500.00
4.3 Post-installation review 3 £ 6,450.00 3 £ 6,450.00
4.4 System acceptance 0 £ - 0 £ -
£ 170,160.00 £ 207,660.00
Time Vs Cost Graph
For normal duration,
For crashed duration
11PROJECT REPORT
Conclusion
It can be concluded from the assignment that the implication of the improved project
management principles. The deployment of the operations had supported the utilization of the
activities favouring the implication of the improved operation development.
Conclusion
It can be concluded from the assignment that the implication of the improved project
management principles. The deployment of the operations had supported the utilization of the
activities favouring the implication of the improved operation development.
⊘ This is a preview!⊘
Do you want full access?
Subscribe today to unlock all pages.
Trusted by 1+ million students worldwide
1 out of 13
Related Documents


Your All-in-One AI-Powered Toolkit for Academic Success.
+13062052269
info@desklib.com
Available 24*7 on WhatsApp / Email
![[object Object]](/_next/static/media/star-bottom.7253800d.svg)
Unlock your academic potential
Copyright © 2020–2026 A2Z Services. All Rights Reserved. Developed and managed by ZUCOL.