Financial Analysis: Charter Hall Group, International Property Finance
VerifiedAdded on 2021/09/10
|13
|2512
|41
Report
AI Summary
This report presents a financial analysis of the Charter Hall Group, a major player in the Australian property market. The analysis covers various aspects of the company's financial structure, including development funding, the average weighted cost of capital, and the internal rate of return (IRR). The report examines key performance indicators, financial ratios, cash flow, and market capitalization. The study also delves into micro property data to assess the company's operational and financial performance. The analysis is based on the company's annual reports and aims to provide insights into the financial health and operational strategies of the Charter Hall Group, offering a comprehensive overview of its investment activities and financial standing.
Running head: INTERNATIONAL PROPERTY ANALYSIS
International Property Analysis
Name of the Student:
Name of the University:
Author’s Note:
International Property Analysis
Name of the Student:
Name of the University:
Author’s Note:
Paraphrase This Document
Need a fresh take? Get an instant paraphrase of this document with our AI Paraphraser
1INTERNATIONAL PROPERTY FINANCE
Executive Summary
The aim of the project is to conduct a financial analysis on the Charter Hall Group and the
relevant analysis of the different components of the Group. There were several cases analyzed
for identification of the key factors involved in the annual report of the group and the
simultaneous effect on the financials of the company. The financial structure and the various
components of the company were taken from the annual report of the company in order to
evaluate the changes of the same. The financial structure prepared for the company will help us
guide the key performance indicators of the company and the performance of the company with
respect to the performance of the benchmark.
2INTERNATIONAL PROPERTY FINANCE
Table of Contents
Introduction......................................................................................................................................3
Discussion........................................................................................................................................3
Development Funding.................................................................................................................3
Average Weighted Cost of Capital..............................................................................................4
Internal Rate of Return (IRR)/Annualized Total Returns;..........................................................5
Management Burden....................................................................................................................5
Net Tangible Assets.....................................................................................................................6
Unit Price.....................................................................................................................................6
Tax Exposure...............................................................................................................................6
Gearing Ratio and Leverage........................................................................................................7
Cash Flow....................................................................................................................................7
Market Capitalization..................................................................................................................7
Micro Property Data....................................................................................................................8
Conclusion.....................................................................................................................................10
Reference.......................................................................................................................................11
⊘ This is a preview!⊘
Do you want full access?
Subscribe today to unlock all pages.
Trusted by 1+ million students worldwide
3INTERNATIONAL PROPERTY FINANCE
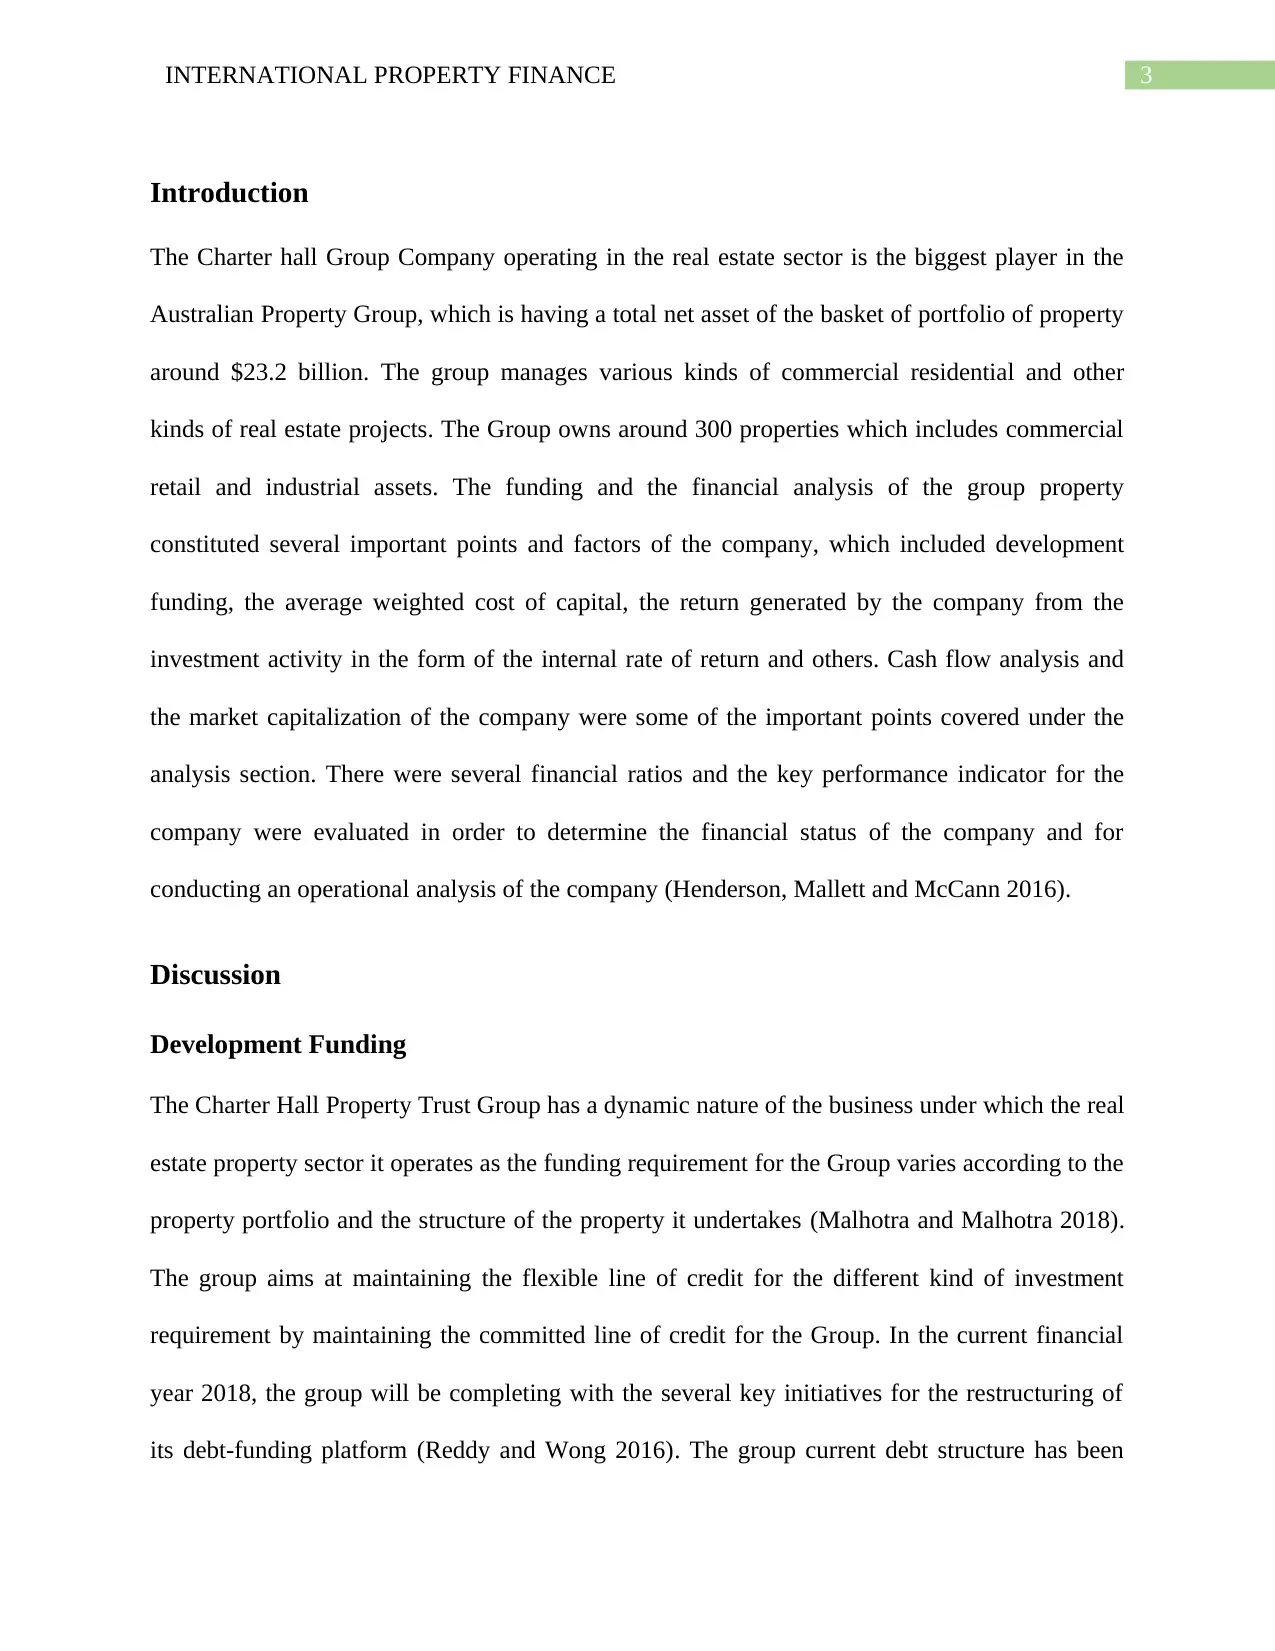
Introduction
The Charter hall Group Company operating in the real estate sector is the biggest player in the
Australian Property Group, which is having a total net asset of the basket of portfolio of property
around $23.2 billion. The group manages various kinds of commercial residential and other
kinds of real estate projects. The Group owns around 300 properties which includes commercial
retail and industrial assets. The funding and the financial analysis of the group property
constituted several important points and factors of the company, which included development
funding, the average weighted cost of capital, the return generated by the company from the
investment activity in the form of the internal rate of return and others. Cash flow analysis and
the market capitalization of the company were some of the important points covered under the
analysis section. There were several financial ratios and the key performance indicator for the
company were evaluated in order to determine the financial status of the company and for
conducting an operational analysis of the company (Henderson, Mallett and McCann 2016).
Discussion
Development Funding
The Charter Hall Property Trust Group has a dynamic nature of the business under which the real
estate property sector it operates as the funding requirement for the Group varies according to the
property portfolio and the structure of the property it undertakes (Malhotra and Malhotra 2018).
The group aims at maintaining the flexible line of credit for the different kind of investment
requirement by maintaining the committed line of credit for the Group. In the current financial
year 2018, the group will be completing with the several key initiatives for the restructuring of
its debt-funding platform (Reddy and Wong 2016). The group current debt structure has been
Paraphrase This Document
Need a fresh take? Get an instant paraphrase of this document with our AI Paraphraser
4INTERNATIONAL PROPERTY FINANCE
replaced and restructured with the $200 million credit top up facility available for the group and
an additional $20 million which will be used by the group company for the bank guarantees
which will have a maturity till the financial year 2023.
In May 2018, The Charter Hall Trust Property Group also issued the bond, which
amounted for an all total of U.S $ 175.0 million with a fixed coupon rate on the same with a
maturity rate of 10 years and the same was issued as US Private Placement debt (USPP).
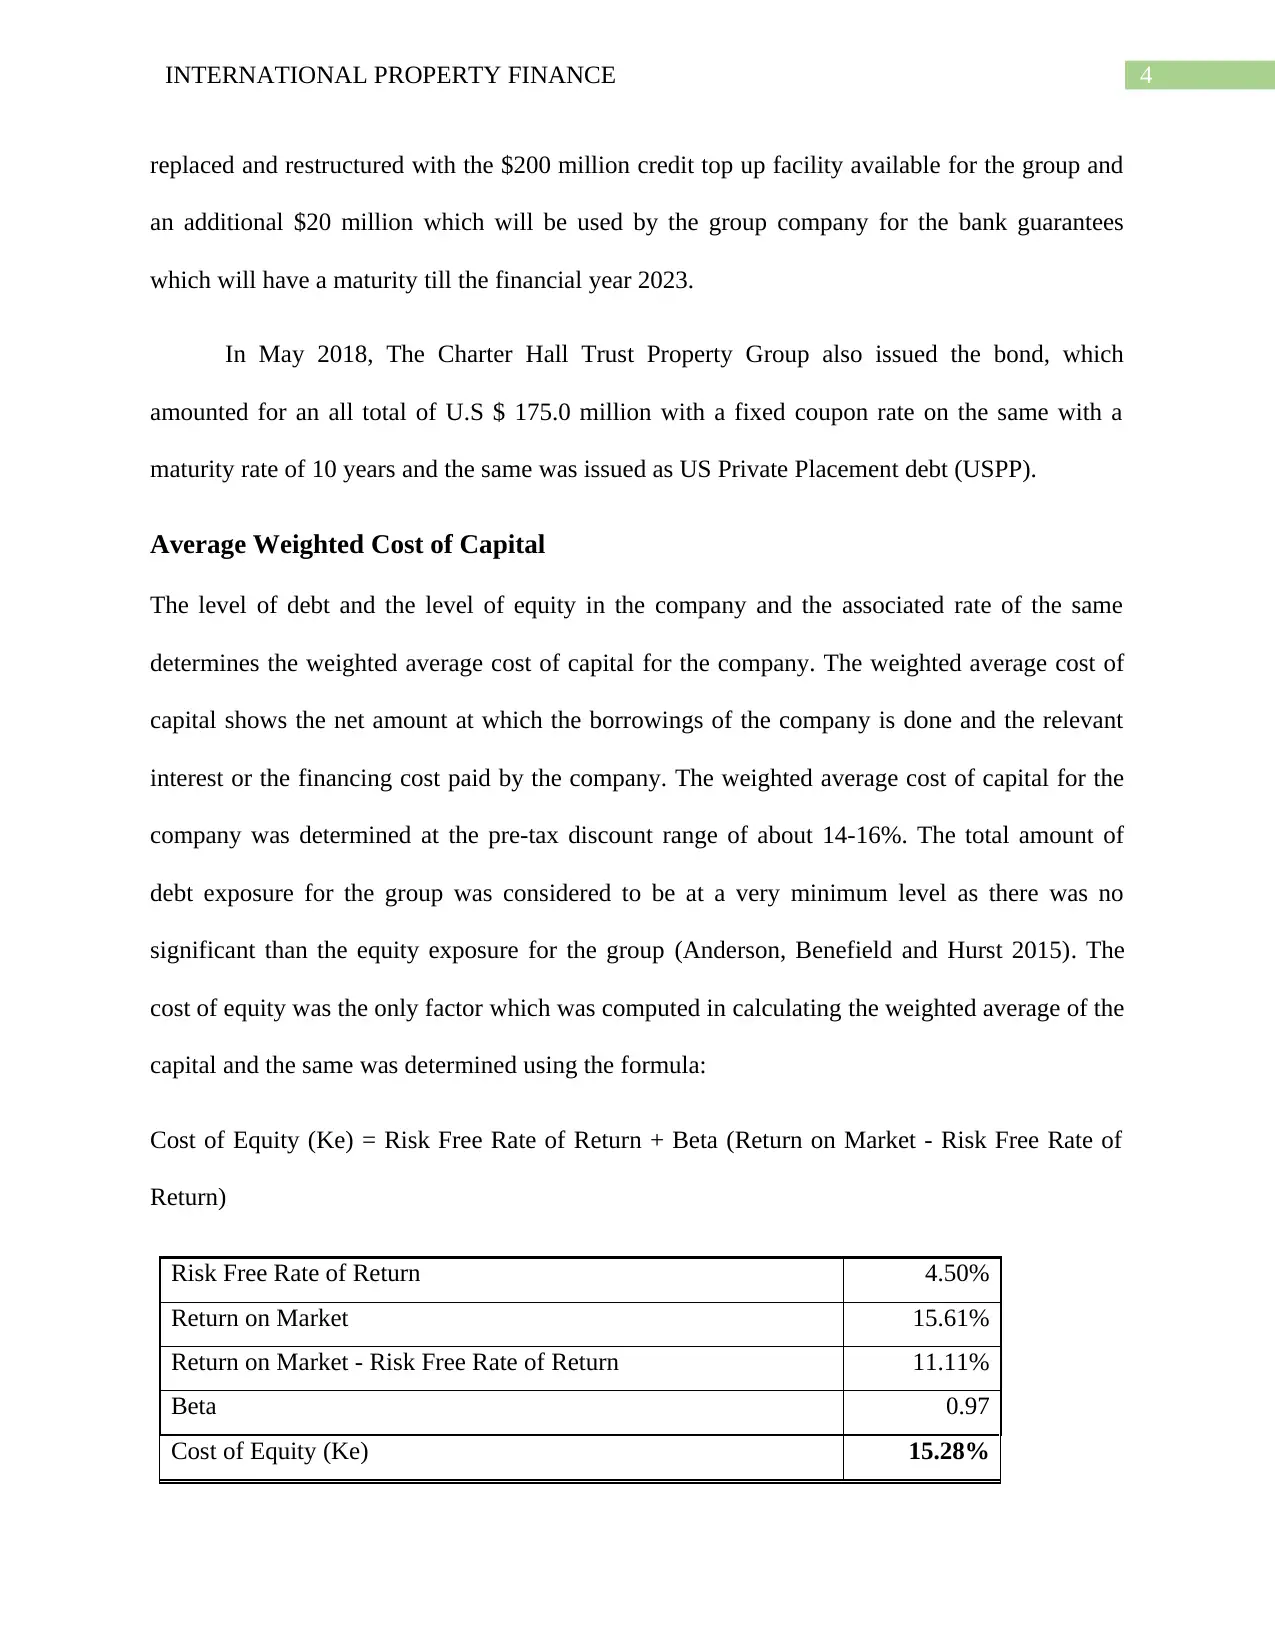
Average Weighted Cost of Capital
The level of debt and the level of equity in the company and the associated rate of the same
determines the weighted average cost of capital for the company. The weighted average cost of
capital shows the net amount at which the borrowings of the company is done and the relevant
interest or the financing cost paid by the company. The weighted average cost of capital for the
company was determined at the pre-tax discount range of about 14-16%. The total amount of
debt exposure for the group was considered to be at a very minimum level as there was no
significant than the equity exposure for the group (Anderson, Benefield and Hurst 2015). The
cost of equity was the only factor which was computed in calculating the weighted average of the
capital and the same was determined using the formula:
Cost of Equity (Ke) = Risk Free Rate of Return + Beta (Return on Market - Risk Free Rate of
Return)
Risk Free Rate of Return 4.50%
Return on Market 15.61%
Return on Market - Risk Free Rate of Return 11.11%
Βeta 0.97
Cost of Equity (Ke) 15.28%
replaced and restructured with the $200 million credit top up facility available for the group and
an additional $20 million which will be used by the group company for the bank guarantees
which will have a maturity till the financial year 2023.
In May 2018, The Charter Hall Trust Property Group also issued the bond, which
amounted for an all total of U.S $ 175.0 million with a fixed coupon rate on the same with a
maturity rate of 10 years and the same was issued as US Private Placement debt (USPP).
Average Weighted Cost of Capital
The level of debt and the level of equity in the company and the associated rate of the same
determines the weighted average cost of capital for the company. The weighted average cost of
capital shows the net amount at which the borrowings of the company is done and the relevant
interest or the financing cost paid by the company. The weighted average cost of capital for the
company was determined at the pre-tax discount range of about 14-16%. The total amount of
debt exposure for the group was considered to be at a very minimum level as there was no
significant than the equity exposure for the group (Anderson, Benefield and Hurst 2015). The
cost of equity was the only factor which was computed in calculating the weighted average of the
capital and the same was determined using the formula:
Cost of Equity (Ke) = Risk Free Rate of Return + Beta (Return on Market - Risk Free Rate of
Return)
Risk Free Rate of Return 4.50%
Return on Market 15.61%
Return on Market - Risk Free Rate of Return 11.11%
Βeta 0.97
Cost of Equity (Ke) 15.28%
5INTERNATIONAL PROPERTY FINANCE
Internal Rate of Return (IRR)/Annualized Total Returns;
The internal rate of return or the total annualize return for the company shows the net amount
earned by the company from the various kind of investment done by the company based on the
operating and the investment activity. The internal rate of return is quite beneficial measurement
ratio for the company in order to determine the financial success of the company
(INVESTSMART 2018). The Capitalization rate is the total return represented as the total
calculated income earned from the investment done and the same expressed as a percentage of
the total income earned. The capitalization rate considered for the year 2018 was around 6-7.8%
and was 6.8-8.5% for the year 2017 (Wiley 2014).
Management Burden
The burden of the management is primarily seen in the core operation area of the company that is
management of the portfolio of basket of real estate for the company. Generation of a sustainable
set of return for the stakeholders of the company in the long-term horizon period is the key focus
for the management of the company. Environmental Concerns, Social Concerns and the Business
Operations of the company with respect to the management of the retail and commercial property
management are some of the key issue addressed as the management burden for the company.
The company is not having any exposure to the financial risk or the debt financing as the
company operates in the real estate sector. It is already having a high amount of business risk as
the real estate is already cyclical in nature the additional debt financing can also increase the
financial risk for the company but at the same time can also provide a tax advantage for the
company (Olanrele et al. 2018).
⊘ This is a preview!⊘
Do you want full access?
Subscribe today to unlock all pages.
Trusted by 1+ million students worldwide
6INTERNATIONAL PROPERTY FINANCE
Net Tangible Assets
The net tangible assets of the company is calculated for the group by evaluating the total asset of
the company and deducting the intangible asset of the company such as goodwill and patents.
The key tangible asset of the company was identified as investment done by the company,
investment properties and the property plant and equipment, which formed up the important
constituent of the total tangible asset of the company. The total asset of the company was around
2013.6 million dollars for the year 2018 and the net intangible asset for the company for the
same year was observed to be around 62.7 million dollars constituting the net tangible asset for
the company to be around 1950.9 million dollars.
Unit Price
The unit price for the company was determined by the fair value of the investment property held
by the company divided by the total number of unit holder available. The group is exposed with
determining the unit price of the group with available investment property portfolio of the
company. The key determination in the unit price evaluation of the underlying properties of the
companies is approved and evaluated by the respective board or the investment committee of the
group (Charter Hall 2017).
Tax Exposure
The effective tax rate for the company was determined using the income tax expenses paid by the
group company on the total profit earned by the company. The income tax expense for the
company in the year 2017 and 2018 was around 23.6 and 26.5 million dollars. The effective tax
rate for the company was around 9.5% and 8.5% for the year 2018 and 2017 respectively. The
deferred tax liabilities and asset for the company was calculated and recognized based in the
temporary differences in the tax rate (Suri 2017).
Paraphrase This Document
Need a fresh take? Get an instant paraphrase of this document with our AI Paraphraser
7INTERNATIONAL PROPERTY FINANCE
Gearing Ratio and Leverage
The gearing ratio for the company was not found as the debt exposure for the company was not
found The Company has a negligible amount of exposure towards the debt or the long-term
borrowings of the company. The current liabilities of the companies was only in the form of
trade payables and short-term borrowings of the company.
Cash Flow
The Cash flow for the company is primarily derived from the core business operation of the
company and from the investing activities of the company. The Cash flow from operating
activities of the company primarily constituted the receipts from the customers for the sale of
properties and interest received from investment in the form of dividends. The cash flow for the
Charter Hall Group was around 169.1 million and 156.3 for the year 2018 and 2017 respectively.
The company’s primary investing activities was primarily based on the investment in associates
and joint ventures and investment in properties. The net cash outflow from investing activities
for the company was primarily seen in the year 2018 as $131.6 million and $257.6 million
respectively in the year 2017. The cash flow from financing activities of the company primarily
constituted the proceeds from the borrowings, proceeds from issue of securities and repayment of
borrowings of the company (Mi, Benson and Faff 2016).
Market Capitalization
The market capitalization for the Charter Hall Group was around 3.30 billion dollars which
shows the market value of the company outstanding share which are publically traded in the
market. The share price for the company currently is around $7.12 where the company stocks has
been performing well in the last year and has given good set of return for the investors and the
stakeholders of the company.
8INTERNATIONAL PROPERTY FINANCE
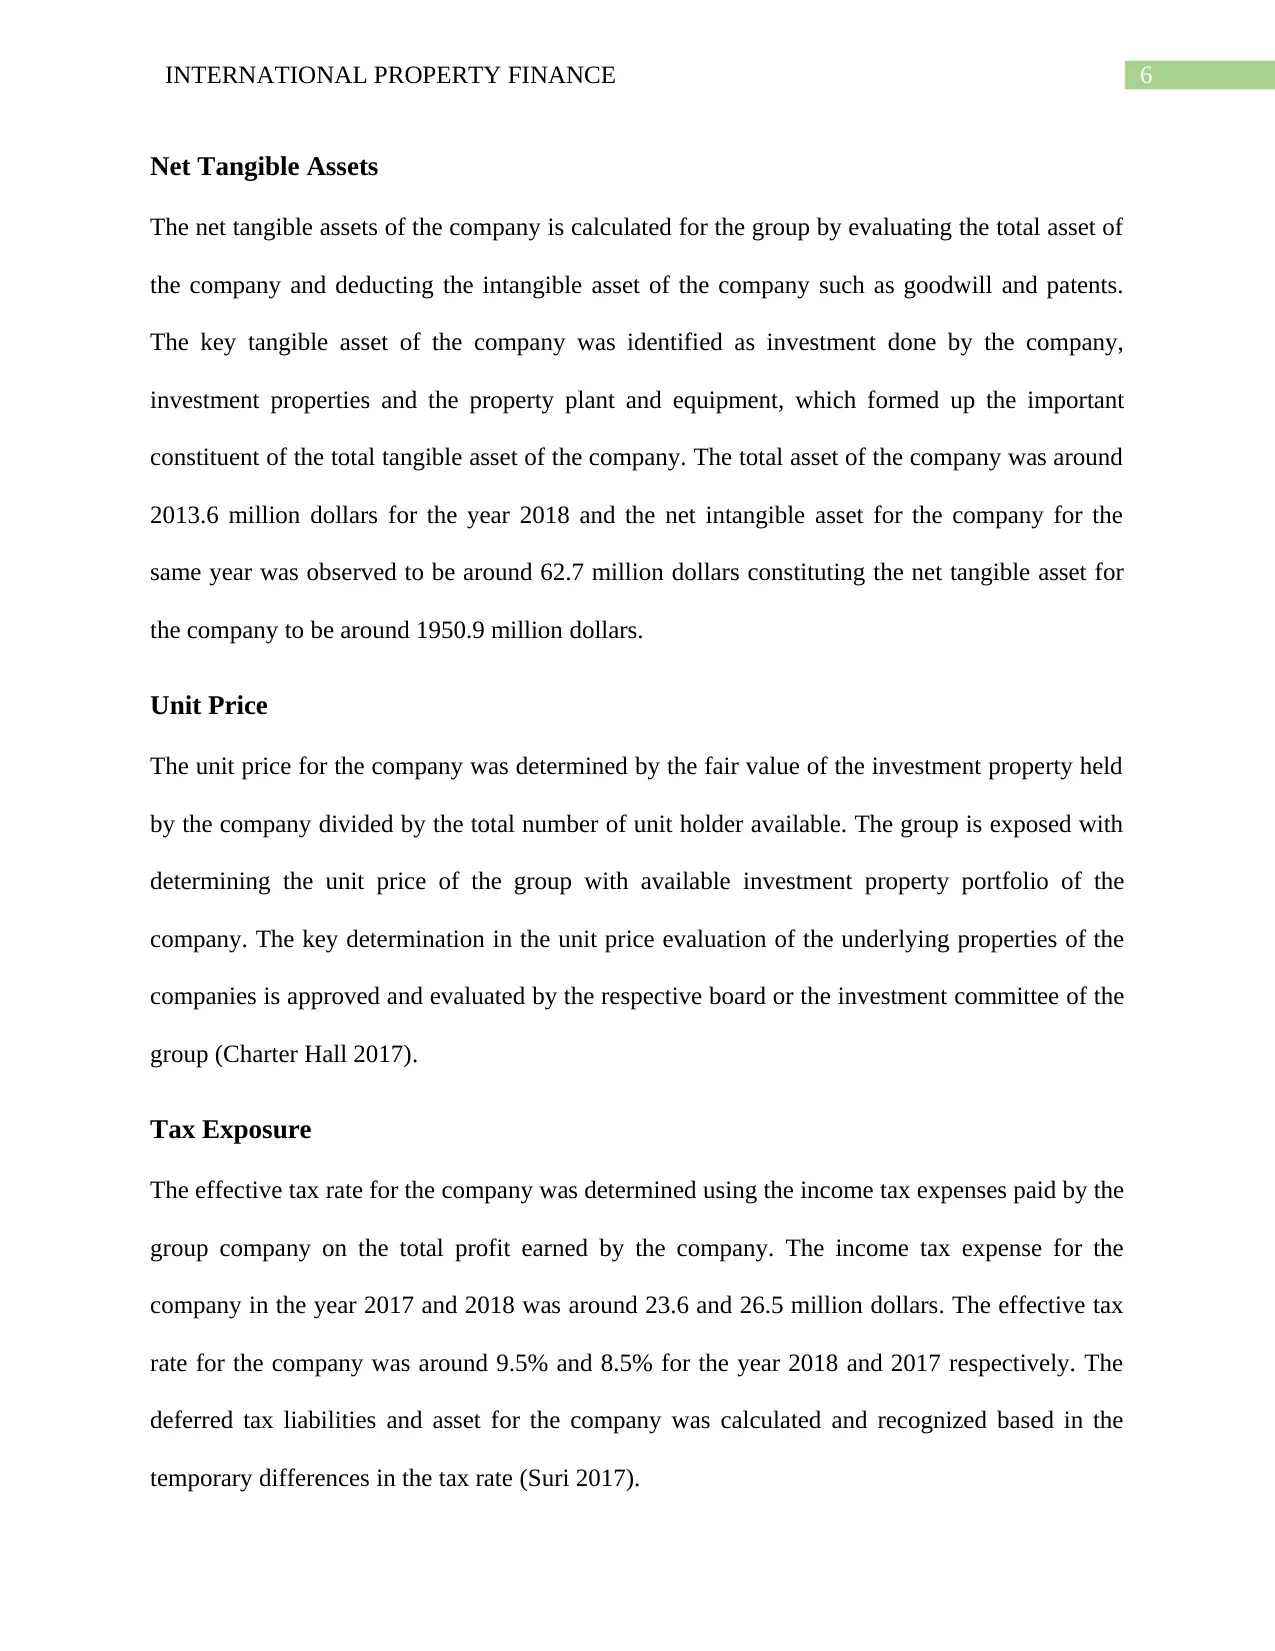
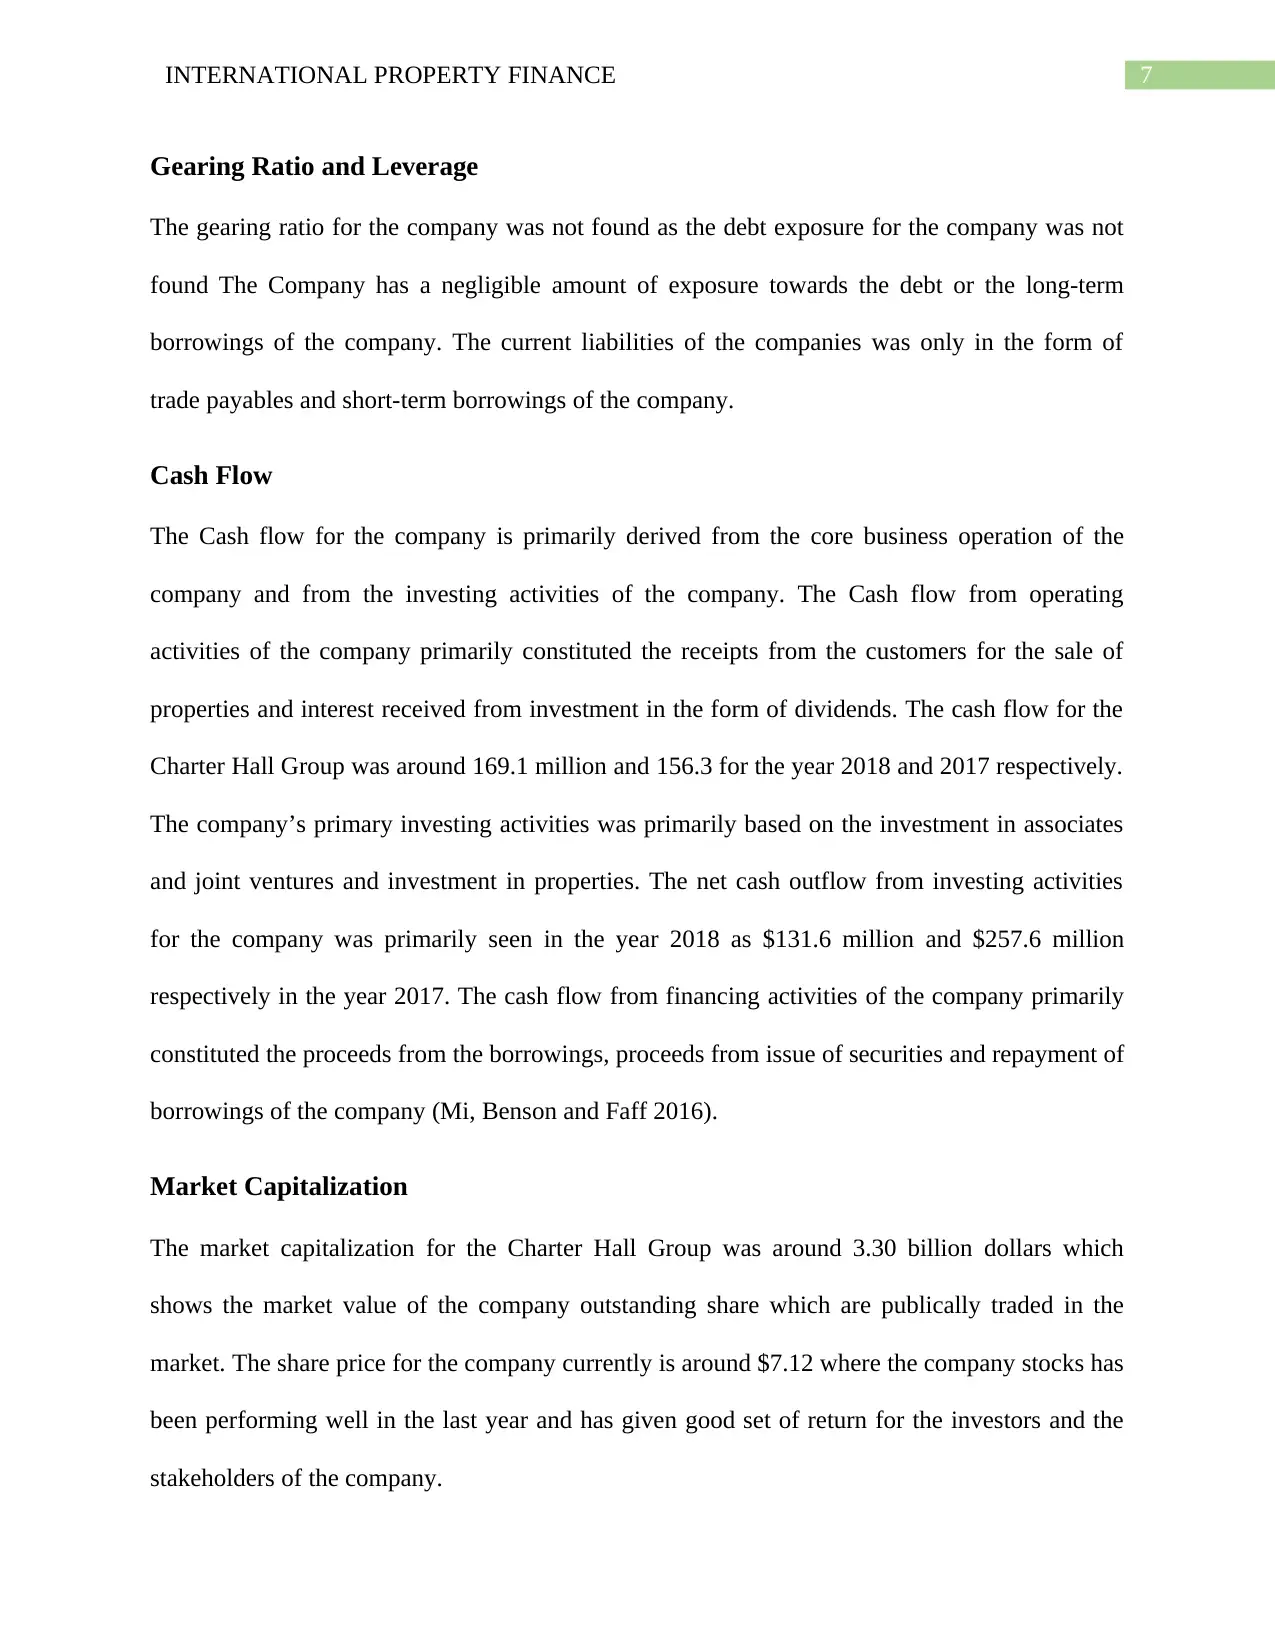
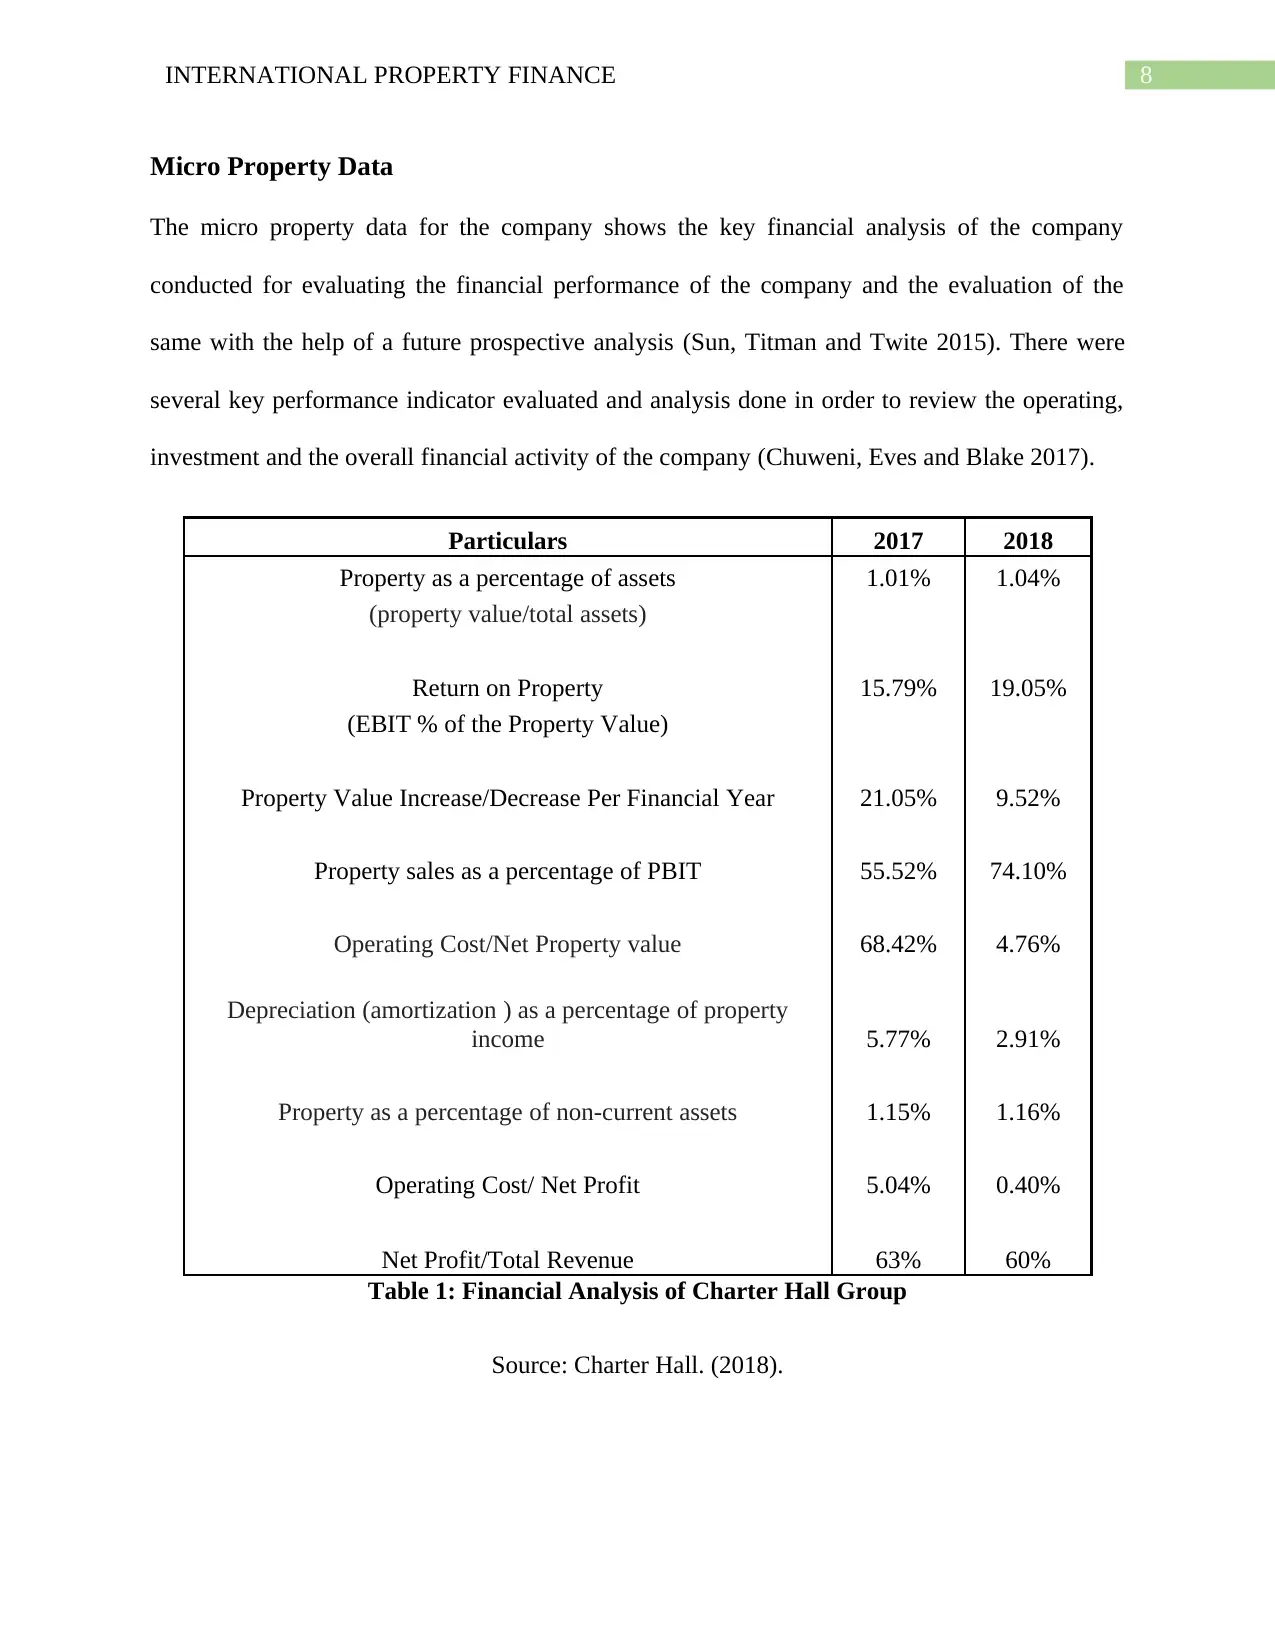
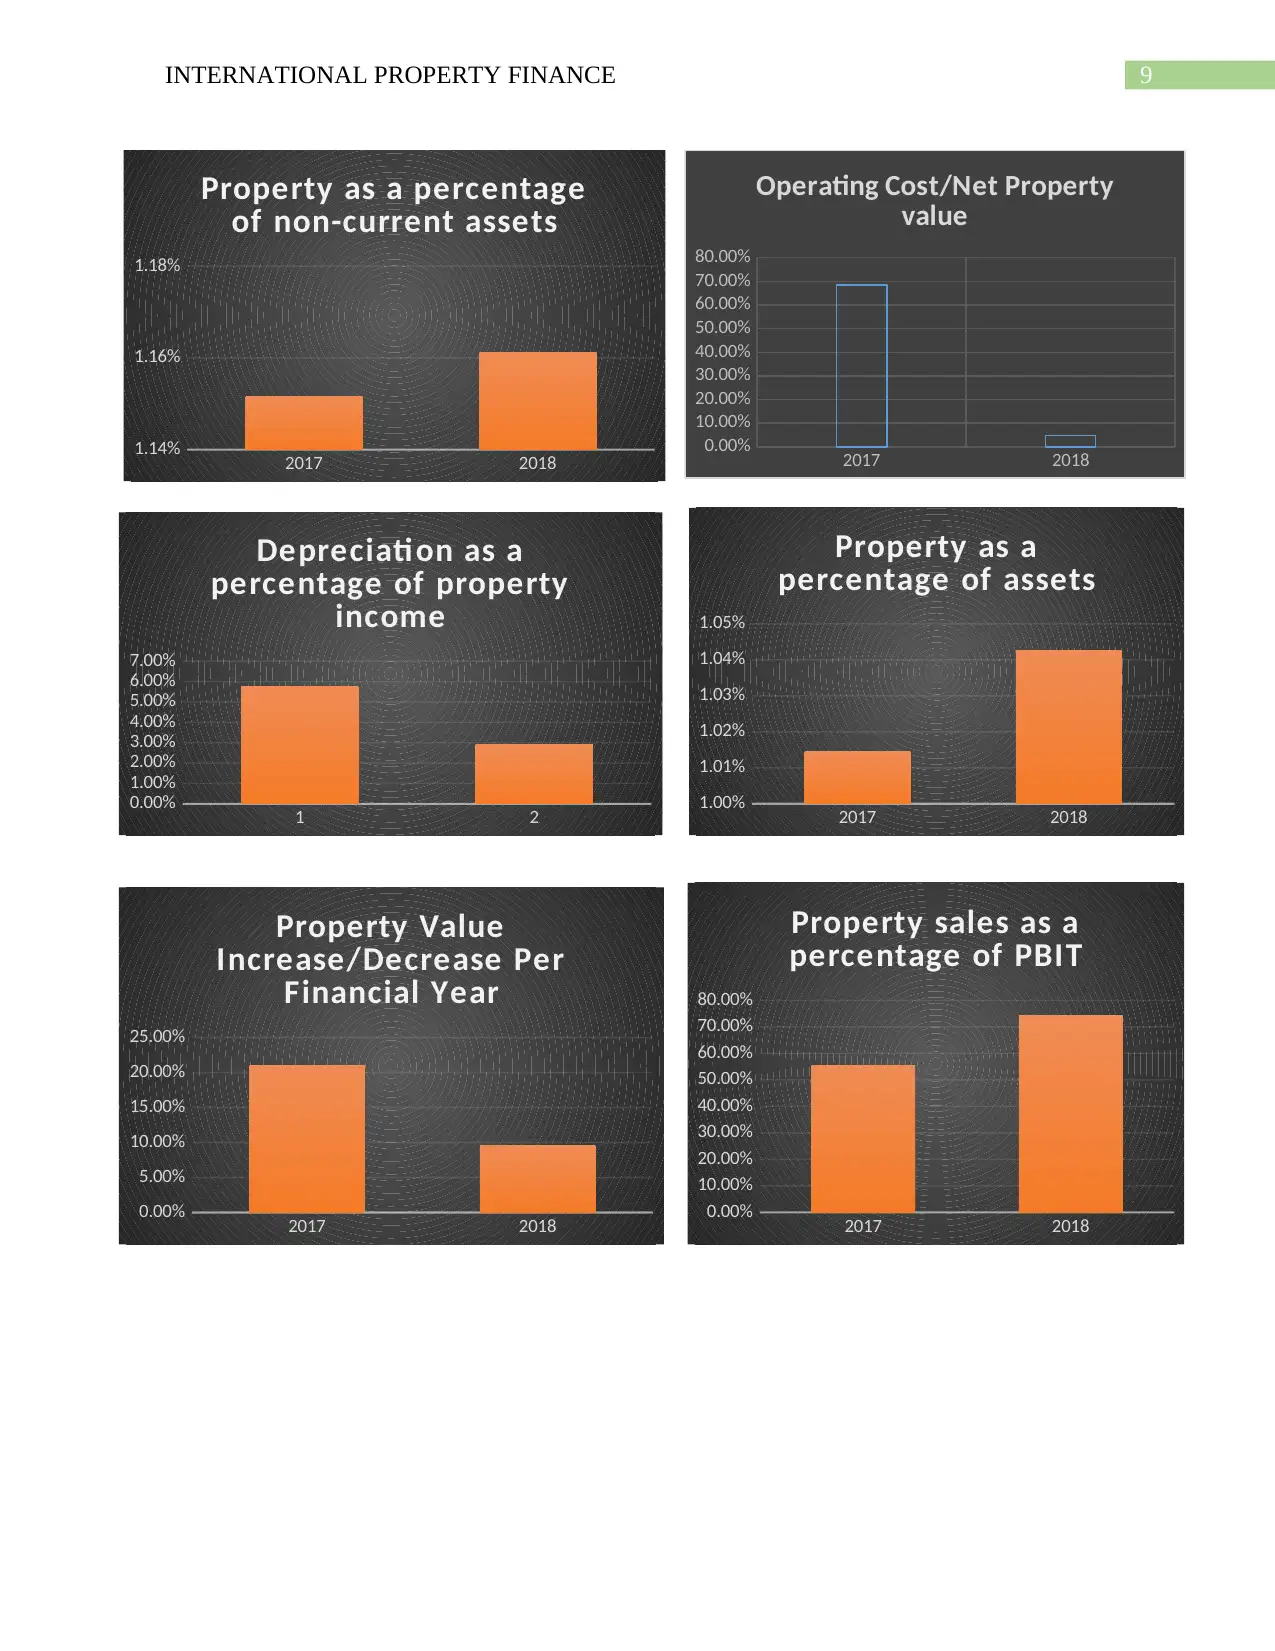
Micro Property Data
The micro property data for the company shows the key financial analysis of the company
conducted for evaluating the financial performance of the company and the evaluation of the
same with the help of a future prospective analysis (Sun, Titman and Twite 2015). There were
several key performance indicator evaluated and analysis done in order to review the operating,
investment and the overall financial activity of the company (Chuweni, Eves and Blake 2017).
Particulars 2017 2018
Property as a percentage of assets 1.01% 1.04%
(property value/total assets)
Return on Property 15.79% 19.05%
(EBIT % of the Property Value)
Property Value Increase/Decrease Per Financial Year 21.05% 9.52%
Property sales as a percentage of PBIT 55.52% 74.10%
Operating Cost/Net Property value 68.42% 4.76%
Depreciation (amortization ) as a percentage of property
income 5.77% 2.91%
Property as a percentage of non-current assets 1.15% 1.16%
Operating Cost/ Net Profit 5.04% 0.40%
Net Profit/Total Revenue 63% 60%
Table 1: Financial Analysis of Charter Hall Group
Source: Charter Hall. (2018).
⊘ This is a preview!⊘
Do you want full access?
Subscribe today to unlock all pages.
Trusted by 1+ million students worldwide
9INTERNATIONAL PROPERTY FINANCE
2017 2018
1.14%
1.16%
1.18%
Property as a percentage
of non-current assets
2017 2018
0.00%
10.00%
20.00%
30.00%
40.00%
50.00%
60.00%
70.00%
80.00%
Operating Cost/Net Property
value
1 2
0.00%
1.00%
2.00%
3.00%
4.00%
5.00%
6.00%
7.00%
Depreciati on as a
percentage of property
income
2017 2018
1.00%
1.01%
1.02%
1.03%
1.04%
1.05%
Property as a
percentage of assets
2017 2018
0.00%
5.00%
10.00%
15.00%
20.00%
25.00%
Property Value
Increase/Decrease Per
Financial Year
2017 2018
0.00%
10.00%
20.00%
30.00%
40.00%
50.00%
60.00%
70.00%
80.00%
Property sales as a
percentage of PBIT
2017 2018
1.14%
1.16%
1.18%
Property as a percentage
of non-current assets
2017 2018
0.00%
10.00%
20.00%
30.00%
40.00%
50.00%
60.00%
70.00%
80.00%
Operating Cost/Net Property
value
1 2
0.00%
1.00%
2.00%
3.00%
4.00%
5.00%
6.00%
7.00%
Depreciati on as a
percentage of property
income
2017 2018
1.00%
1.01%
1.02%
1.03%
1.04%
1.05%
Property as a
percentage of assets
2017 2018
0.00%
5.00%
10.00%
15.00%
20.00%
25.00%
Property Value
Increase/Decrease Per
Financial Year
2017 2018
0.00%
10.00%
20.00%
30.00%
40.00%
50.00%
60.00%
70.00%
80.00%
Property sales as a
percentage of PBIT
Paraphrase This Document
Need a fresh take? Get an instant paraphrase of this document with our AI Paraphraser
10INTERNATIONAL PROPERTY FINANCE
Conclusion
The key analysis of the Group was performed after assessing the financial report of the company
and after evaluation of the financial report of the company. The key financial indicators and
percentages were evaluated using the financial statement of the company and the performance of
the company was evaluated in the last two year. There were several financial ratios and the key
performance indicator for the company were evaluated in order to determine the financial status
of the company and for conducting an operational analysis of the company.
11INTERNATIONAL PROPERTY FINANCE
Reference
Anderson, R.I., Benefield, J.D. and Hurst, M.E., 2015. Property-type diversification and REIT
performance: an analysis of operating performance and abnormal returns. Journal of Economics
and Finance, 39(1), pp.48-74.
Charter Hall. (2017). FS 2017 pg.62. New South Wales, Australia: Charter Hall.
Charter Hall. (2018). About Us. Retrieved 10 17, 2018, from https://www.charterhall.com.au:
https://www.charterhall.com.au/about/
Chuweni, N.N., Eves, C. and Blake, A., 2017. Optimising Malaysian Shariah-compliant Real
Estate Investment Trusts: Perspective of REIT managers. Pertanika Journals Social Sciences &
Humanities, 25(S), pp.89-100.
Henderson, B., Mallett, J. and McCann, C., 2016. An Empirical Analysis of Non-Traded
REITs. The Journal of Wealth Management, 19(1), p.83.
INVESTSMART. (2018). Company Financials. Retrieved 10 18, 2018, from
https://www.investsmart.com.au/shares: https://www.investsmart.com.au/shares/asx-bwp/bwp-
trust/financials
Malhotra, R. and Malhotra, D.K., 2018. An Empirical Analysis of the Performance of
Residential Real Estate Investment Funds. In Applications of Management Science (pp. 21-35).
Emerald Publishing Limited.
Mi, L., Benson, K. and Faff, R., 2016. Further evidence on idiosyncratic risk and REIT pricing: a
cross-country analysis. Accounting Research Journal, 29(1), pp.34-58.
⊘ This is a preview!⊘
Do you want full access?
Subscribe today to unlock all pages.
Trusted by 1+ million students worldwide
1 out of 13
Related Documents


Your All-in-One AI-Powered Toolkit for Academic Success.
+13062052269
info@desklib.com
Available 24*7 on WhatsApp / Email
![[object Object]](/_next/static/media/star-bottom.7253800d.svg)
Unlock your academic potential
Copyright © 2020–2026 A2Z Services. All Rights Reserved. Developed and managed by ZUCOL.