Property Investment and Risk Management Report: Investment Analysis
VerifiedAdded on 2022/10/12
|28
|3570
|106
Report
AI Summary
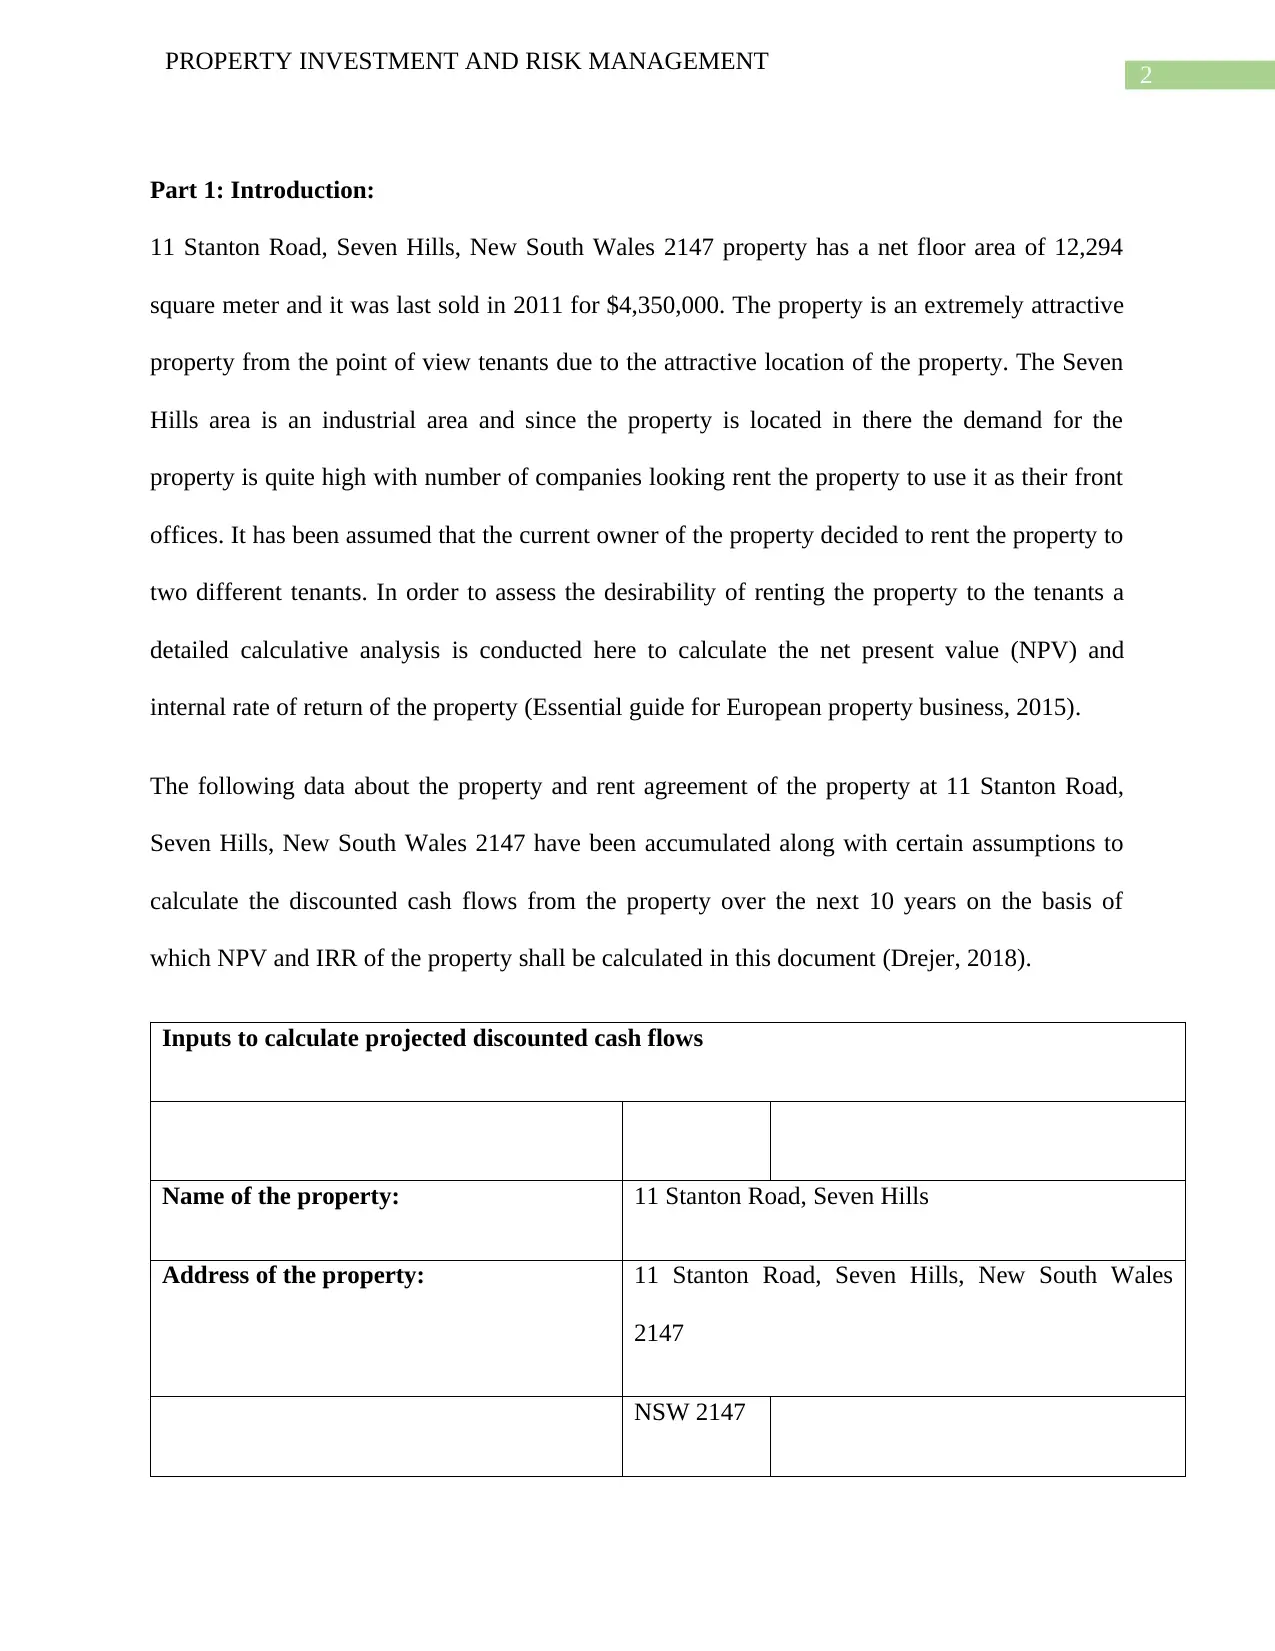
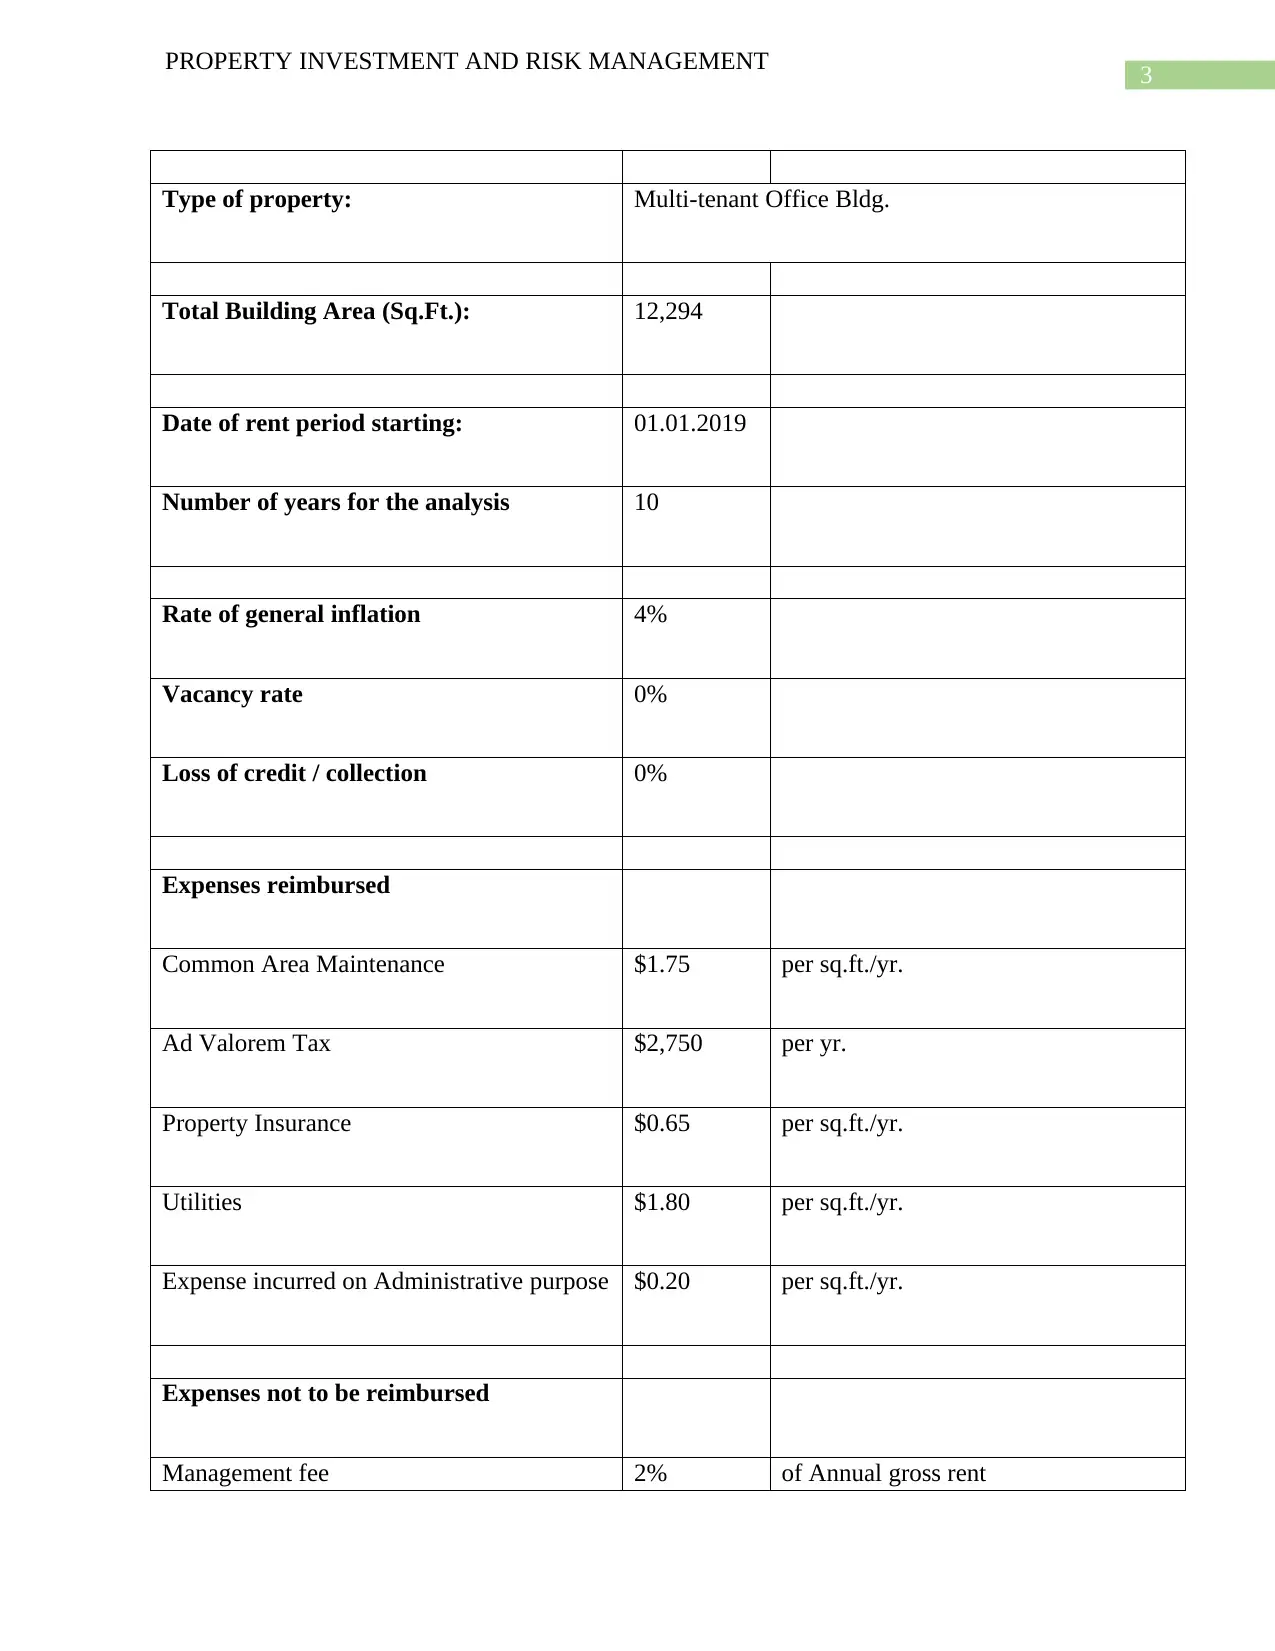
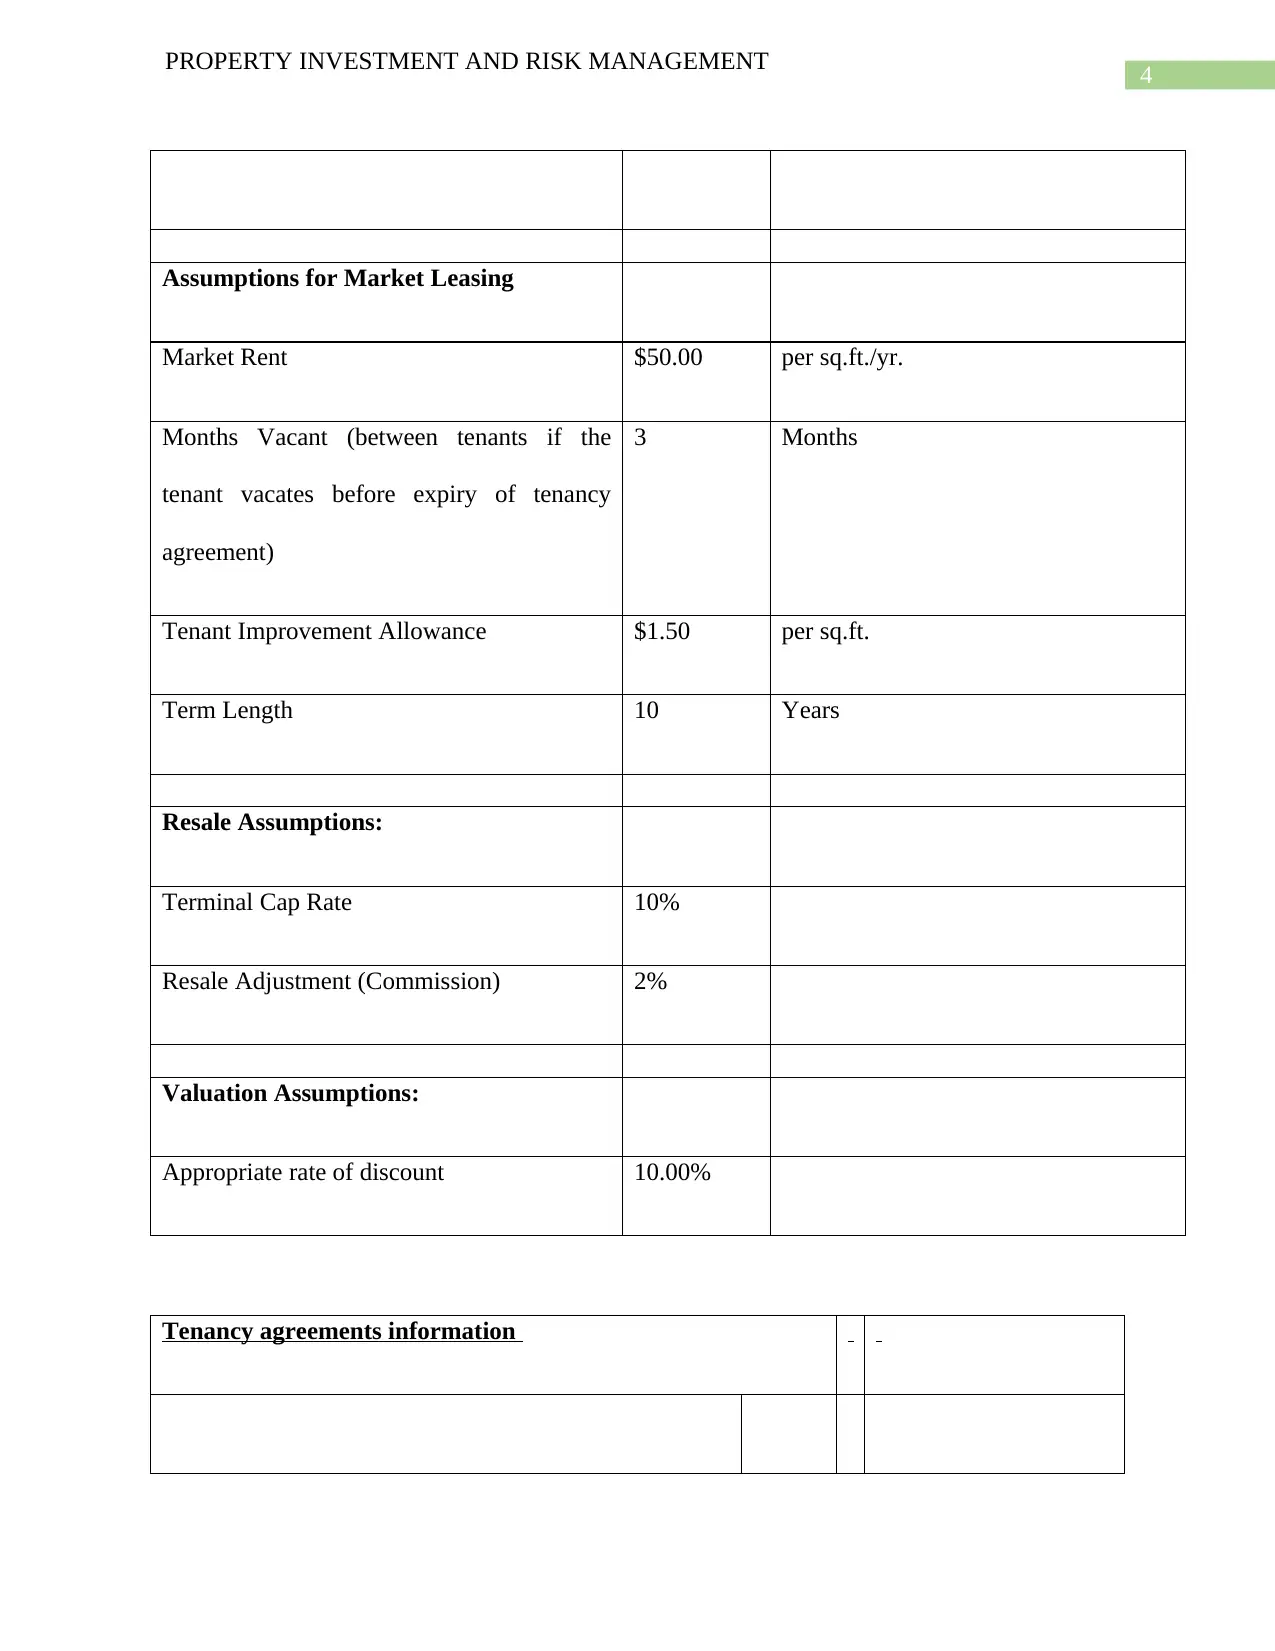
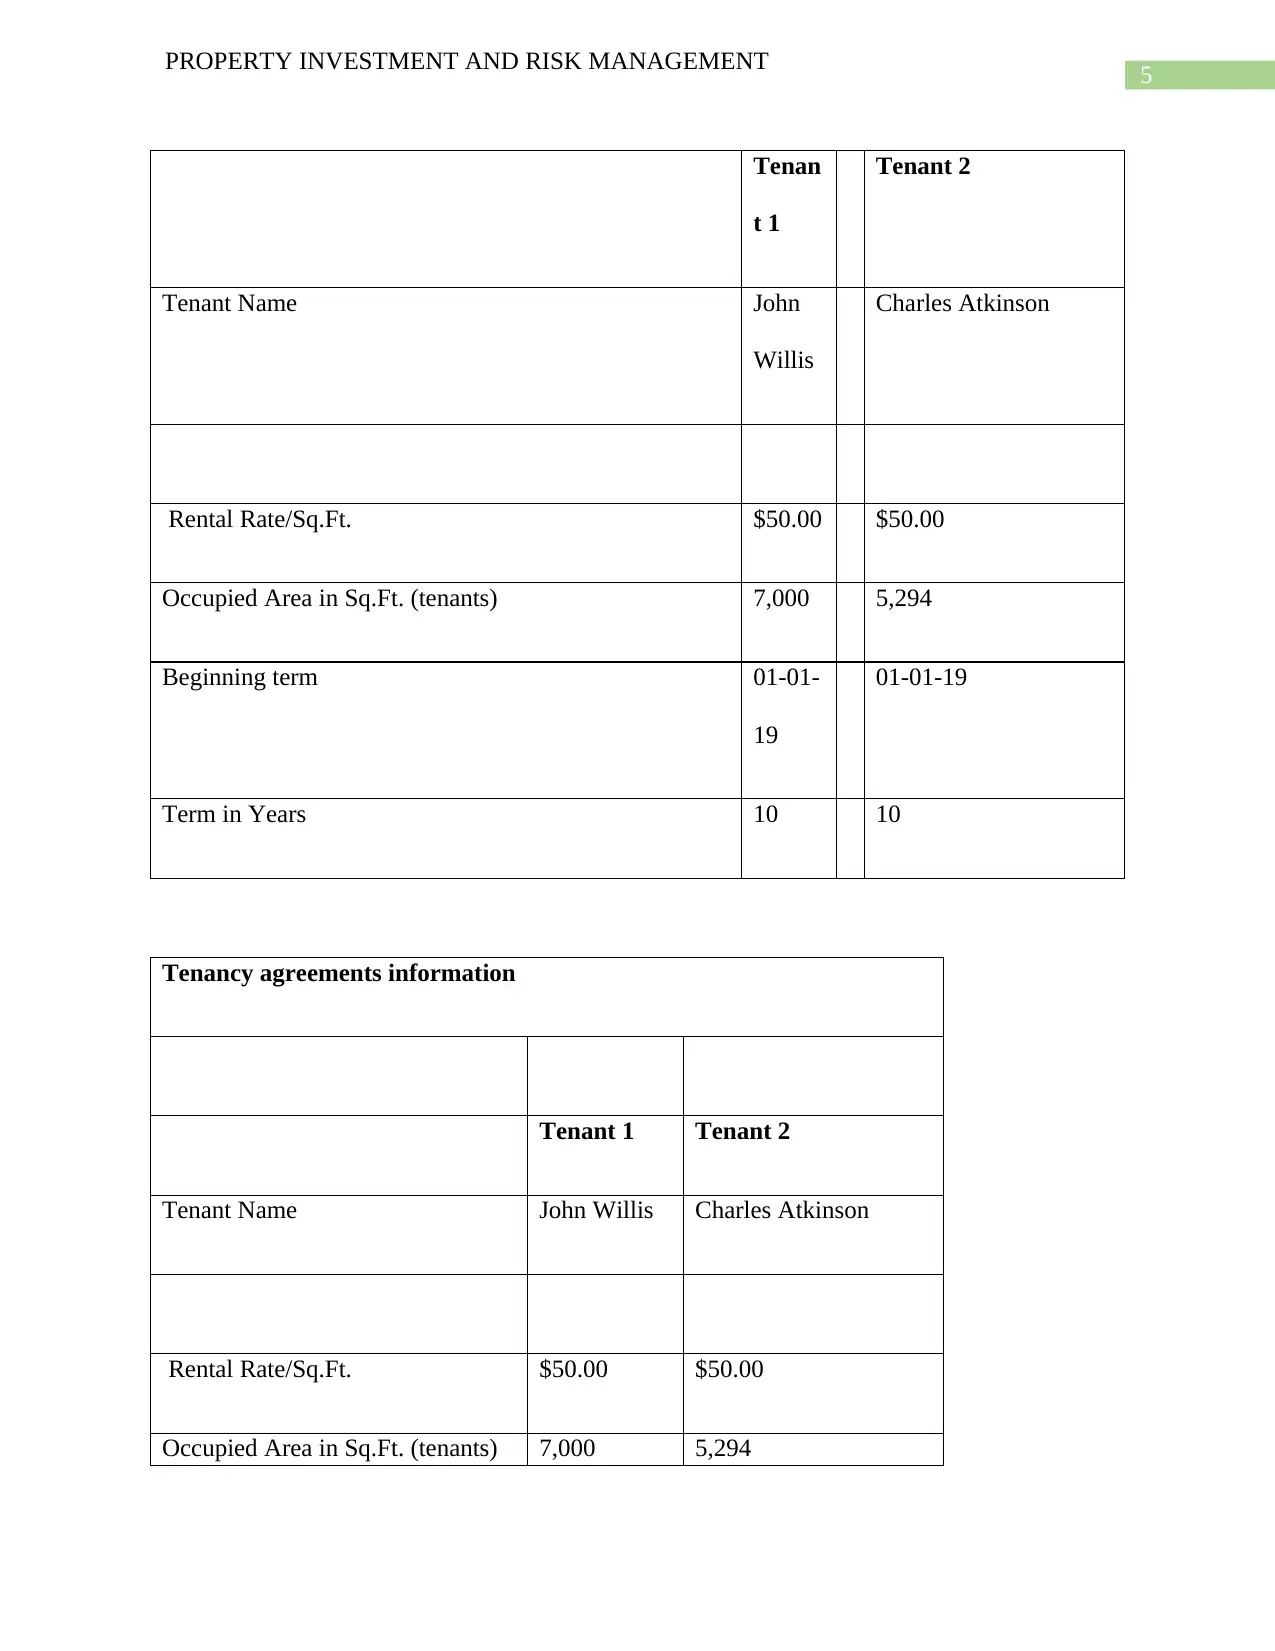
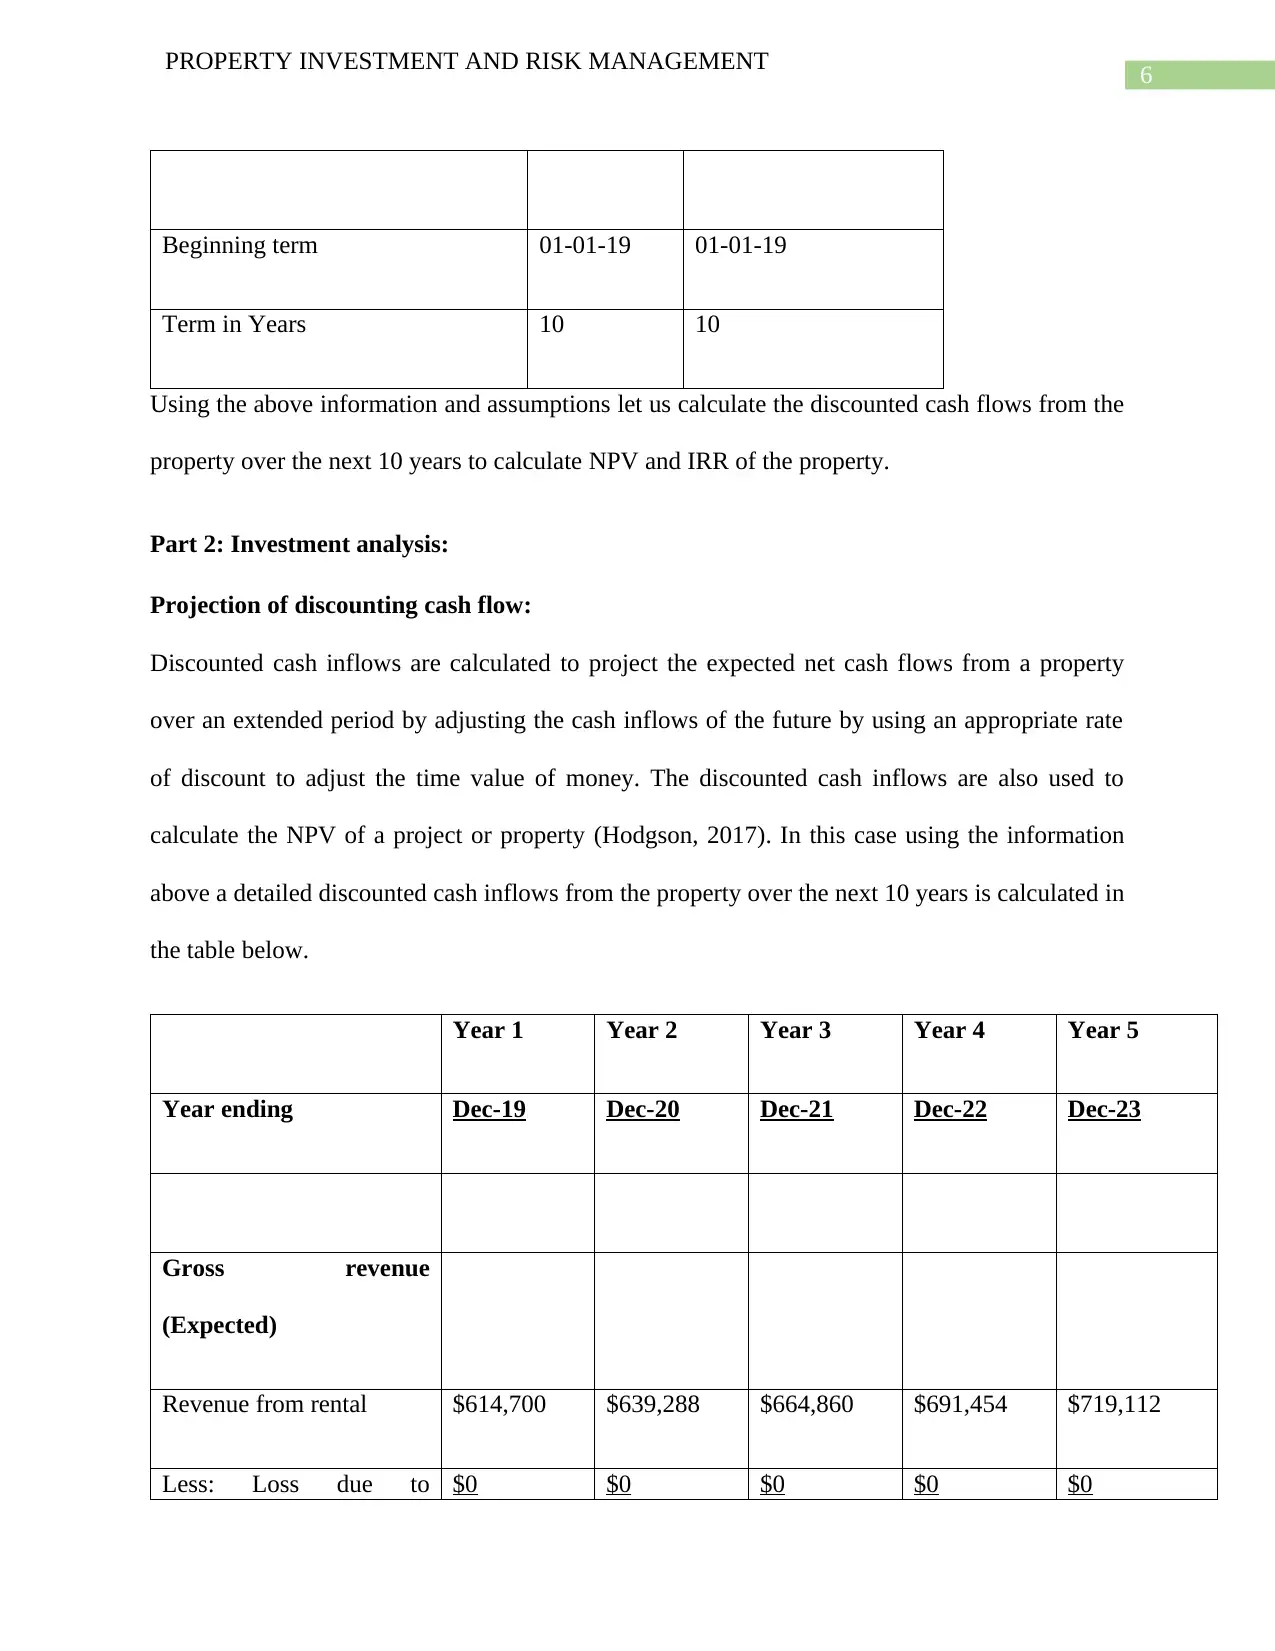
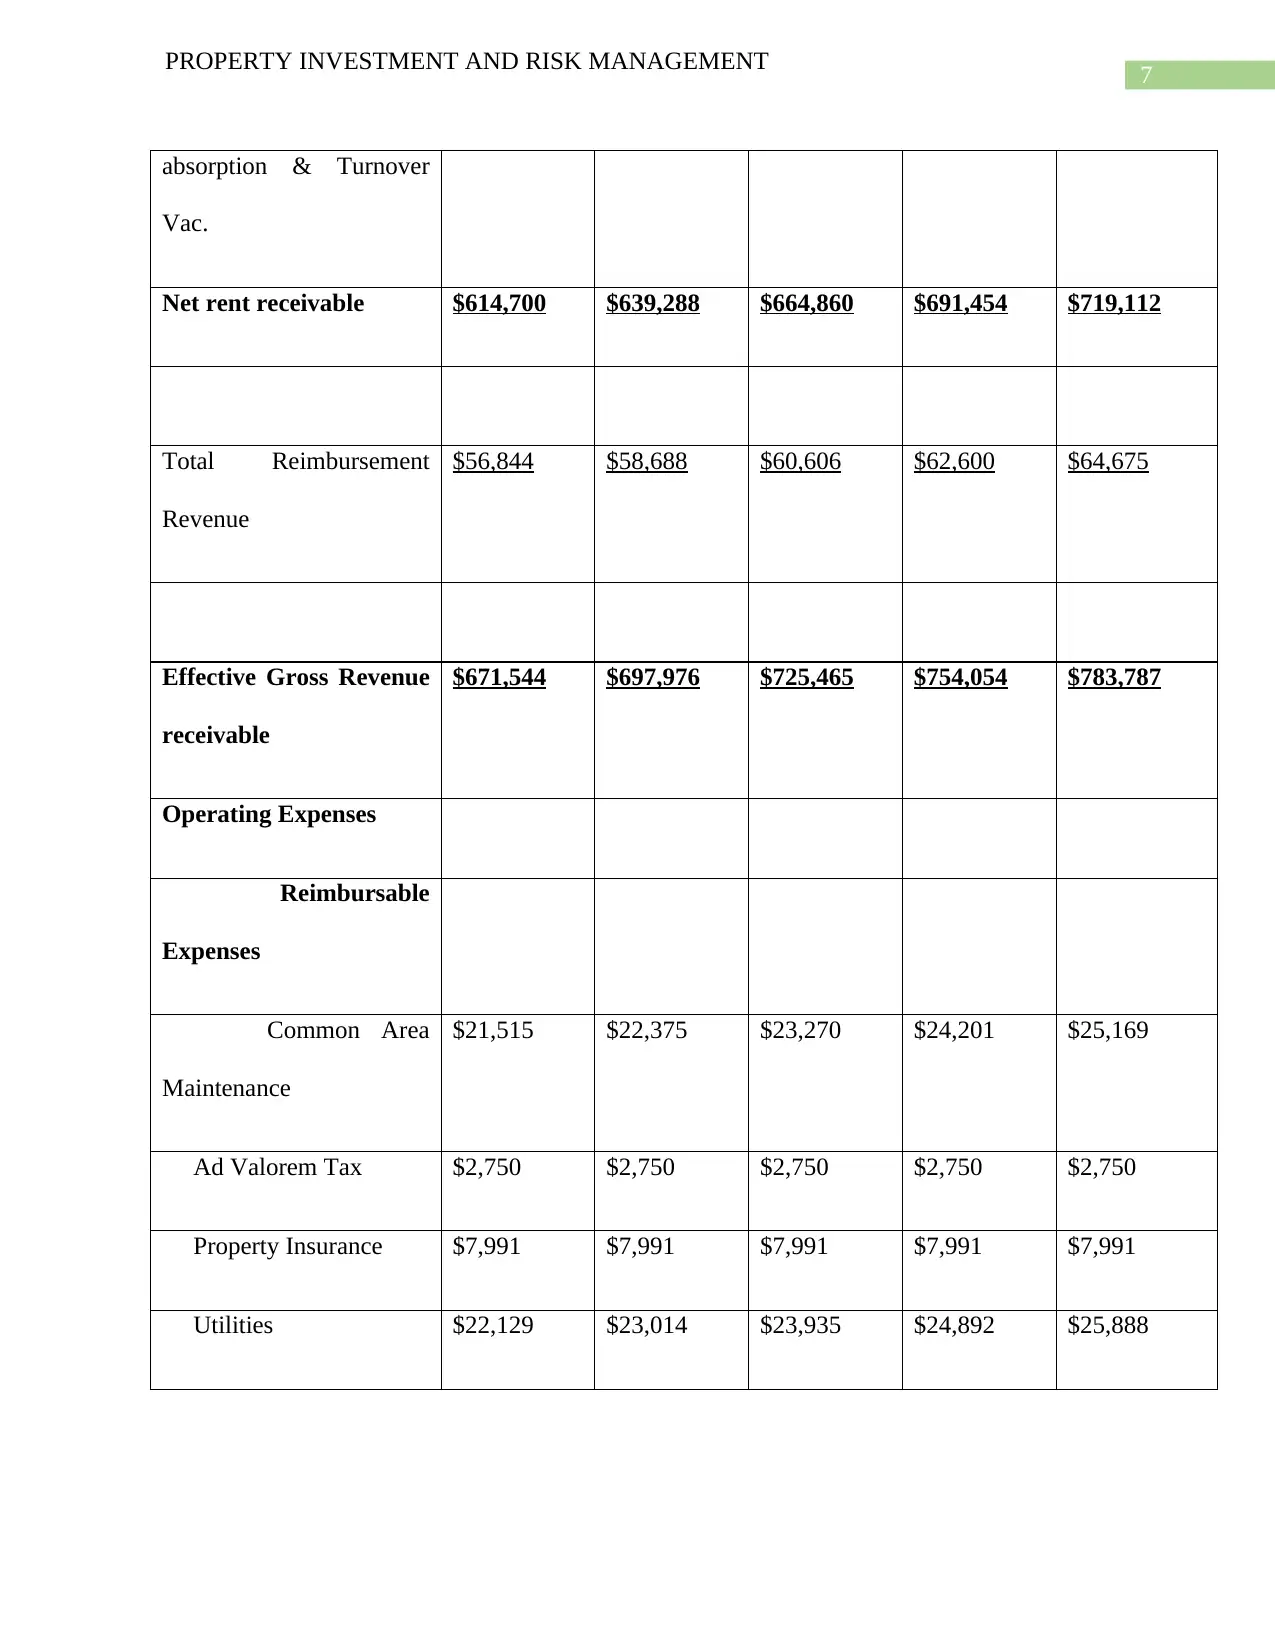
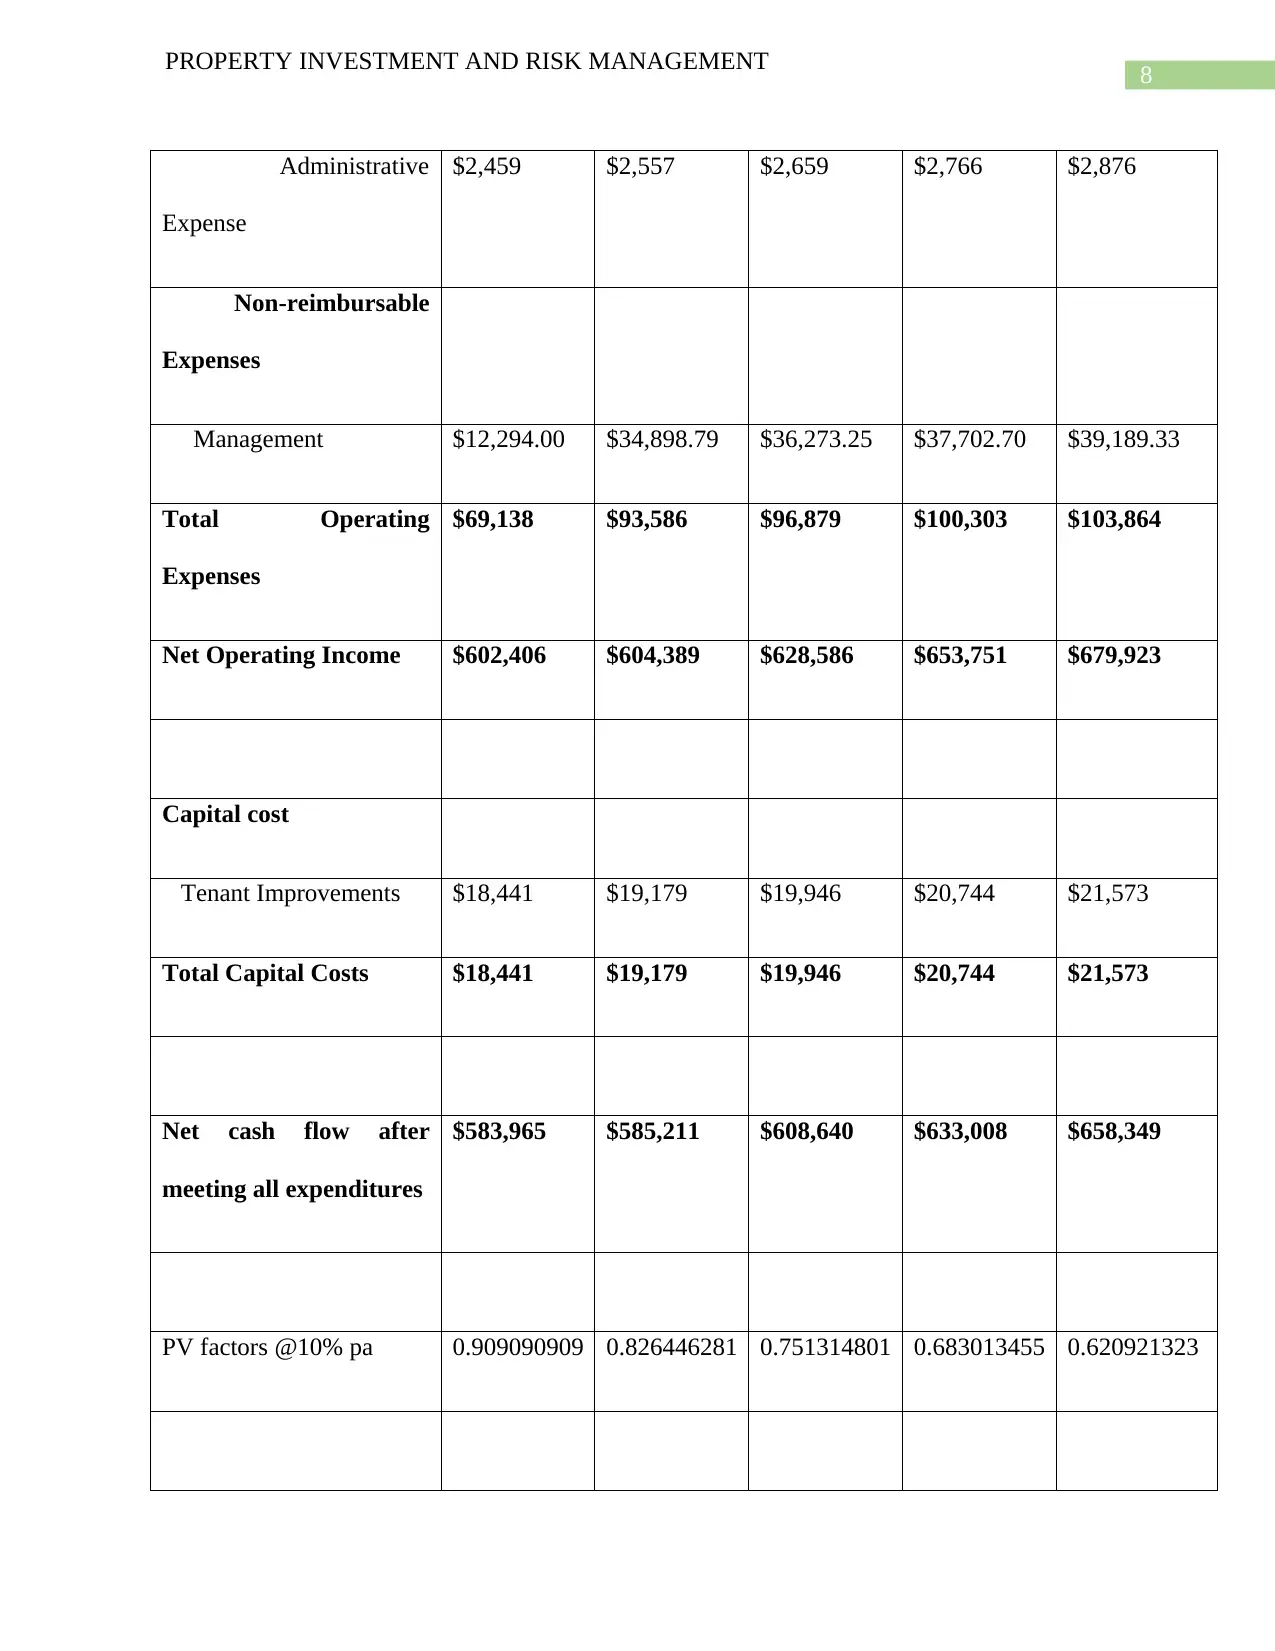
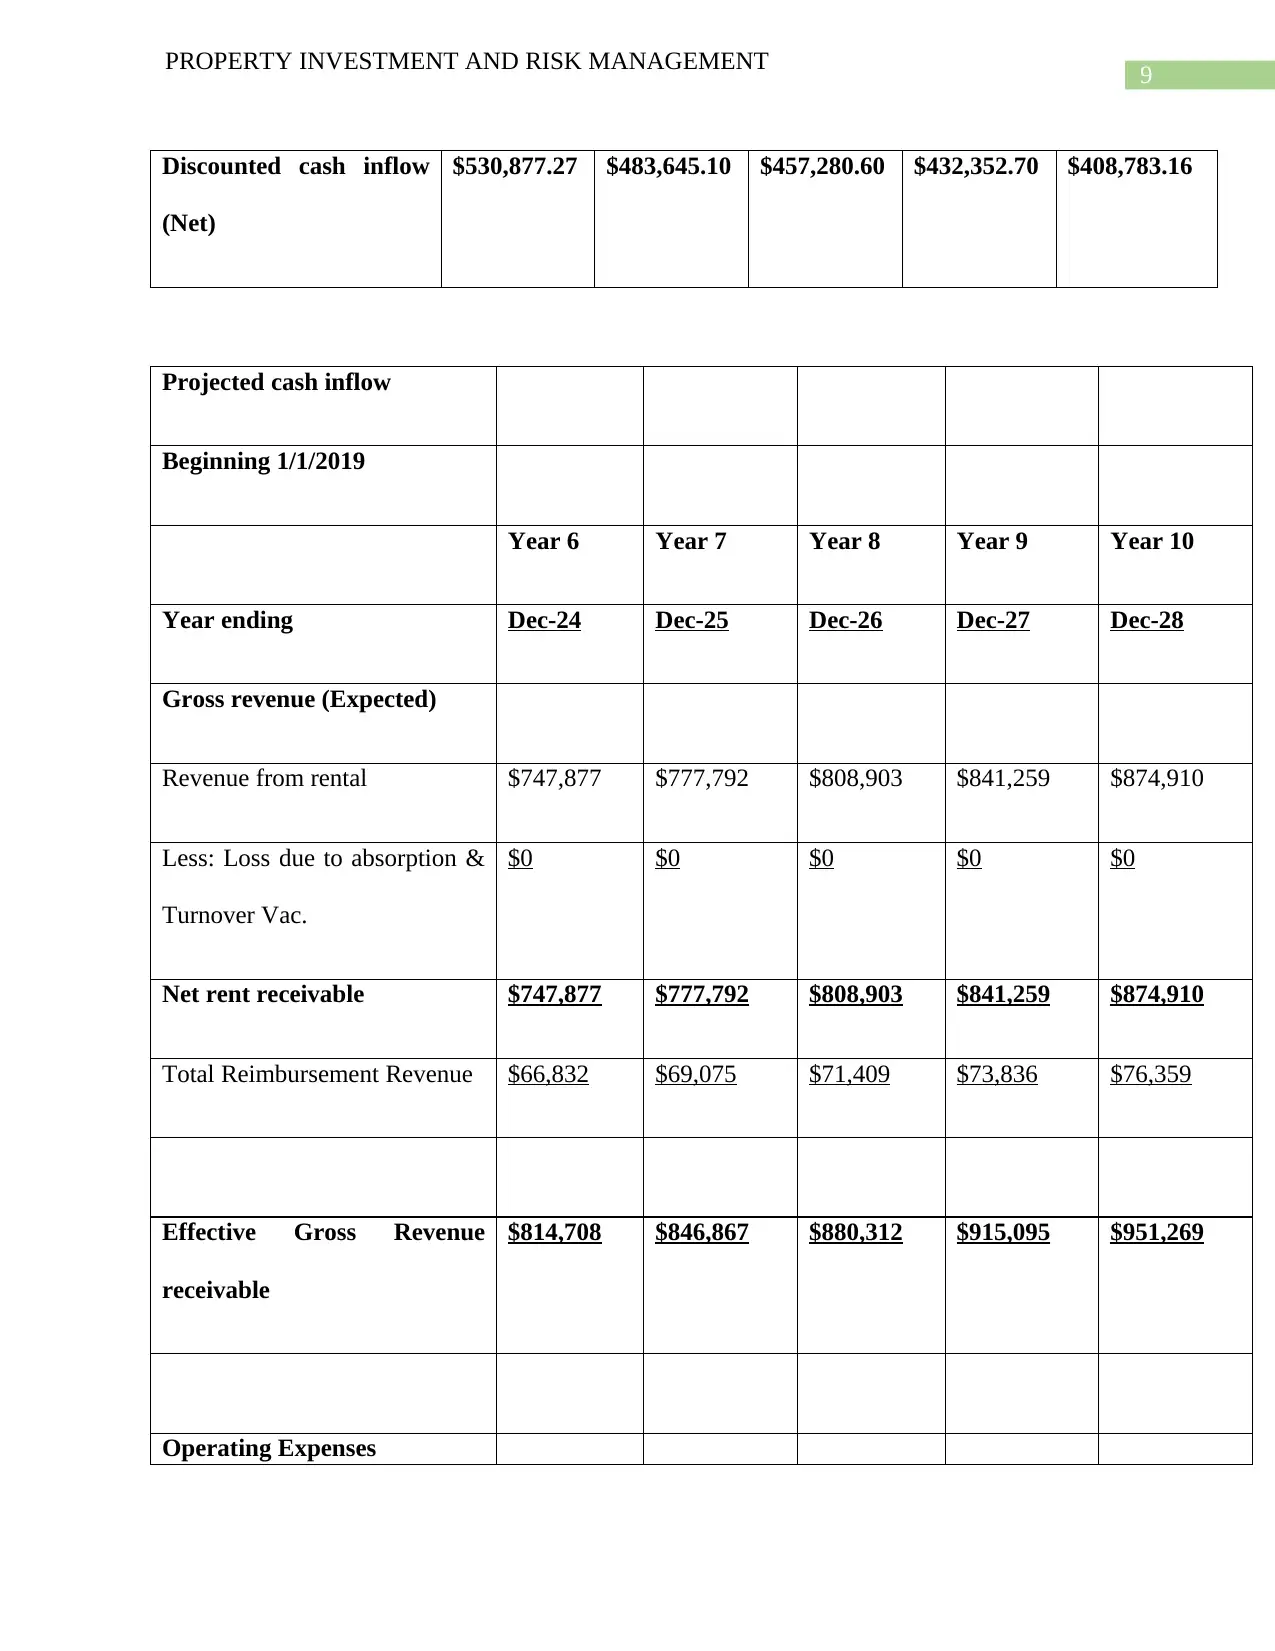
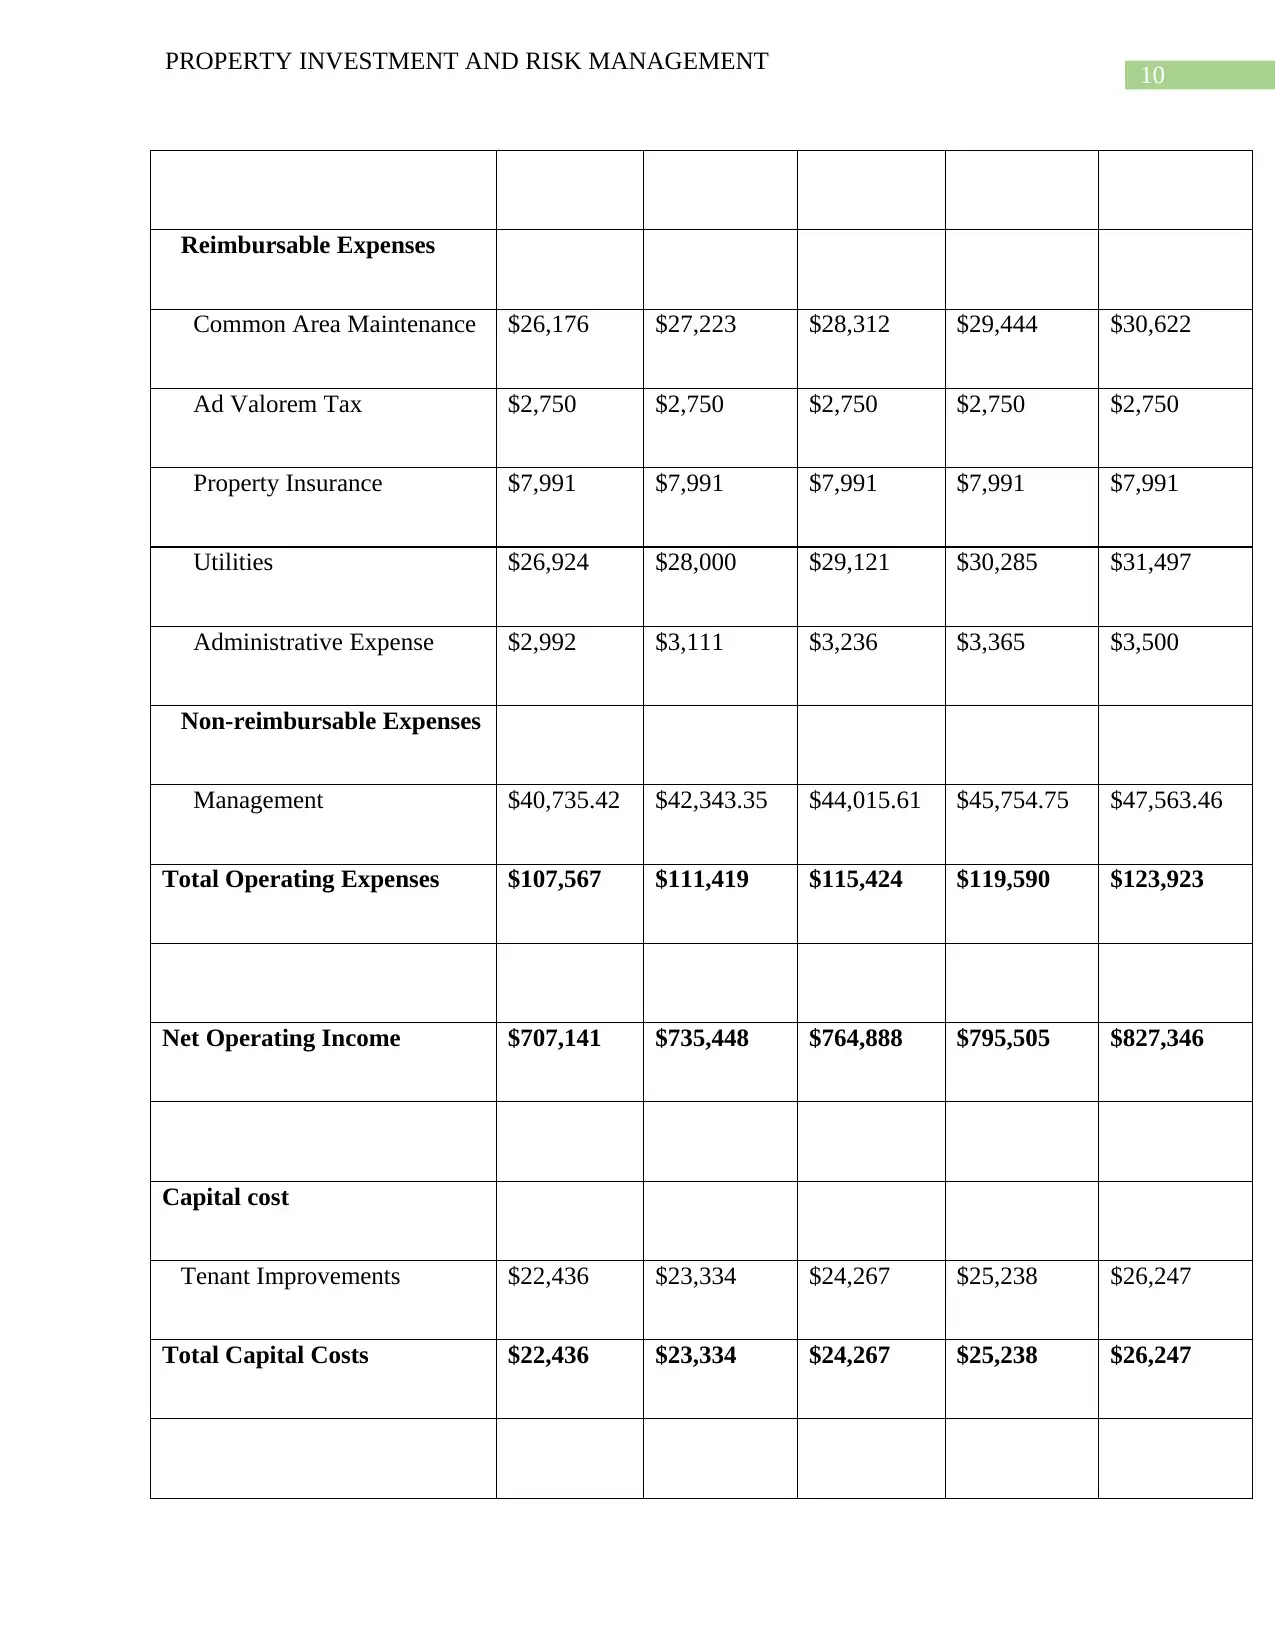
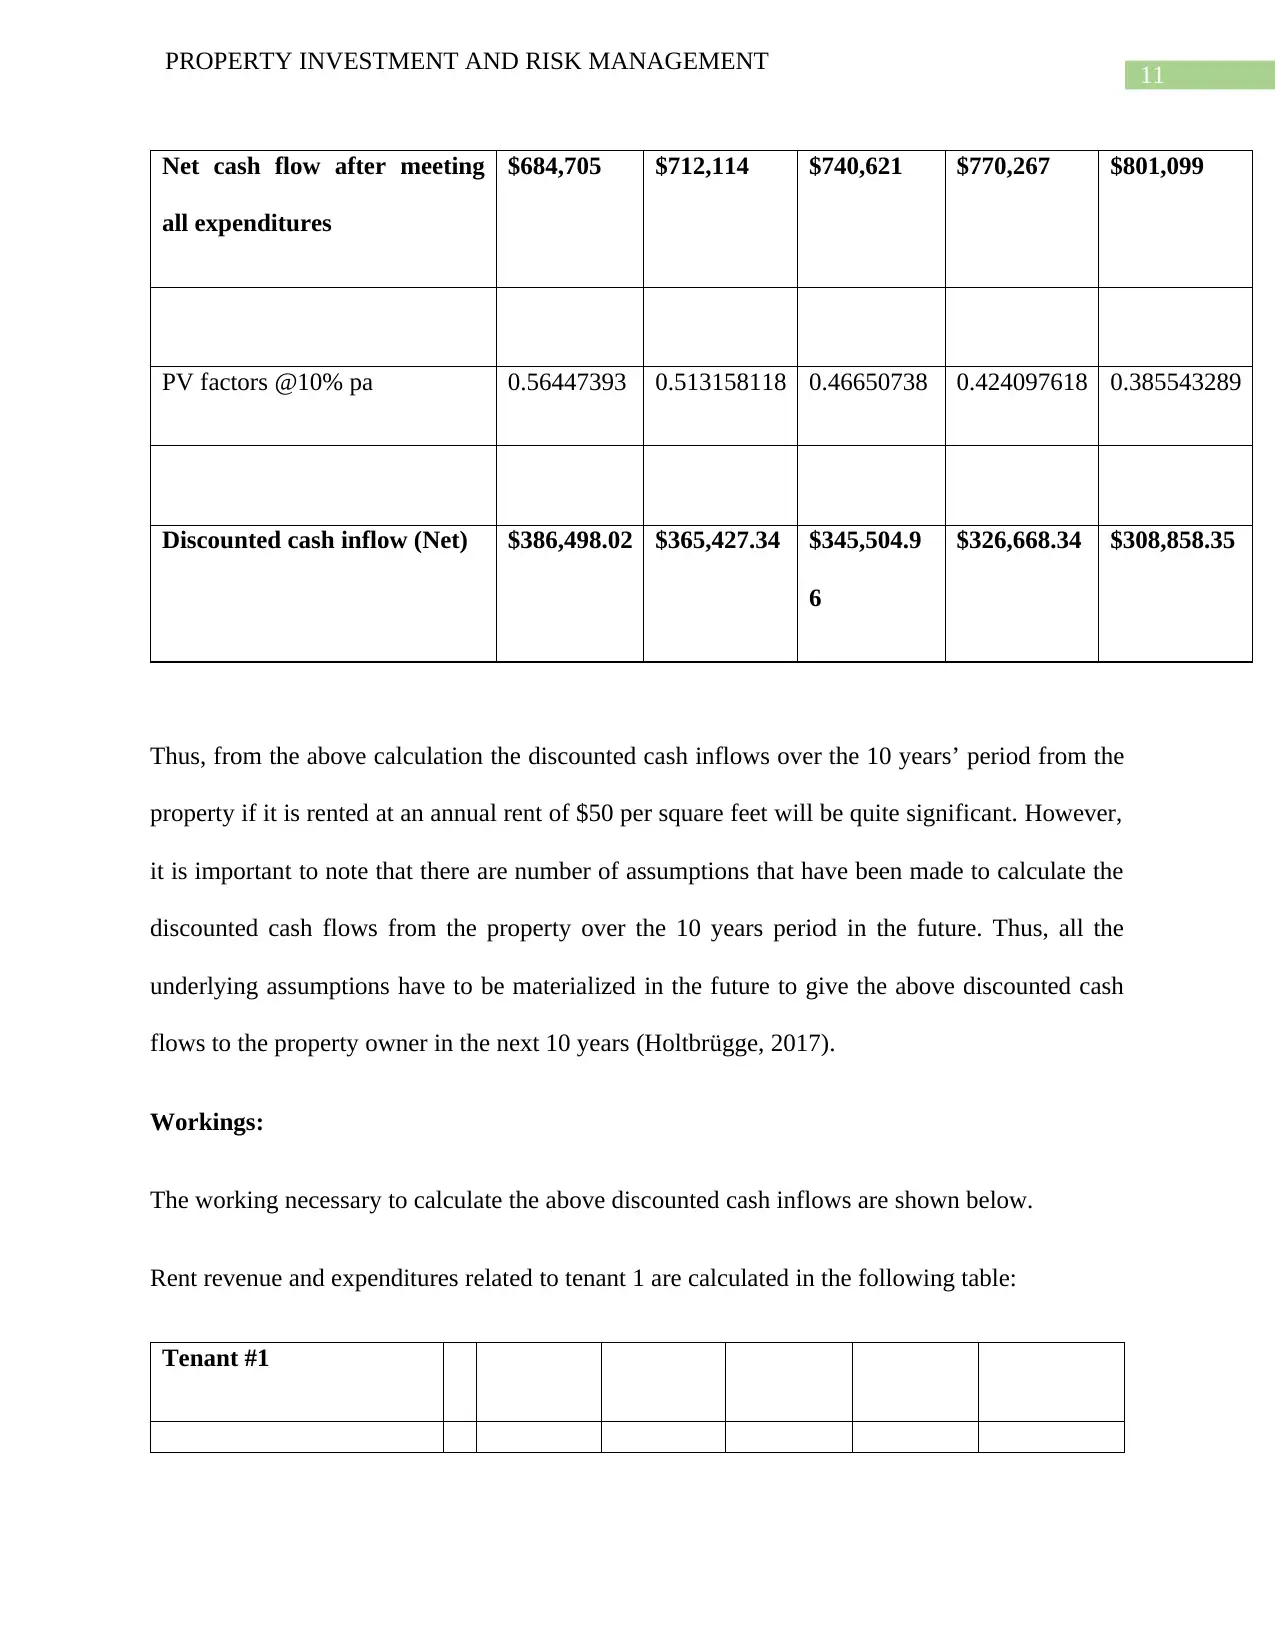
This report presents a detailed investment analysis of a multi-tenant office building located at 11 Stanton Road, Seven Hills, New South Wales. The analysis utilizes a discounted cash flow (DCF) model to project cash flows over a ten-year period, incorporating various inputs such as rental rates, expe...
Read More
Contribute Materials
Your contribution can guide someone’s learning journey. Share your
documents today.

Running head: PROPERTY INVESTMENT AND RISK MANAGEMENT
Property Investment and Risk Management
Name of the Student:
Name of the University:
Authors Note:
Property Investment and Risk Management
Name of the Student:
Name of the University:
Authors Note:
Secure Best Marks with AI Grader
Need help grading? Try our AI Grader for instant feedback on your assignments.

1
PROPERTY INVESTMENT AND RISK MANAGEMENT
Contents
Part 1: Introduction:.........................................................................................................................2
Part 2: Investment analysis:.............................................................................................................6
Projection of discounting cash flow:...........................................................................................6
Calculation of Internal rate of return (IRR) and net present value (NPV):...............................18
Part 3: Impact of leverage, risk and taxation on investment analysis:...........................................25
Part 4: Conclusion:........................................................................................................................26
References:....................................................................................................................................27

2
PROPERTY INVESTMENT AND RISK MANAGEMENT
Part 1: Introduction:
11 Stanton Road, Seven Hills, New South Wales 2147 property has a net floor area of 12,294
square meter and it was last sold in 2011 for $4,350,000. The property is an extremely attractive
property from the point of view tenants due to the attractive location of the property. The Seven
Hills area is an industrial area and since the property is located in there the demand for the
property is quite high with number of companies looking rent the property to use it as their front
offices. It has been assumed that the current owner of the property decided to rent the property to
two different tenants. In order to assess the desirability of renting the property to the tenants a
detailed calculative analysis is conducted here to calculate the net present value (NPV) and
internal rate of return of the property (Essential guide for European property business, 2015).
The following data about the property and rent agreement of the property at 11 Stanton Road,
Seven Hills, New South Wales 2147 have been accumulated along with certain assumptions to
calculate the discounted cash flows from the property over the next 10 years on the basis of
which NPV and IRR of the property shall be calculated in this document (Drejer, 2018).
Inputs to calculate projected discounted cash flows
Name of the property: 11 Stanton Road, Seven Hills
Address of the property: 11 Stanton Road, Seven Hills, New South Wales
2147
NSW 2147

3
PROPERTY INVESTMENT AND RISK MANAGEMENT
Type of property: Multi-tenant Office Bldg.
Total Building Area (Sq.Ft.): 12,294
Date of rent period starting: 01.01.2019
Number of years for the analysis 10
Rate of general inflation 4%
Vacancy rate 0%
Loss of credit / collection 0%
Expenses reimbursed
Common Area Maintenance $1.75 per sq.ft./yr.
Ad Valorem Tax $2,750 per yr.
Property Insurance $0.65 per sq.ft./yr.
Utilities $1.80 per sq.ft./yr.
Expense incurred on Administrative purpose $0.20 per sq.ft./yr.
Expenses not to be reimbursed
Management fee 2% of Annual gross rent
Secure Best Marks with AI Grader
Need help grading? Try our AI Grader for instant feedback on your assignments.

4
PROPERTY INVESTMENT AND RISK MANAGEMENT
Assumptions for Market Leasing
Market Rent $50.00 per sq.ft./yr.
Months Vacant (between tenants if the
tenant vacates before expiry of tenancy
agreement)
3 Months
Tenant Improvement Allowance $1.50 per sq.ft.
Term Length 10 Years
Resale Assumptions:
Terminal Cap Rate 10%
Resale Adjustment (Commission) 2%
Valuation Assumptions:
Appropriate rate of discount 10.00%
Tenancy agreements information

5
PROPERTY INVESTMENT AND RISK MANAGEMENT
Tenan
t 1
Tenant 2
Tenant Name John
Willis
Charles Atkinson
Rental Rate/Sq.Ft. $50.00 $50.00
Occupied Area in Sq.Ft. (tenants) 7,000 5,294
Beginning term 01-01-
19
01-01-19
Term in Years 10 10
Tenancy agreements information
Tenant 1 Tenant 2
Tenant Name John Willis Charles Atkinson
Rental Rate/Sq.Ft. $50.00 $50.00
Occupied Area in Sq.Ft. (tenants) 7,000 5,294

6
PROPERTY INVESTMENT AND RISK MANAGEMENT
Beginning term 01-01-19 01-01-19
Term in Years 10 10
Using the above information and assumptions let us calculate the discounted cash flows from the
property over the next 10 years to calculate NPV and IRR of the property.
Part 2: Investment analysis:
Projection of discounting cash flow:
Discounted cash inflows are calculated to project the expected net cash flows from a property
over an extended period by adjusting the cash inflows of the future by using an appropriate rate
of discount to adjust the time value of money. The discounted cash inflows are also used to
calculate the NPV of a project or property (Hodgson, 2017). In this case using the information
above a detailed discounted cash inflows from the property over the next 10 years is calculated in
the table below.
Year 1 Year 2 Year 3 Year 4 Year 5
Year ending Dec-19 Dec-20 Dec-21 Dec-22 Dec-23
Gross revenue
(Expected)
Revenue from rental $614,700 $639,288 $664,860 $691,454 $719,112
Less: Loss due to $0 $0 $0 $0 $0
Paraphrase This Document
Need a fresh take? Get an instant paraphrase of this document with our AI Paraphraser

7
PROPERTY INVESTMENT AND RISK MANAGEMENT
absorption & Turnover
Vac.
Net rent receivable $614,700 $639,288 $664,860 $691,454 $719,112
Total Reimbursement
Revenue
$56,844 $58,688 $60,606 $62,600 $64,675
Effective Gross Revenue
receivable
$671,544 $697,976 $725,465 $754,054 $783,787
Operating Expenses
Reimbursable
Expenses
Common Area
Maintenance
$21,515 $22,375 $23,270 $24,201 $25,169
Ad Valorem Tax $2,750 $2,750 $2,750 $2,750 $2,750
Property Insurance $7,991 $7,991 $7,991 $7,991 $7,991
Utilities $22,129 $23,014 $23,935 $24,892 $25,888

8
PROPERTY INVESTMENT AND RISK MANAGEMENT
Administrative
Expense
$2,459 $2,557 $2,659 $2,766 $2,876
Non-reimbursable
Expenses
Management $12,294.00 $34,898.79 $36,273.25 $37,702.70 $39,189.33
Total Operating
Expenses
$69,138 $93,586 $96,879 $100,303 $103,864
Net Operating Income $602,406 $604,389 $628,586 $653,751 $679,923
Capital cost
Tenant Improvements $18,441 $19,179 $19,946 $20,744 $21,573
Total Capital Costs $18,441 $19,179 $19,946 $20,744 $21,573
Net cash flow after
meeting all expenditures
$583,965 $585,211 $608,640 $633,008 $658,349
PV factors @10% pa 0.909090909 0.826446281 0.751314801 0.683013455 0.620921323

9
PROPERTY INVESTMENT AND RISK MANAGEMENT
Discounted cash inflow
(Net)
$530,877.27 $483,645.10 $457,280.60 $432,352.70 $408,783.16
Projected cash inflow
Beginning 1/1/2019
Year 6 Year 7 Year 8 Year 9 Year 10
Year ending Dec-24 Dec-25 Dec-26 Dec-27 Dec-28
Gross revenue (Expected)
Revenue from rental $747,877 $777,792 $808,903 $841,259 $874,910
Less: Loss due to absorption &
Turnover Vac.
$0 $0 $0 $0 $0
Net rent receivable $747,877 $777,792 $808,903 $841,259 $874,910
Total Reimbursement Revenue $66,832 $69,075 $71,409 $73,836 $76,359
Effective Gross Revenue
receivable
$814,708 $846,867 $880,312 $915,095 $951,269
Operating Expenses
Secure Best Marks with AI Grader
Need help grading? Try our AI Grader for instant feedback on your assignments.

10
PROPERTY INVESTMENT AND RISK MANAGEMENT
Reimbursable Expenses
Common Area Maintenance $26,176 $27,223 $28,312 $29,444 $30,622
Ad Valorem Tax $2,750 $2,750 $2,750 $2,750 $2,750
Property Insurance $7,991 $7,991 $7,991 $7,991 $7,991
Utilities $26,924 $28,000 $29,121 $30,285 $31,497
Administrative Expense $2,992 $3,111 $3,236 $3,365 $3,500
Non-reimbursable Expenses
Management $40,735.42 $42,343.35 $44,015.61 $45,754.75 $47,563.46
Total Operating Expenses $107,567 $111,419 $115,424 $119,590 $123,923
Net Operating Income $707,141 $735,448 $764,888 $795,505 $827,346
Capital cost
Tenant Improvements $22,436 $23,334 $24,267 $25,238 $26,247
Total Capital Costs $22,436 $23,334 $24,267 $25,238 $26,247

11
PROPERTY INVESTMENT AND RISK MANAGEMENT
Net cash flow after meeting
all expenditures
$684,705 $712,114 $740,621 $770,267 $801,099
PV factors @10% pa 0.56447393 0.513158118 0.46650738 0.424097618 0.385543289
Discounted cash inflow (Net) $386,498.02 $365,427.34 $345,504.9
6
$326,668.34 $308,858.35
Thus, from the above calculation the discounted cash inflows over the 10 years’ period from the
property if it is rented at an annual rent of $50 per square feet will be quite significant. However,
it is important to note that there are number of assumptions that have been made to calculate the
discounted cash flows from the property over the 10 years period in the future. Thus, all the
underlying assumptions have to be materialized in the future to give the above discounted cash
flows to the property owner in the next 10 years (Holtbrügge, 2017).
Workings:
The working necessary to calculate the above discounted cash inflows are shown below.
Rent revenue and expenditures related to tenant 1 are calculated in the following table:
Tenant #1

12
PROPERTY INVESTMENT AND RISK MANAGEMENT
Year 1 Year 2 Year 3 Year 4 Year 5
For Yr. Ending Dec-19 Dec-20 Dec-21 Dec-22 Dec-23
Base Rental Revenue $350,000 $364,000 $378,560 $393,702 $409,450
Less Absorption &
Turnover Vac.
$0 $0 $0 $0 $0
Scheduled Base Rental
Revenue
$350,000 $364,000 $378,560 $393,702 $409,450
Expense Reimbursement
Rev.
$32,366 $33,416 $34,508 $35,643 $36,825
Total Potential Gross
Revenue
$382,366 $397,416 $413,068 $429,346 $446,275
Leasing and Capital
Costs
Tenant Improvements 10500 10920 11356.8 11811.07
2
12283.5148
8
PROPERTY INVESTMENT AND RISK MANAGEMENT
Year 1 Year 2 Year 3 Year 4 Year 5
For Yr. Ending Dec-19 Dec-20 Dec-21 Dec-22 Dec-23
Base Rental Revenue $350,000 $364,000 $378,560 $393,702 $409,450
Less Absorption &
Turnover Vac.
$0 $0 $0 $0 $0
Scheduled Base Rental
Revenue
$350,000 $364,000 $378,560 $393,702 $409,450
Expense Reimbursement
Rev.
$32,366 $33,416 $34,508 $35,643 $36,825
Total Potential Gross
Revenue
$382,366 $397,416 $413,068 $429,346 $446,275
Leasing and Capital
Costs
Tenant Improvements 10500 10920 11356.8 11811.07
2
12283.5148
8
Paraphrase This Document
Need a fresh take? Get an instant paraphrase of this document with our AI Paraphraser

13
PROPERTY INVESTMENT AND RISK MANAGEMENT
Total Potential Net Cash
Flow
$371,866 $386,496 $401,711 $417,535 $433,992
Market Rent per Sq.Ft. $50.00 $50.00 $50.00 $50.00 $50.00
Inflation Factor 1.0300 1.0609 1.0927 1.1255 1.1593
Tenant #1
Year 6 Year 7 Year 8 Year 9 Year 10
For Yr. Ending Dec-24 Dec-25 Dec-26 Dec-27 Dec-28
Base Rental Revenue $425,829 $442,862 $460,576 $478,999 $498,159
Less Absorption &
Turnover Vac.
$0 $0 $0 $0 $0
Scheduled Base
Rental Revenue
$425,829 $442,862 $460,576 $478,999 $498,159
Expense
Reimbursement Rev.
$38,053 $39,330 $40,659 $40,659 $40,659
Total Potential Gross $463,881 $482,192 $501,235 $519,658 $538,818

14
PROPERTY INVESTMENT AND RISK MANAGEMENT
Revenue
Leasing and Capital
Costs
Tenant Improvements 12774.8554
8
13285.8496
9
13817.2836
8
14369.9750
3
14944.7740
3
Total Potential Net
Cash Flow
$451,107 $468,906 $487,418 $505,288 $523,873
Market Rent per
Sq.Ft.
$50.00 $50.00 $50.00 $50.00 $50.00
Inflation Factor 1.1941 1.2299 1.2668 1.3048 1.3439
Rent revenue and expenditures in relation to tenant 2 are shown in the table below:
Tenant #2
Year 1 Year 2 Year 3 Year 4 Year 5
For Yr. Ending Dec-19 Dec-20 Dec-21 Dec-22 Dec-23
Base Rental Revenue $264,700 $275,288 $286,300 $297,752 $309,662

15
PROPERTY INVESTMENT AND RISK MANAGEMENT
Less Absorption & Turnover
Vac.
$0 $0 $0 $0 $0
Scheduled Base Rental
Revenue
$264,700 $275,288 $286,300 $297,752 $309,662
Expense Reimbursement Rev. $24,478 $25,272 $26,098 $26,957 $27,850
Total Potential Gross
Revenue
$289,178 $300,560 $312,397 $324,708 $337,511
Leasing and Capital Costs
Tenant Improvements $7,941.0
0
$8,258.6
4
$8,588.9
9
$8,932.5
5
$9,289.8
5
Total Potential Net Cash Flow $281,237 $292,301 $303,808 $315,776 $328,222
Market Rent per Sq.Ft. $50.00 $50.00 $50.00 $50.00 $50.00
Inflation Factor 1.0300 1.0609 1.0927 1.1255 1.1593
Tenant #2
Secure Best Marks with AI Grader
Need help grading? Try our AI Grader for instant feedback on your assignments.

16
PROPERTY INVESTMENT AND RISK MANAGEMENT
Year 6 Year 7 Year 8 Year 9 Year 10
For Yr. Ending Dec-24 Dec-25 Dec-26 Dec-27 Dec-28
Base Rental Revenue $322,048 $334,930 $348,327 $362,260 $376,751
Less Absorption & Turnover
Vac.
$0 $0 $0 $0 $0
Scheduled Base Rental
Revenue
$322,048 $334,930 $348,327 $362,260 $376,751
Expense Reimbursement Rev. $28,779 $29,745 $30,750 $30,750 $30,750
Total Potential Gross
Revenue
$350,827 $364,675 $379,077 $393,010 $407,500
Leasing and Capital Costs
Tenant Improvements $9,661.4
4
$10,047.9
0
$10,449.8
1
$10,867.8
1
$11,302.5
2
Total Potential Net Cash Flow $341,165 $354,627 $368,627 $382,142 $396,198
Market Rent per Sq.Ft. $50.00 $50.00 $50.00 $50.00 $50.00

17
PROPERTY INVESTMENT AND RISK MANAGEMENT
Inflation Factor 1.1941 1.2299 1.2668 1.3048 1.3439
Calculation of Internal rate of return (IRR) and net present value (NPV):
Net present value and its importance:
Net present value is calculated by deducting the initial investment in property from the
cumulative present value of all cash inflows expected to accrue from the property. In this case
the discounted cash inflows calculated above shall be added to calculate the total present value of
cash expected to accrue from the property over the next 10 years, i.e. the period for which the
property expected to be rented. The amount of initial investment made to acquire the property
shall be deducted from the accumulated present value from the property to calculate the NPV. If
the resultant figure, i.e. NPV is positive then the property owner should proceed with the rental
agreement otherwise not (Nair and Blomquist, 2018).
Let us calculate then NPV of 11 Stanton Road property to see whether the rental agreement is
expected to benefit the owner of the property or not.
Prospective Present Value
Calculation of net present value (NPV)
Year Annual net cash inflow Present value factor @10%
pa
Present Value
of Cash Flow
@ 10% pa

18
PROPERTY INVESTMENT AND RISK MANAGEMENT
1 $583,965 $0.909
530,877.27
2 $585,211 $0.826
483,645.10
3 $608,640 $0.751
457,280.60
4 $633,008 $0.683
432,352.70
5 $658,349 $0.621
408,783.16
6 $684,705 $0.564
386,498.02
7 $712,114 $0.513
365,427.34
8 $740,621 $0.467
345,504.96
9 $770,267 $0.424
326,668.34
10 $801,099 $0.386
Paraphrase This Document
Need a fresh take? Get an instant paraphrase of this document with our AI Paraphraser

19
PROPERTY INVESTMENT AND RISK MANAGEMENT
308,858.35
Total Cash Flow $6,777,979
4,045,895.85
Property Resale @
Cap Rate
$6,147,000
Less Adjustments $122,940
Net Resale Cash
Flow
$6,024,060
2,322,535.91
Total Property
Present Value
6,368,431.75
Rounded to
Thousands (use a
formula)
6,368,436.99
Less: Property
purchase value in
2011 (last time the
property sold)
4,350,000.00
Net present value 2,018,436.99

20
PROPERTY INVESTMENT AND RISK MANAGEMENT
(NPV)
As can be seen that the expected net present value of the property is $2,018,436.99 which is
extremely encouraging for the current owner of the property. Thus, on the basis of NPV of the
property the owner should enter into the rental agreement with the tenants to rent the property.
Again cautions need to be used while analyzing the information and it is the fact that there have
been number of assumptions that have been made to calculate the discounted cash inflows and
net present value of the property from rental agreement. Thus, realization of about outcome is to
a large extent dependent on the materiality of assumptions (Pitt, 2018).
Internal rate of return (IRR):
Internal rate of return or IRR is the rate of interest at which the expected net cash inflows of a
project will be equal to zero. Thus, higher the IRR better it is for an organization or property. In
order to calculate the IRR of a property or project the following formula is used (Szakonyi,
2018).
Using the above formula the IRR of the property is calculated in the table below:
Internal rate of return (IRR)

21
PROPERTY INVESTMENT AND RISK MANAGEMENT
Particulars Amount ($)
Initial investment 4,350,000.00
Year Annual net cash inflows ($)
1 583,965.00
2 585,210.58
3 608,640.48
4 633,007.58
5 658,349.37
6 684,704.82
7 712,114.50
8 740,620.56
9 770,266.87
10 801,099.02
Calculation of IRR
Year Annual net cash inflows
Secure Best Marks with AI Grader
Need help grading? Try our AI Grader for instant feedback on your assignments.

22
PROPERTY INVESTMENT AND RISK MANAGEMENT
($)
0 (4,350,00
0.00)
1 583,96
5.00
2 585,21
0.58
3 608,64
0.48
4 633,00
7.58
5 658,34
9.37
6 684,70
4.82
7 712,11
4.50
8 740,62
0.56
9 770,26
PROPERTY INVESTMENT AND RISK MANAGEMENT
($)
0 (4,350,00
0.00)
1 583,96
5.00
2 585,21
0.58
3 608,64
0.48
4 633,00
7.58
5 658,34
9.37
6 684,70
4.82
7 712,11
4.50
8 740,62
0.56
9 770,26

23
PROPERTY INVESTMENT AND RISK MANAGEMENT
6.87
10 801,09
9.02
IRR 8.44%
Thus, IRR of the property is 8.44% which is quite low as generally an IRR between 12% and
15% is considered suitable for an organization. However, considering that the IRR does not take
into consideration the expected terminal value of the property hence, the IRR of 8.44% is also
quite beneficial especially considering the huge NPV of the project earlier (Tinnilä, 2016).
Taking into consideration the NPV and IRR of the property it is clear that the property owner is
expected to earn significant return on the amount of investment made to acquire the property, i.e.
$4,350,000.00 when the property was last sold in 2011. Thus, the owner should enter into the
rental agreement to provide the property on rent (Tjaden, 2016).
Part 3: Impact of leverage, risk and taxation on investment analysis:
The impact of leverage, risk and taxation on investment analysis is quite significant as the
investors are risk adverse people and prefers minimum risk to earn maximum return from
investment property. Leverage allows the investors to use operating leverage by using tax shields
by using expenditures such depreciation and other which though does not result in actual outflow
of cash but helps in minimizing the taxable income from a property. Leverage allows investors to
reduce the amount of tax to be paid to maximize the net cash inflows from a property. Thus,

24
PROPERTY INVESTMENT AND RISK MANAGEMENT
impact of leverage on property is quite significant as directly affects the resultant outcome for a
project as well as a property (Crane, 2016).
Risk is one of the key attributes that affects the decision making process of investors. In fact risk
is probably the most crucial factor that determines the decision of an investor. Hence, higher the
risk that an investor bears for any investment proposal, it is expected that the investor will be
compensated by proving higher return. Thus, there is direct and positive correlation between risk
and return on investment proposals. Hence, the impact of risk on investment analysis is
significant and must be considered carefully while analyzing an investment proposal (Djordjevic,
2017).
Taxation again is one of the important variables that an investor considers when taking
investment related decisions. This is because the higher the tax the lower the net cash inflows
from an investment proposal. Hence, the impact of taxation is quite real and an investor must
consider the implications of taxation on expected income from a property before taking the final
decision in relation to the investment proposal (Business tenancies, 2018).
Part 4: Conclusion:
The discounted cash inflows expected to accrue from the property if it is rented as per the terms
and conditions provided in table 1 shows that the 11 Stanton Road Property situated in Seven
Hills, NSW 2147 will provide significant return in the future if all the underlying assumptions
are materialized in the future. Further calculation of net present value and internal rate of return
from the property show that the expected net benefit from the property is quite beneficial to the
current owner of the property. Hence, the owner of the property should go ahead and enter into
the tenancy agreements with two different tenants to earn significant return in the future.
Paraphrase This Document
Need a fresh take? Get an instant paraphrase of this document with our AI Paraphraser

25
PROPERTY INVESTMENT AND RISK MANAGEMENT

26
PROPERTY INVESTMENT AND RISK MANAGEMENT
References:
Business tenancies. (2018). Property Management, 22(3), pp.07-19.
Crane, M. (2016). The Business Occupier’s Handbook982Vicky Rubin. The Business Occupier’s
Handbook. Property Management, 19(4), pp.103-104.
Djordjevic, B. (2017). The Nature of Strategic Management. Archives of Business Research,
3(5), pp.28-39.
Drejer, A. (2018). Strategic innovation: a new perspective on strategic management. Handbook
of Business Strategy, 9(2), pp.143-147.
Essential guide for European property business. (2015). Property Management, 21(7), pp.17-33.
Hodgson, T. (2017). Management of business parks. Property Management, 11(4), pp.4-11.
Holtbrügge, D. (2017). Management of international strategic business cooperation: Situational
conditions, performance criteria, and success factors. Thunderbird International Business
Review, 51(7), pp.255-274.
Nair, S. and Blomquist, T. (2018). Failure prevention and management in business incubation:
practices towards a scalable business model. Technology Analysis & Strategic Management,
31(3), pp.266-278.
Pitt, M. (2018). Total business and facilities management: implementing a holistic and dynamic
self-re-enforcing framework for business certainty, continuity and growth. Property
Management, 24(2), pp.108-210.

27
PROPERTY INVESTMENT AND RISK MANAGEMENT
Szakonyi, R. (2018). Coordinating R&D and business planning. Technology Analysis &
Strategic Management, 4(5), pp.391-412.
Tinnilä, M. (2016). Strategic perspective to business process redesign. Business Process
Management Journal, 4(2), pp.44-59.
Tjaden, G. (2016). Measuring the information age business. Technology Analysis & Strategic
Management, 9(4), pp.233-246.
1 out of 28
Related Documents

Your All-in-One AI-Powered Toolkit for Academic Success.
+13062052269
info@desklib.com
Available 24*7 on WhatsApp / Email
Unlock your academic potential
© 2024 | Zucol Services PVT LTD | All rights reserved.