Property Investment and Risk Management Analysis Report - 2019 Q1

Verified

Added on  2022/09/18

|47
|5113
|20
Report
AI Summary
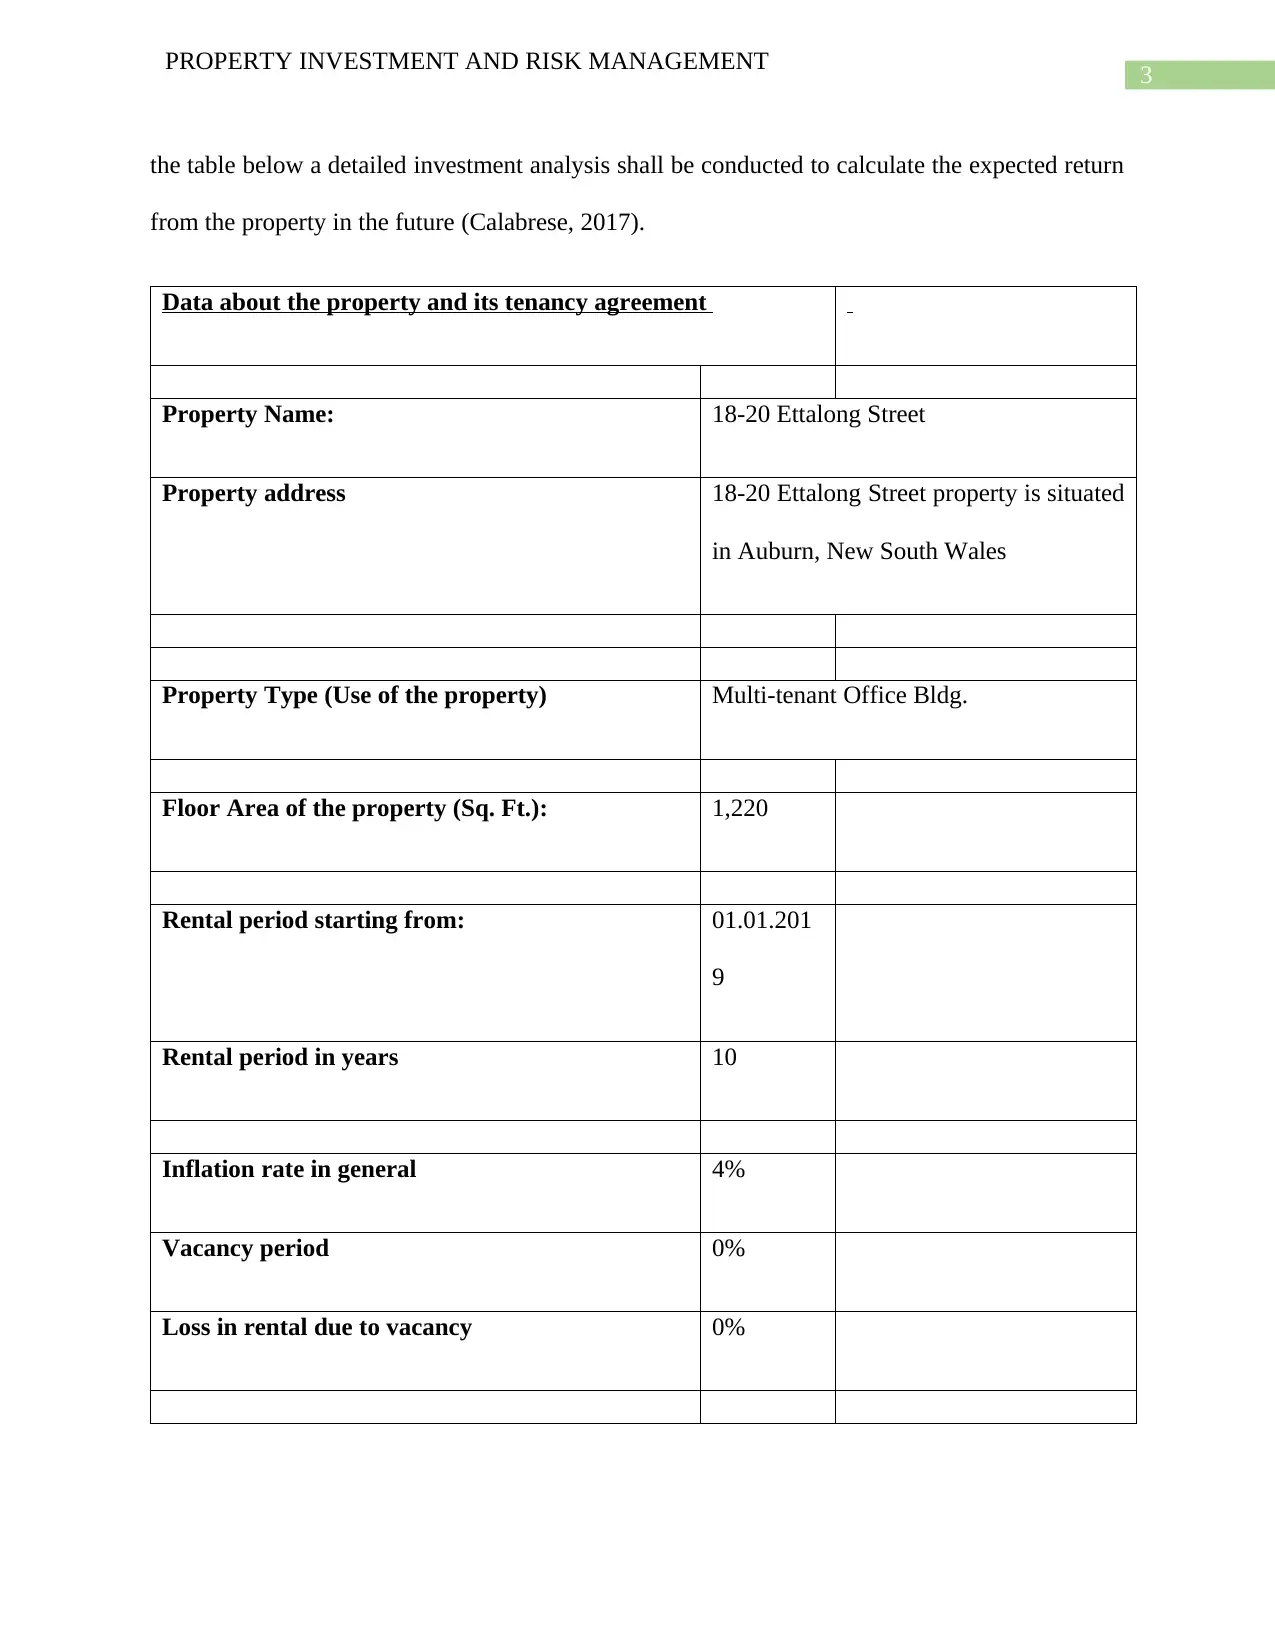
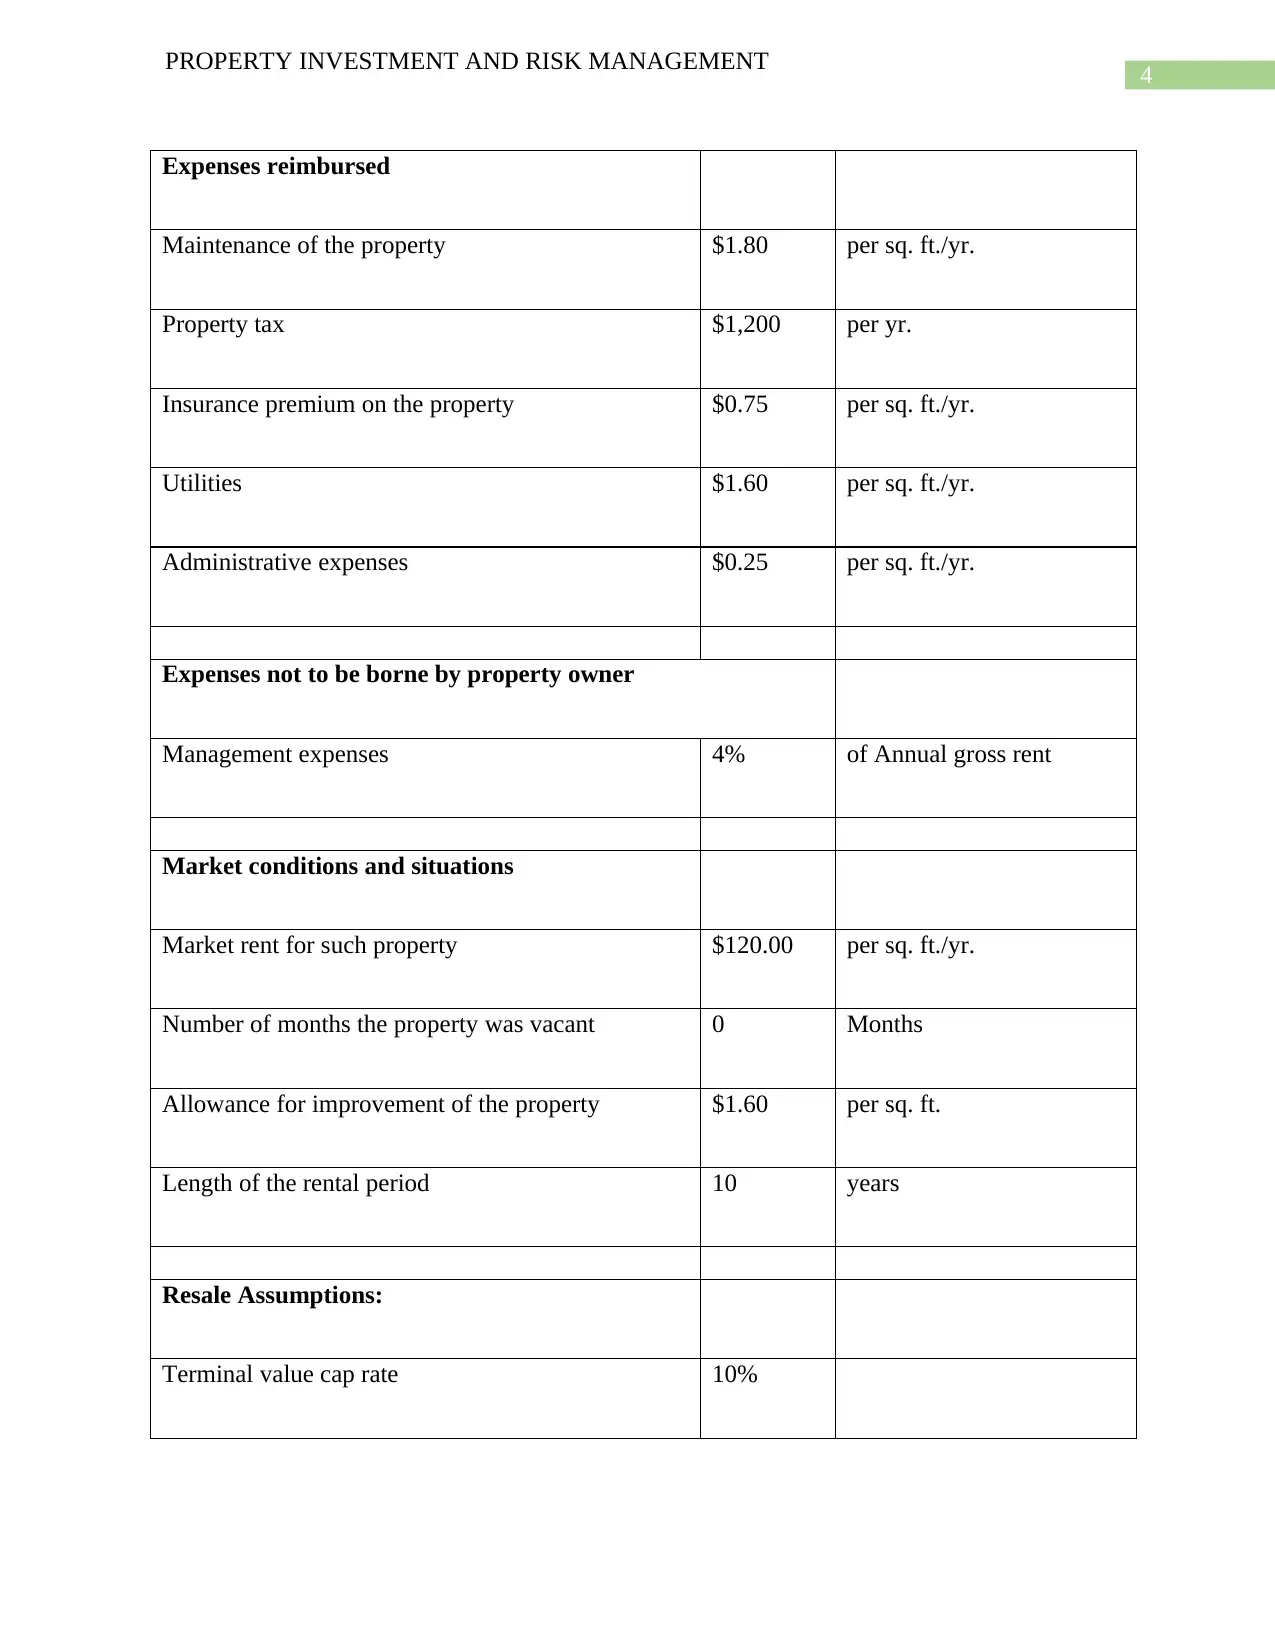
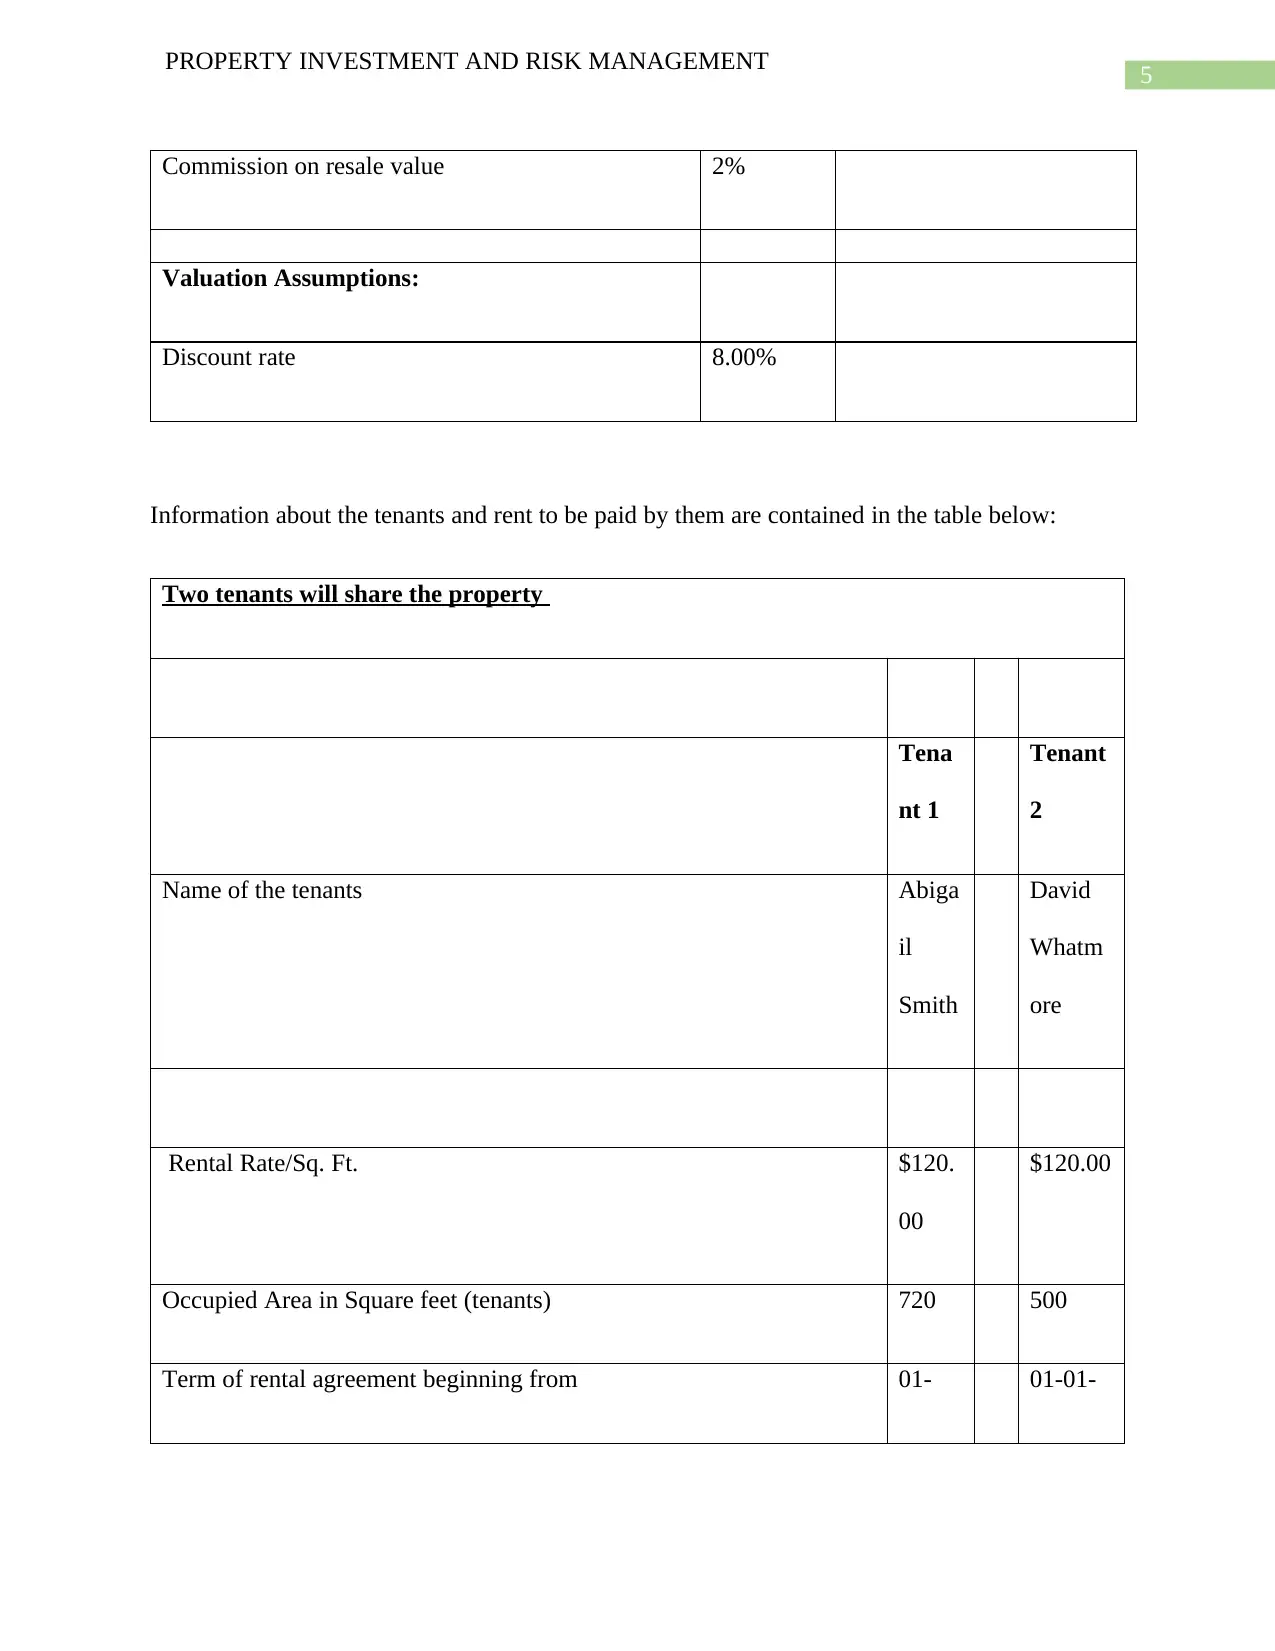
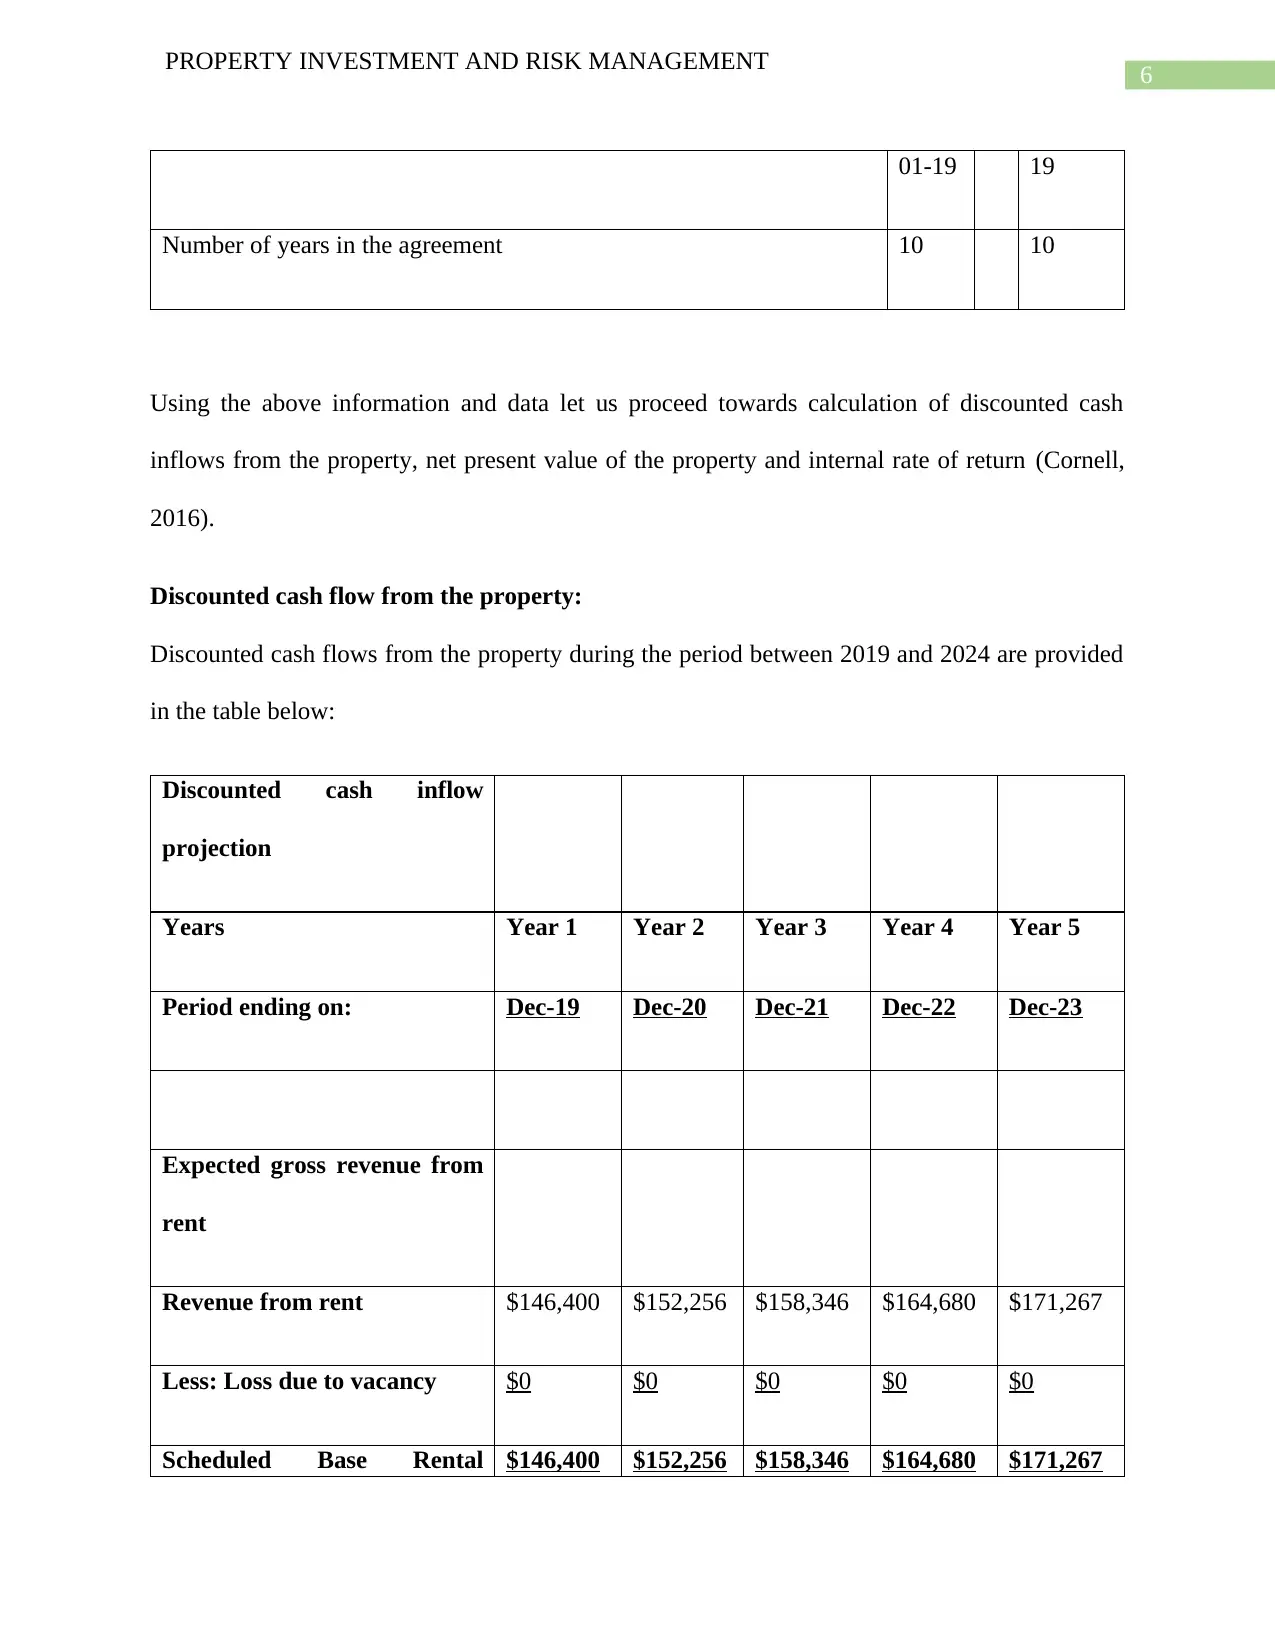
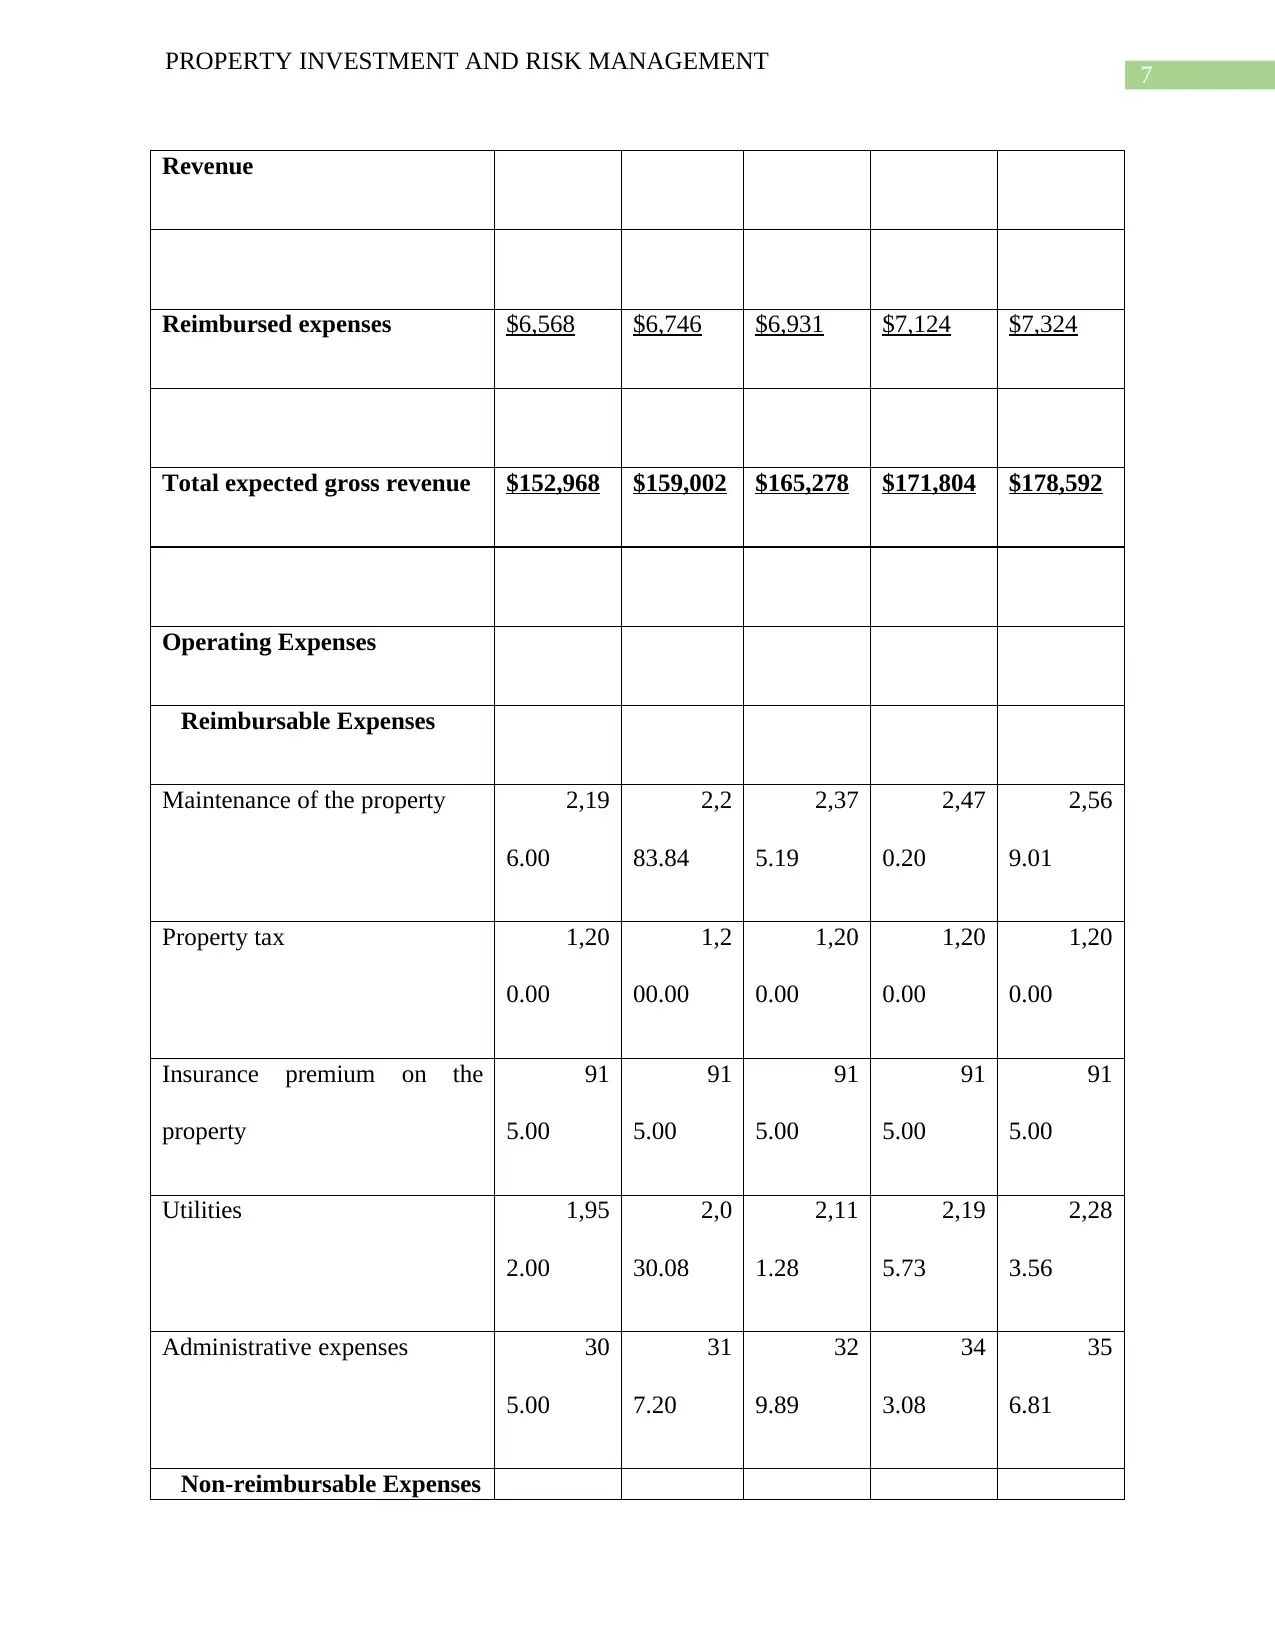
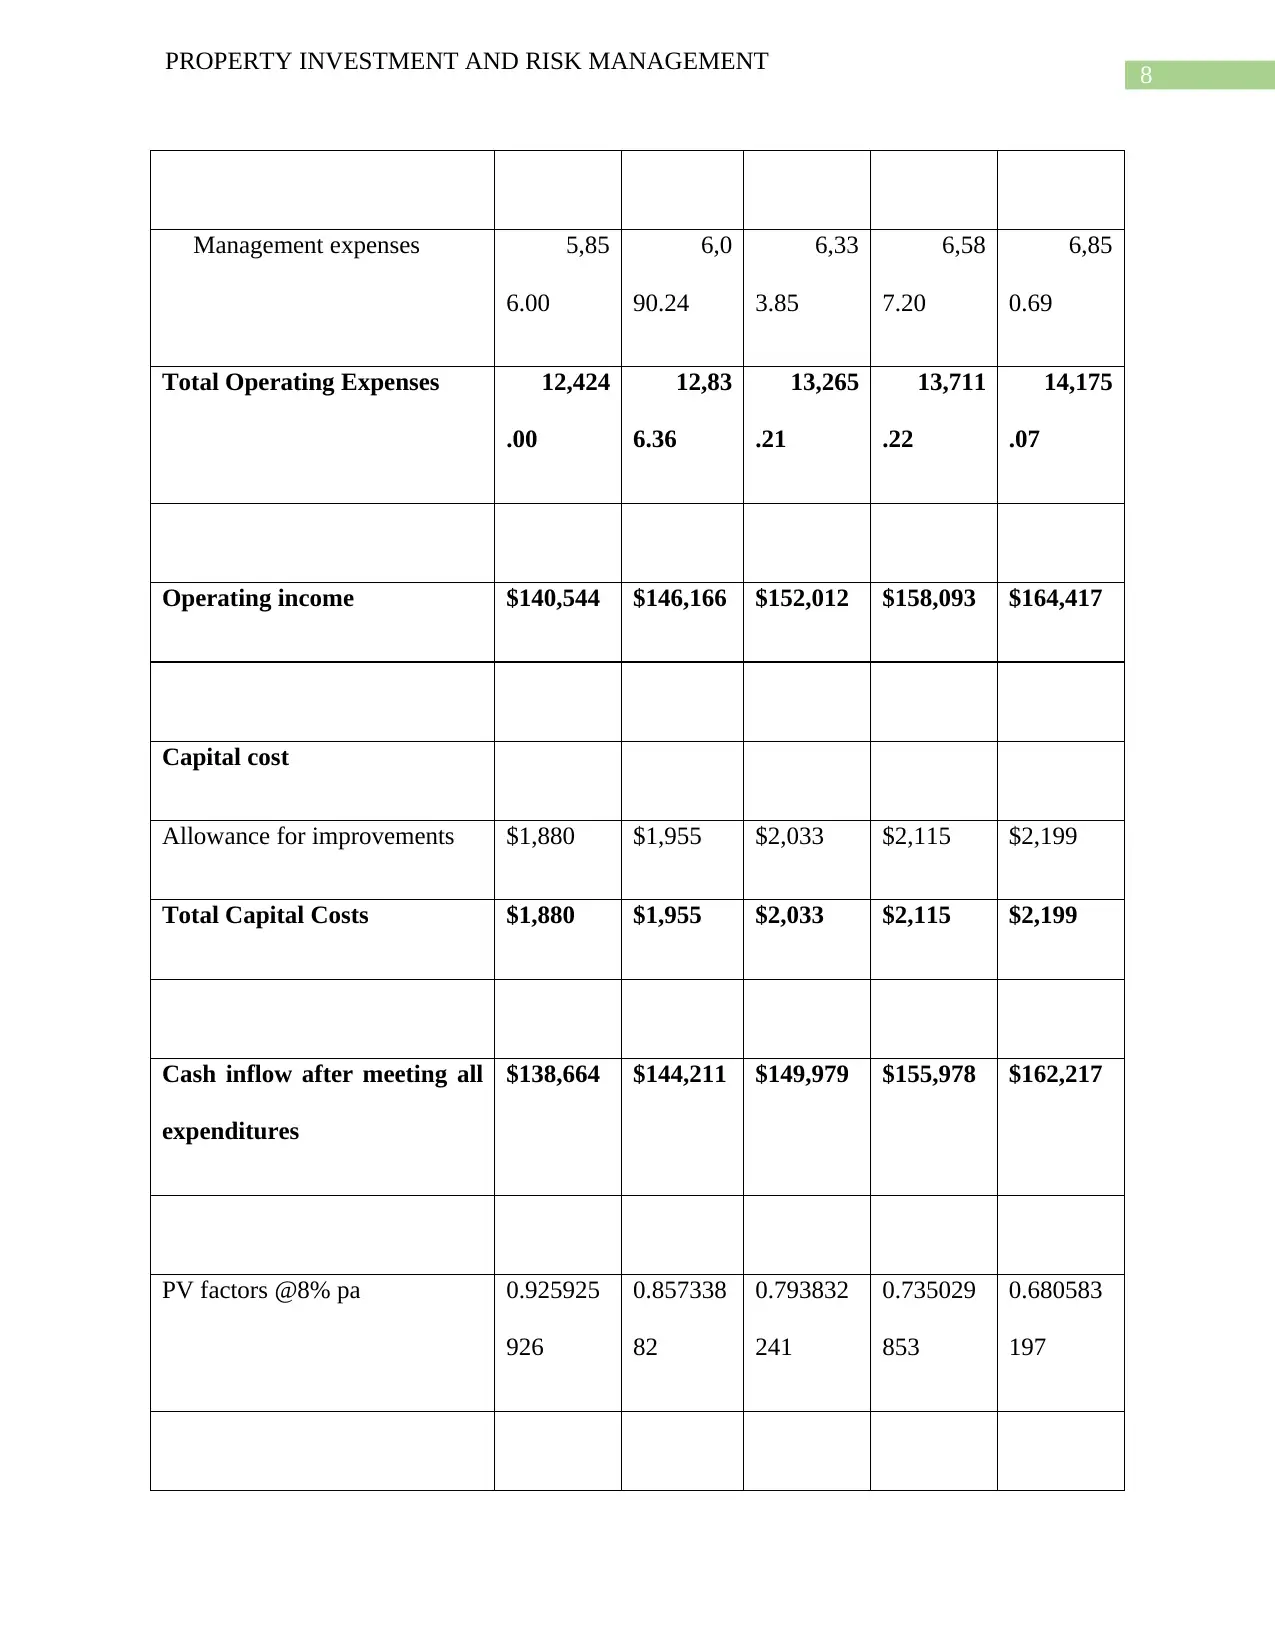
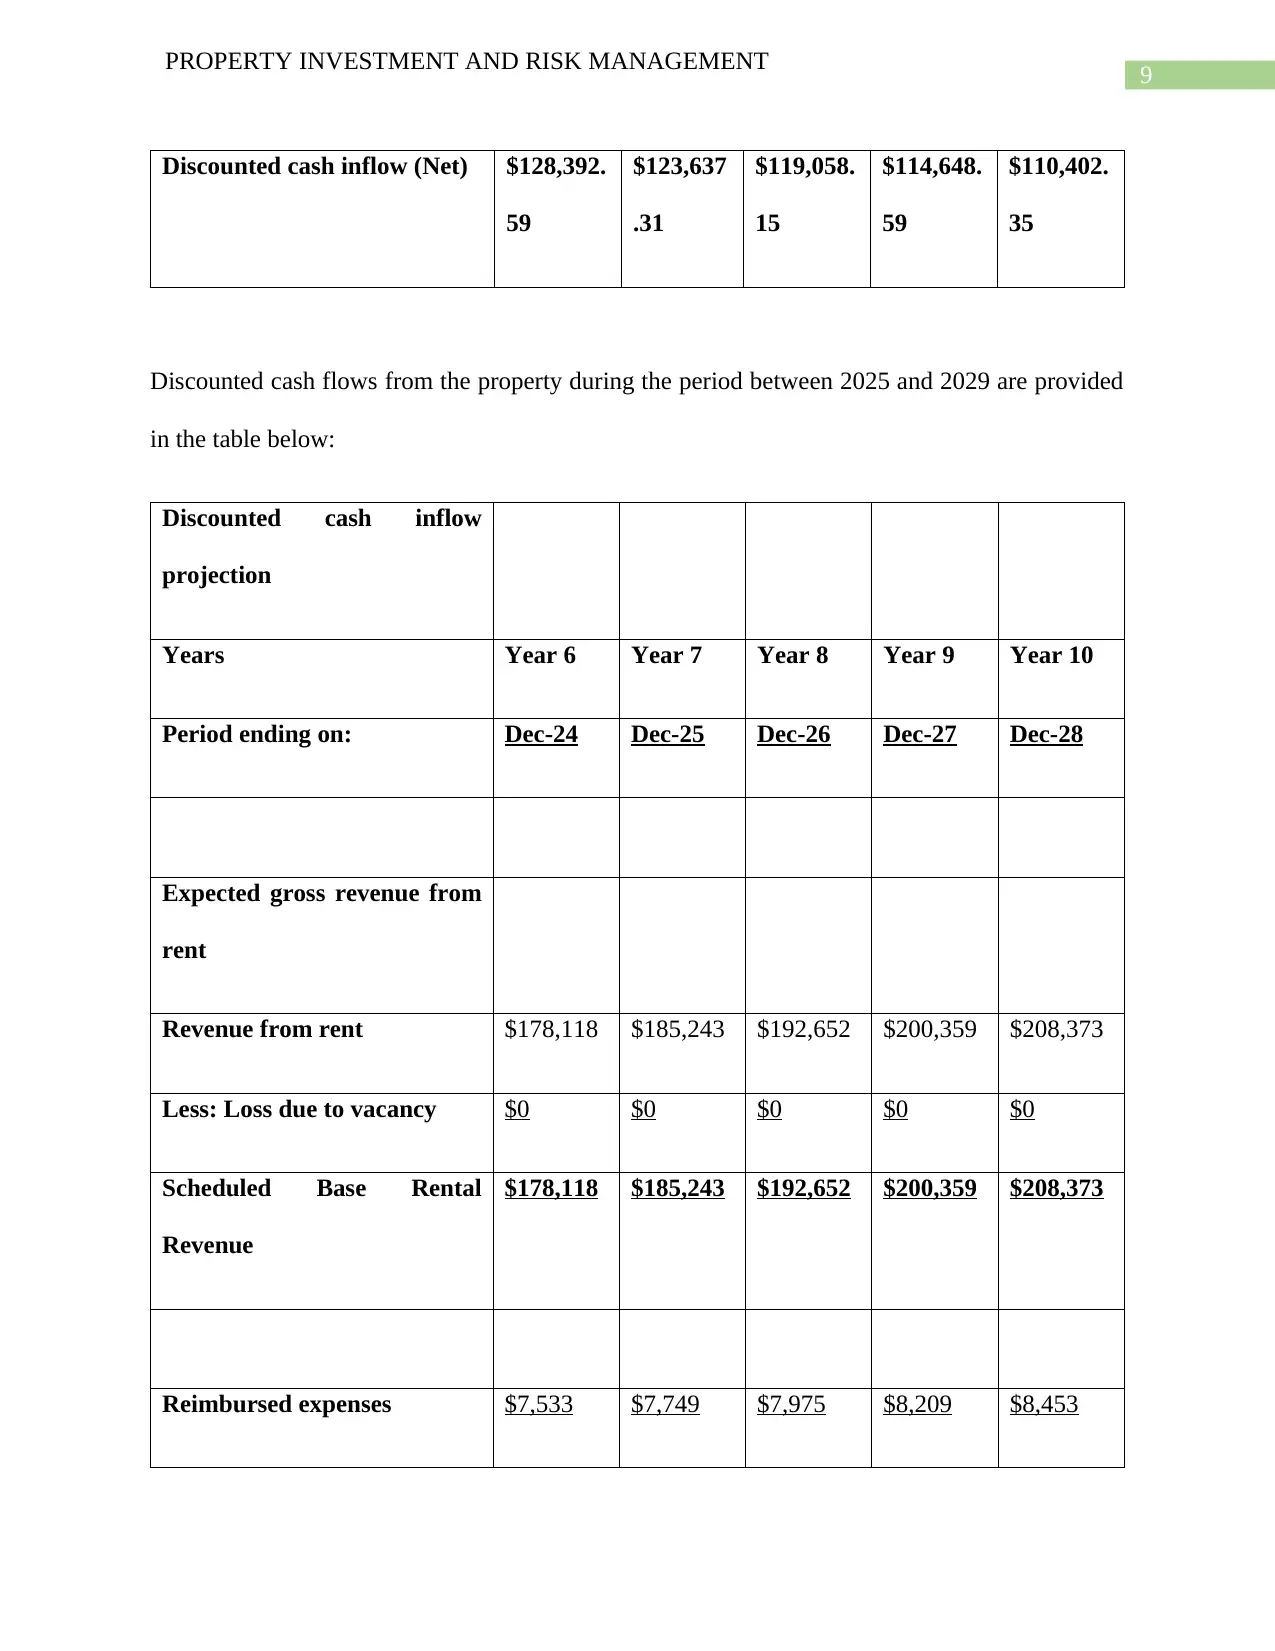
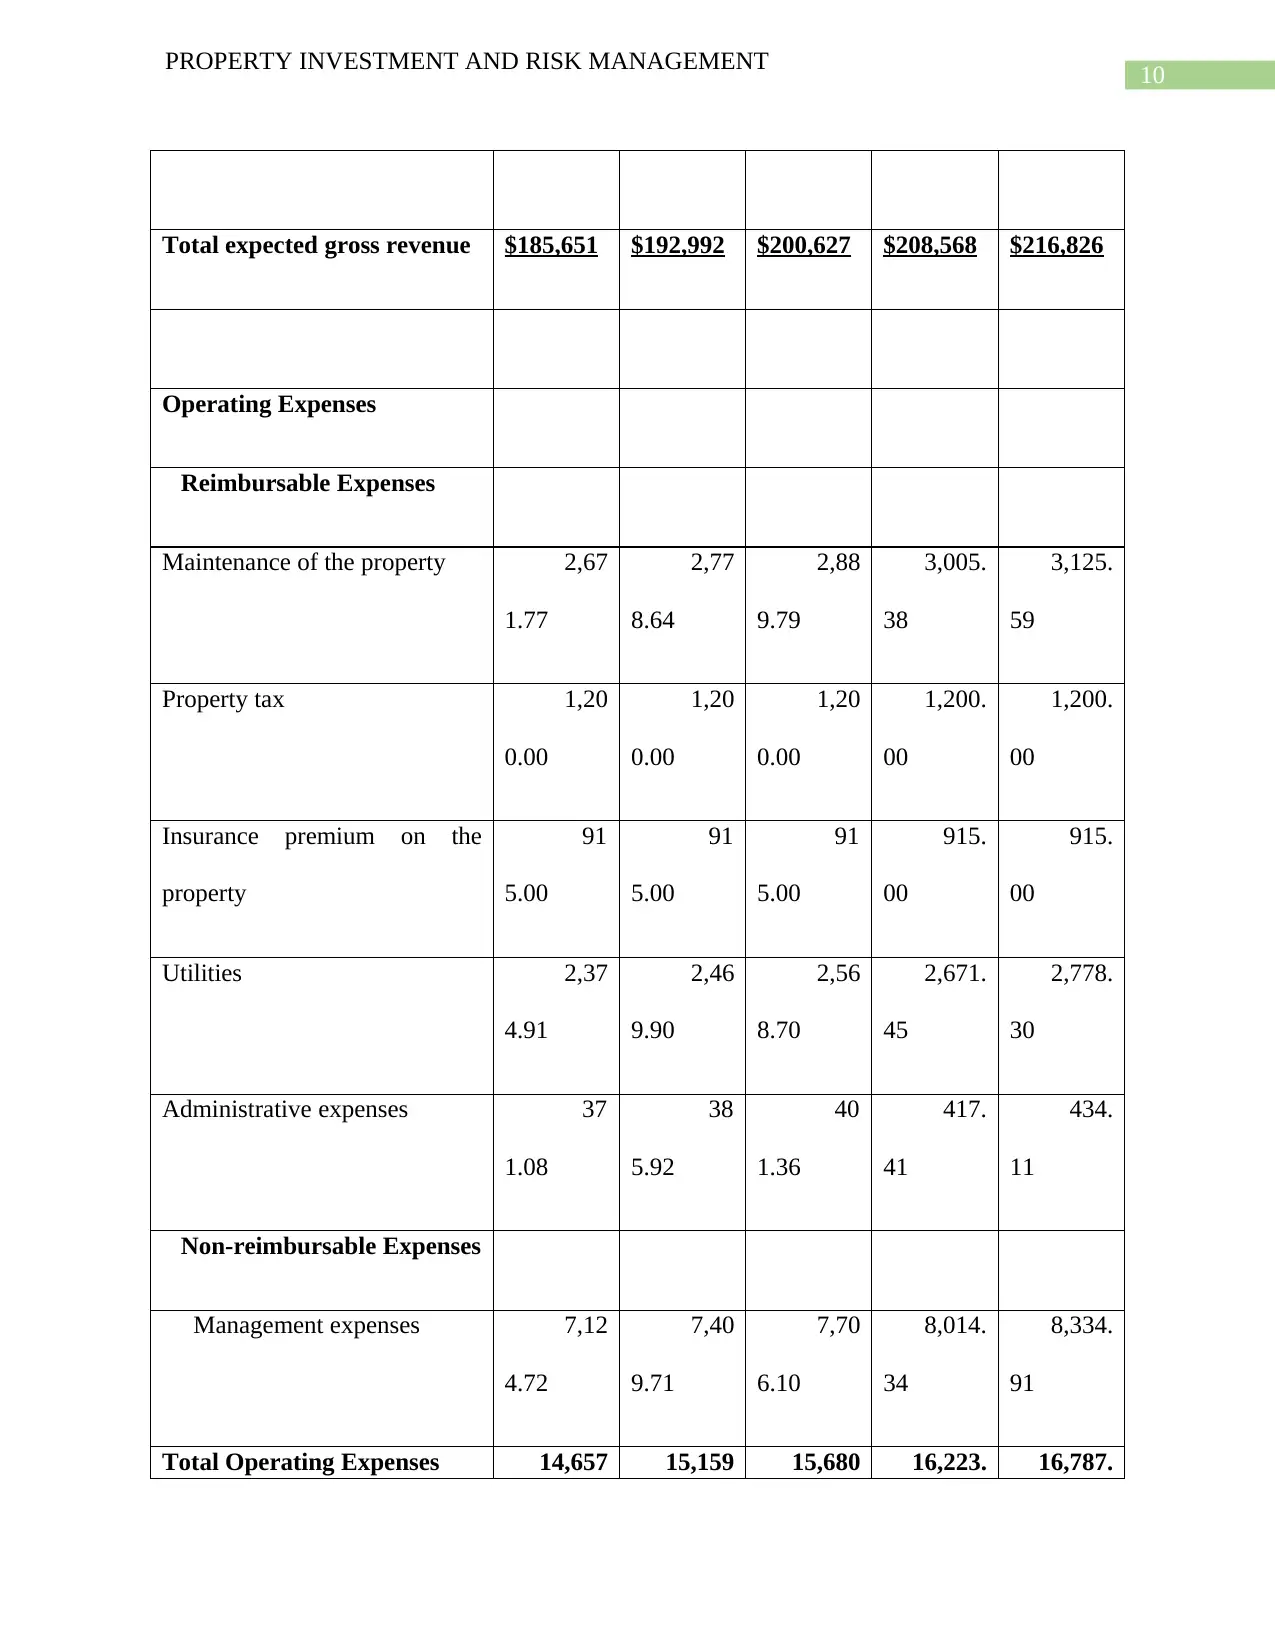
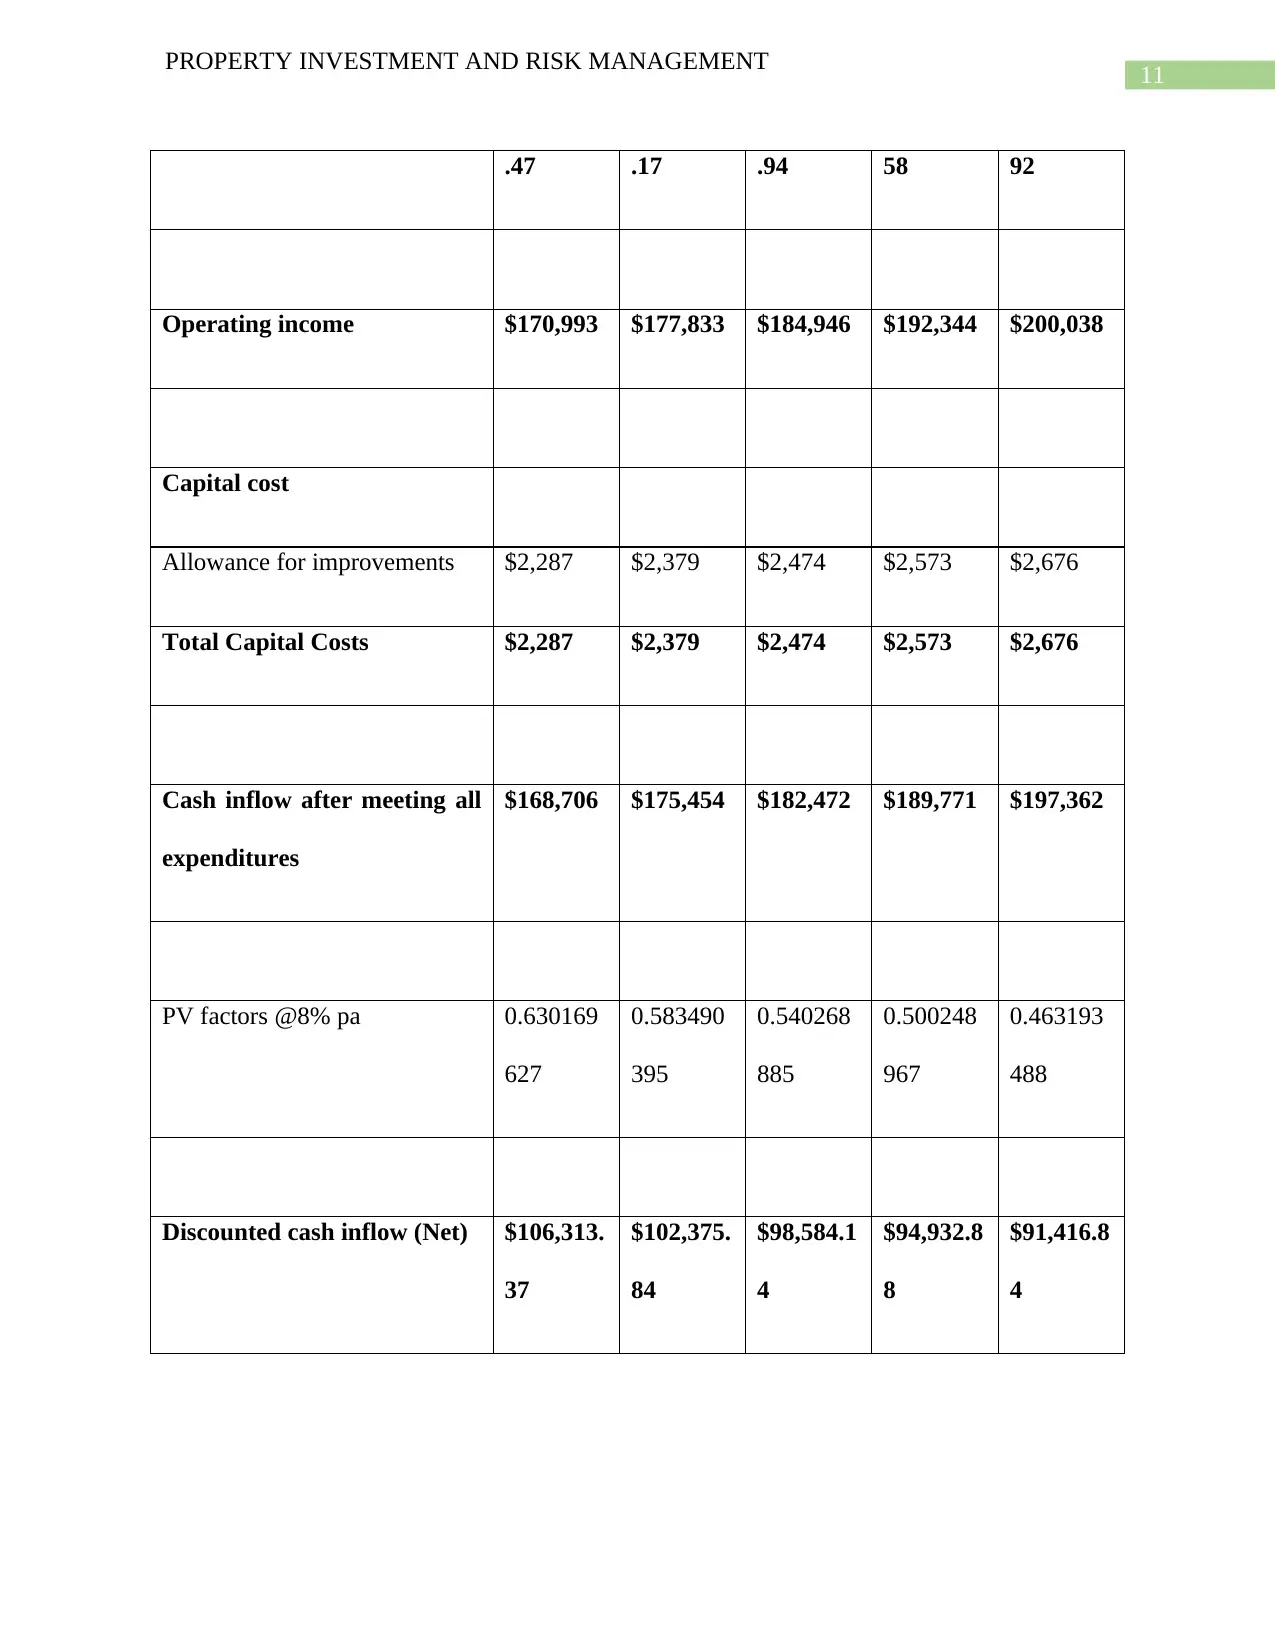
This report provides a detailed investment analysis of a multi-tenant office building located in Auburn, NSW, Australia, specifically 18-20 Ettalong Street. The analysis includes a discounted cash flow (DCF) projection over a 10-year period, calculating expected gross revenue, operating expenses, and net cash inflows. The report also incorporates tenancy and outgoing schedules for two tenants, outlining rental rates, expenses, and reimbursement revenues. Key financial metrics such as Net Present Value (NPV) and Internal Rate of Return (IRR) are calculated to assess the property's investment potential. The report considers various assumptions, including discount rates, terminal yields, and market conditions to evaluate the financial implications of renting the property. The impact of leverage, risk, and taxation on investment potential is also discussed, providing a comprehensive assessment of the property's investment viability.
Document Page
Running head: PROPERTY INVESTMENT AND RISK MANAGEMENT
Property Investment and Risk Management
Name of the Student:
Name of the University:
Authors Note:
tabler-icon-diamond-filled.svg

Secure Best Marks with AI Grader

Need help grading? Try our AI Grader for instant feedback on your assignments.
Document Page
1
PROPERTY INVESTMENT AND RISK MANAGEMENT
Contents
Introduction:....................................................................................................................................2
Investment analysis:.........................................................................................................................2
Discounted cash flow from the property:....................................................................................6
Tenancy schedule and outgoing schedule:................................................................................12
Discount rate:.............................................................................................................................22
Terminal yield:...........................................................................................................................22
Asking price:..............................................................................................................................22
Outgoing growth rate and CPI:..................................................................................................23
Market rent:...............................................................................................................................23
Net present value:......................................................................................................................23
Internal rate of return:................................................................................................................35
Impact of leverage, risk and taxation on investment potential:.....................................................37
Conclusion:....................................................................................................................................46
References:....................................................................................................................................47
Document Page
2
PROPERTY INVESTMENT AND RISK MANAGEMENT
Introduction:
Situated in Auburn, NSW, Australia, 18-20 Ettalong Street property is stretched to a total floor
area of 1220 square foot. It is a fully furnished property and extremely desirable from the point
of view of tenants due to its location. The reason that the property is so desirable is due to its
proximity to 22 primary schools located around it along with 70 DA approved places. The
property is also situated right behind the metro station in Ettalong Street making it even more
attractive for daily communication and connectivity. Considering the current market situation in
the real estate industry the owner should consider renting the property to tenant / tenants instead
of selling it in the real estate market. Attractive annual rent is expected to accrue from the
property due to the characteristics of the property as mentioned above. Taking into consideration
the market conditions and based on appropriate assumptions a detailed calculation has been
undertaken in document to assess the financial implications of the proposal to rent the property
in the future for the owner of the property (Wang and Wu, 2018).
Investment analysis:
In order to conduct a detailed investment analysis on the property it is important to have detailed
information about the property as well as the underlying variables. Considering the number of
assumptions that are required to conduct analysis of an investment proposal it is important to
make such assumptions properly to ensure that the final outcome of the investment analysis is
close to the reality in the future (Bird and Hunt, 2017).
The detailed information about the property and the market conditions commensurate to the
property and its location are contained in the table below. Using the data and information from
Document Page
3
PROPERTY INVESTMENT AND RISK MANAGEMENT
the table below a detailed investment analysis shall be conducted to calculate the expected return
from the property in the future (Calabrese, 2017).
Data about the property and its tenancy agreement
Property Name: 18-20 Ettalong Street
Property address 18-20 Ettalong Street property is situated
in Auburn, New South Wales
Property Type (Use of the property) Multi-tenant Office Bldg.
Floor Area of the property (Sq. Ft.): 1,220
Rental period starting from: 01.01.201
9
Rental period in years 10
Inflation rate in general 4%
Vacancy period 0%
Loss in rental due to vacancy 0%
tabler-icon-diamond-filled.svg

Secure Best Marks with AI Grader

Need help grading? Try our AI Grader for instant feedback on your assignments.
Document Page
4
PROPERTY INVESTMENT AND RISK MANAGEMENT
Expenses reimbursed
Maintenance of the property $1.80 per sq. ft./yr.
Property tax $1,200 per yr.
Insurance premium on the property $0.75 per sq. ft./yr.
Utilities $1.60 per sq. ft./yr.
Administrative expenses $0.25 per sq. ft./yr.
Expenses not to be borne by property owner
Management expenses 4% of Annual gross rent
Market conditions and situations
Market rent for such property $120.00 per sq. ft./yr.
Number of months the property was vacant 0 Months
Allowance for improvement of the property $1.60 per sq. ft.
Length of the rental period 10 years
Resale Assumptions:
Terminal value cap rate 10%
Document Page
5
PROPERTY INVESTMENT AND RISK MANAGEMENT
Commission on resale value 2%
Valuation Assumptions:
Discount rate 8.00%
Information about the tenants and rent to be paid by them are contained in the table below:
Two tenants will share the property
Tena
nt 1
Tenant
2
Name of the tenants Abiga
il
Smith
David
Whatm
ore
Rental Rate/Sq. Ft. $120.
00
$120.00
Occupied Area in Square feet (tenants) 720 500
Term of rental agreement beginning from 01- 01-01-
Document Page
6
PROPERTY INVESTMENT AND RISK MANAGEMENT
01-19 19
Number of years in the agreement 10 10
Using the above information and data let us proceed towards calculation of discounted cash
inflows from the property, net present value of the property and internal rate of return (Cornell,
2016).
Discounted cash flow from the property:
Discounted cash flows from the property during the period between 2019 and 2024 are provided
in the table below:
Discounted cash inflow
projection
Years Year 1 Year 2 Year 3 Year 4 Year 5
Period ending on: Dec-19 Dec-20 Dec-21 Dec-22 Dec-23
Expected gross revenue from
rent
Revenue from rent $146,400 $152,256 $158,346 $164,680 $171,267
Less: Loss due to vacancy $0 $0 $0 $0 $0
Scheduled Base Rental $146,400 $152,256 $158,346 $164,680 $171,267
tabler-icon-diamond-filled.svg

Paraphrase This Document

Need a fresh take? Get an instant paraphrase of this document with our AI Paraphraser
Document Page
7
PROPERTY INVESTMENT AND RISK MANAGEMENT
Revenue
Reimbursed expenses $6,568 $6,746 $6,931 $7,124 $7,324
Total expected gross revenue $152,968 $159,002 $165,278 $171,804 $178,592
Operating Expenses
Reimbursable Expenses
Maintenance of the property 2,19
6.00
2,2
83.84
2,37
5.19
2,47
0.20
2,56
9.01
Property tax 1,20
0.00
1,2
00.00
1,20
0.00
1,20
0.00
1,20
0.00
Insurance premium on the
property
91
5.00
91
5.00
91
5.00
91
5.00
91
5.00
Utilities 1,95
2.00
2,0
30.08
2,11
1.28
2,19
5.73
2,28
3.56
Administrative expenses 30
5.00
31
7.20
32
9.89
34
3.08
35
6.81
Non-reimbursable Expenses
Document Page
8
PROPERTY INVESTMENT AND RISK MANAGEMENT
Management expenses 5,85
6.00
6,0
90.24
6,33
3.85
6,58
7.20
6,85
0.69
Total Operating Expenses 12,424
.00
12,83
6.36
13,265
.21
13,711
.22
14,175
.07
Operating income $140,544 $146,166 $152,012 $158,093 $164,417
Capital cost
Allowance for improvements $1,880 $1,955 $2,033 $2,115 $2,199
Total Capital Costs $1,880 $1,955 $2,033 $2,115 $2,199
Cash inflow after meeting all
expenditures
$138,664 $144,211 $149,979 $155,978 $162,217
PV factors @8% pa 0.925925
926
0.857338
82
0.793832
241
0.735029
853
0.680583
197
Document Page
9
PROPERTY INVESTMENT AND RISK MANAGEMENT
Discounted cash inflow (Net) $128,392.
59
$123,637
.31
$119,058.
15
$114,648.
59
$110,402.
35
Discounted cash flows from the property during the period between 2025 and 2029 are provided
in the table below:
Discounted cash inflow
projection
Years Year 6 Year 7 Year 8 Year 9 Year 10
Period ending on: Dec-24 Dec-25 Dec-26 Dec-27 Dec-28
Expected gross revenue from
rent
Revenue from rent $178,118 $185,243 $192,652 $200,359 $208,373
Less: Loss due to vacancy $0 $0 $0 $0 $0
Scheduled Base Rental
Revenue
$178,118 $185,243 $192,652 $200,359 $208,373
Reimbursed expenses $7,533 $7,749 $7,975 $8,209 $8,453
tabler-icon-diamond-filled.svg

Secure Best Marks with AI Grader

Need help grading? Try our AI Grader for instant feedback on your assignments.
Document Page
10
PROPERTY INVESTMENT AND RISK MANAGEMENT
Total expected gross revenue $185,651 $192,992 $200,627 $208,568 $216,826
Operating Expenses
Reimbursable Expenses
Maintenance of the property 2,67
1.77
2,77
8.64
2,88
9.79
3,005.
38
3,125.
59
Property tax 1,20
0.00
1,20
0.00
1,20
0.00
1,200.
00
1,200.
00
Insurance premium on the
property
91
5.00
91
5.00
91
5.00
915.
00
915.
00
Utilities 2,37
4.91
2,46
9.90
2,56
8.70
2,671.
45
2,778.
30
Administrative expenses 37
1.08
38
5.92
40
1.36
417.
41
434.
11
Non-reimbursable Expenses
Management expenses 7,12
4.72
7,40
9.71
7,70
6.10
8,014.
34
8,334.
91
Total Operating Expenses 14,657 15,159 15,680 16,223. 16,787.
Document Page
11
PROPERTY INVESTMENT AND RISK MANAGEMENT
.47 .17 .94 58 92
Operating income $170,993 $177,833 $184,946 $192,344 $200,038
Capital cost
Allowance for improvements $2,287 $2,379 $2,474 $2,573 $2,676
Total Capital Costs $2,287 $2,379 $2,474 $2,573 $2,676
Cash inflow after meeting all
expenditures
$168,706 $175,454 $182,472 $189,771 $197,362
PV factors @8% pa 0.630169
627
0.583490
395
0.540268
885
0.500248
967
0.463193
488
Discounted cash inflow (Net) $106,313.
37
$102,375.
84
$98,584.1
4
$94,932.8
8
$91,416.8
4
Document Page
12
PROPERTY INVESTMENT AND RISK MANAGEMENT
Tenancy schedule and outgoing schedule:
Tenancy schedule of tenant 1:
Tenancy schedule between year 1 and year 5:
Years Year 1 Year 2 Year 3 Year 4 Year 5
Period ending on Dec-
19
Dec-
20
Dec-21 Dec-22 Dec-23
Revenue from rent $86,40
0
$89,85
6
$93,450 $97,188 $101,076
Less: Loss due to vacancy $0 $0 $0 $0 $0
Scheduled Base Rental Revenue $86,40
0
$89,85
6
$93,450 $97,188 $101,076
Reimbursed expenses $3,876 $3,981 $4,091 $4,204 $4,323
Total expected gross revenue $90,27
6
$93,83
7
$97,541 $101,393 $105,398
Capital cost of improvement
Allowance for improvements 1080 1123.2 1168.12 1214.8531 1263.4472
tabler-icon-diamond-filled.svg

Paraphrase This Document

Need a fresh take? Get an instant paraphrase of this document with our AI Paraphraser
Document Page
13
PROPERTY INVESTMENT AND RISK MANAGEMENT
8 2 45
Total expected cash inflows (net) $89,19
6
$92,71
4
$96,373 $100,178 $104,135
Tenancy schedule between year 6 and year 10:
Tenant #1
Years Year 6 Year 7 Year 8 Year 9 Year 10
Period ending on Dec-24 Dec-25 Dec-26 Dec-27 Dec-28
Revenue from rent $105,119 $109,324 $113,697 $118,244 $122,974
Less: Loss due to vacancy $0 $0 $0 $0 $0
Scheduled Base Rental
Revenue
$105,119 $109,324 $113,697 $118,244 $122,974
Reimbursed expenses $4,446 $4,573 $4,706 $4,706 $4,706
Total expected gross
revenue
$109,564 $113,897 $118,403 $122,951 $127,681
Document Page
14
PROPERTY INVESTMENT AND RISK MANAGEMENT
Capital cost of
improvement
Allowance for
improvements
1313.9851
35
1366.5445
4
1421.2063
22
1478.0545
74
1537.1767
57
Total expected cash
inflows (net)
$108,250 $112,530 $116,982 $121,473 $126,143
Tenancy schedule for tenant 2:
Tenancy schedule between year 1 and year 5:
Tenant #2
Years Year 1 Year 2 Year 3 Year 4 Year 5
Period ending on Dec-19 Dec-20 Dec-21 Dec-22 Dec-23
Revenue from rent $60,000 $62,400 $64,896 $67,492 $70,192
Less: Loss due to vacancy $0 $0 $0 $0 $0
Scheduled Base Rental
Revenue
$60,000 $62,400 $64,896 $67,492 $70,192
Reimbursed expenses $2,692 $2,765 $2,841 $2,920 $3,002
Document Page
15
PROPERTY INVESTMENT AND RISK MANAGEMENT
Total expected gross revenue $62,692 $65,165 $67,737 $70,412 $73,193
Capital cost of improvement
Allowance for improvements $800.00 $832.00 $865.28 $899.89 $935.89
Total expected cash inflows
(net)
$61,892 $64,333 $66,871 $69,512 $72,257
Tenancy schedule between year 6 and year 10:
Tenant #2
Years Year 6 Year 7 Year 8 Year 9 Year 10
Period ending on Dec-24 Dec-25 Dec-26 Dec-27 Dec-28
Revenue from rent $72,999 $75,919 $78,956 $82,114 $85,399
Less: Loss due to vacancy $0 $0 $0 $0 $0
Scheduled Base Rental
Revenue
$72,999 $75,919 $78,956 $82,114 $85,399
tabler-icon-diamond-filled.svg

Secure Best Marks with AI Grader

Need help grading? Try our AI Grader for instant feedback on your assignments.
Document Page
16
PROPERTY INVESTMENT AND RISK MANAGEMENT
Reimbursed expenses $3,087 $3,176 $3,268 $3,268 $3,268
Total expected gross revenue $76,086 $79,095 $82,224 $85,383 $88,667
Capital cost of improvement
Allowance for improvements $973.32 $1,012.26 $1,052.7
5
$1,094.8
6
$1,138.65
Total expected cash inflows
(net)
$75,113 $78,083 $81,172 $84,288 $87,528
Outgoing schedule:
Outgoing schedule between year 1 and year 5 is provided in the table below:
Expenses Tenant #1
Years Year 1 Year 2 Year 3 Year 4 Year 5
Period ending on: Dec-19 Dec-20 Dec-21 Dec-22 Dec-23
Expenses to be
reimbursed:
Document Page
17
PROPERTY INVESTMENT AND RISK MANAGEMENT
Maintenance of the
property
$1,296 $1,348 $1,402 $1,458 $1,516
Property tax (Fixed) $708 $708 $708 $708 $708
Insurance premium on the
property (Fixed)
$540 $540 $540 $540 $540
Utilities $1,152 $1,198 $1,246 $1,296 $1,348
Administrative expenses $180 $187 $195 $202 $211
Revenue from
Reimbursement
$3,876 $3,981 $4,091 $4,204 $4,323
Expenses Tenant #2
Years Year 1 Year 2 Year 3 Year 4 Year 5
Period ending on: Dec-19 Dec-20 Dec-21 Dec-22 Dec-23
Expenses to be
reimbursed:
Document Page
18
PROPERTY INVESTMENT AND RISK MANAGEMENT
Maintenance of the
property
$900 $936.00 $973.44 $1,012.3
8
$1,052.87
Property tax (Fixed) 491.
80
491.8
0
491.8
0
491.8
0
491.80
Insurance premium on the
property (Fixed)
375.
00
375.0
0
375.0
0
375.0
0
375.00
Utilities 800.
00
$832.00 $865.28 $899.89 $935.89
Administrative expenses 125.
00
$130.00 $135.20 $140.61 $146.23
Revenue from
Reimbursement
$2,692 $2,765 $2,841 $2,920 $3,002
Reimbursement Revenue in total
from tenants
$6,568 $6,746 $6,931 $7,124 $7,324
Expenses to be borne by the property owner
Management expenses $5,856 $6,090.2 $6,333.8 $6,587.2 $6,850.69
tabler-icon-diamond-filled.svg

Paraphrase This Document

Need a fresh take? Get an instant paraphrase of this document with our AI Paraphraser
Document Page
19
PROPERTY INVESTMENT AND RISK MANAGEMENT
4 5 0
Outgoing schedule between year 6 and year 10 is provided in the table below:
Expenses Tenant #1
Years Year 6 Year 7 Year 8 Year 9 Year 10
Period ending on: Dec-24 Dec-25 Dec-26 Dec-27 Dec-28
Expenses to be reimbursed:
Maintenance of the property $1,577 $1,640 $1,705 $1,774 $1,845
Property tax (Fixed) $708 $708 $708 $708 $708
Insurance premium on the
property (Fixed)
$540 $540 $540 $540 $540
Utilities $1,402 $1,458 $1,516 $1,577 $1,640
Administrative expenses $219 $228 $237 $246 $256
Revenue from Reimbursement $4,446 $4,573 $4,706 $4,845 $4,989
Document Page
20
PROPERTY INVESTMENT AND RISK MANAGEMENT
Expenses Tenant #2
Years Year 6 Year 7 Year 8 Year 9 Year 10
Period ending on: Dec-24 Dec-25 Dec-26 Dec-27 Dec-28
Expenses to be reimbursed:
Maintenance of the property $1,094.99 $1,138.7
9
$1,184.34 $1,231.7
1
$1,280.98
Property tax (Fixed) 491.8
0
491.8
0
491.8
0
491.8
0
491.8
0
Insurance premium on the
property (Fixed)
375.0
0
375.0
0
375.0
0
375.0
0
375.0
0
Utilities $973.32 $1,012.2
6
$1,052.75 $1,094.8
6
$1,138.65
Administrative expenses $152.08 $158.16 $164.49 $171.07 $177.91
Revenue from Reimbursement $3,087 $3,176 $3,268 $3,364 $3,464
Document Page
21
PROPERTY INVESTMENT AND RISK MANAGEMENT
Reimbursement Revenue in total from
tenants
$7,533 $7,749 $7,975 $8,209 $8,453
Discount rate:
Discount rate is the rate used to discount the cash flows in the future to consider the time value
factor in investment analysis. Investment appraisal technique NPV method requires an
appropriate rate of discount to incorporate the time value factor in the future receivables to
correctly appraise an investment proposal correctly. In this case the rate of discount has been
assumed to be 8% per annum (Fisher and Wassmer, 2015).
Terminal yield:
To calculate the terminal value of the property it has been assumed that after the end of 10 years
period the property will have a market cap rate of 10%. Thus, terminal value of the property shall
be calculated by considering the terminal cap rate of 10%.
Asking price:
As per the available information about the property the asking price of the property has been
assumed to be $1,900,000, i.e. the price paid to acquire the property (Holland, 2018).
Outgoing growth rate and CPI:
The annual general inflation rate is 4% per annum is the factor to be used for growth of annual
revenue and for the purpose of CPI to recalculate variable expenses in relation to the operating
expenses of the property (Johnsen, 2015).
tabler-icon-diamond-filled.svg

Secure Best Marks with AI Grader

Need help grading? Try our AI Grader for instant feedback on your assignments.
Document Page
22
PROPERTY INVESTMENT AND RISK MANAGEMENT
Market rent:
Market rent as per the available information about the rental property in NSW has been assumed
to be $120 per square foot.
Net present value:
Net present value of the property as per the data and information provided at the beginning of the
document is calculated below (detailed workings are attached).
Calculation of expected Net Present Value
NPV calculation
Year Net cash
inflows
Present
value factor
@8% pa
Present value
of cash inflow
1 $138,664 $0.926
128,392.59
2 $144,211 $0.857
123,637.31
3 $149,979 $0.794
119,058.15
4 $155,978 $0.735
Document Page
23
PROPERTY INVESTMENT AND RISK MANAGEMENT
114,648.59
5 $162,217 $0.681
110,402.35
6 $168,706 $0.630
106,313.37
7 $175,454 $0.583
102,375.84
8 $182,472 $0.540
98,584.14
9 $189,771 $0.500
94,932.88
10 $197,362 $0.463
91,416.84
Total Cash Flow $1,664,815
1,089,762.06
Expected resale value of the property
(122348 / 14%)
$1,973,621.09
Less: Commission on resale value $39,472
Document Page
24
PROPERTY INVESTMENT AND RISK MANAGEMENT
Net Resale Cash Flow $1,934,149 $0.463
895,885.07
Present value of the property 1,98
5,647.13
Rounded to Thousands (use a formula) 1,98
5,652.37
Less: Property purchase value in 2011
(last time the property sold)
1,90
0,000.00
Net present value (NPV) 85,
652.37
NPV of the property is though positive but it is only $85,652.37 thus, despite the positive NPV it
does not enthuse enough confidence for the investor to go ahead with the investment proposal.
Workings:
tabler-icon-diamond-filled.svg

Paraphrase This Document

Need a fresh take? Get an instant paraphrase of this document with our AI Paraphraser
Document Page
25
PROPERTY INVESTMENT AND RISK MANAGEMENT
Revenue:
Years Year 1 Year 2 Year 3 Year 4 Year 5
Period ending on Dec-
19
Dec-
20
Dec-21 Dec-22 Dec-23
Revenue from rent $86,40
0
$89,85
6
$93,450 $97,188 $101,076
Less: Loss due to vacancy $0 $0 $0 $0 $0
Scheduled Base Rental Revenue $86,40
0
$89,85
6
$93,450 $97,188 $101,076
Reimbursed expenses $3,876 $3,981 $4,091 $4,204 $4,323
Total expected gross revenue $90,27
6
$93,83
7
$97,541 $101,393 $105,398
Capital cost of improvement
Allowance for improvements 1080 1123.2 1168.12
8
1214.8531
2
1263.4472
45
Total expected cash inflows (net) $89,19 $92,71 $96,373 $100,178 $104,135
Document Page
26
PROPERTY INVESTMENT AND RISK MANAGEMENT
6 4
Tenant #1
Years Year 6 Year 7 Year 8 Year 9 Year 10
Period ending on Dec-24 Dec-25 Dec-26 Dec-27 Dec-28
Revenue from rent $105,119 $109,324 $113,697 $118,244 $122,974
Less: Loss due to vacancy $0 $0 $0 $0 $0
Scheduled Base Rental
Revenue
$105,119 $109,324 $113,697 $118,244 $122,974
Reimbursed expenses $4,446 $4,573 $4,706 $4,706 $4,706
Total expected gross
revenue
$109,564 $113,897 $118,403 $122,951 $127,681
Capital cost of
improvement
Allowance for 1313.9851 1366.5445 1421.2063 1478.0545 1537.1767
Document Page
27
PROPERTY INVESTMENT AND RISK MANAGEMENT
improvements 35 4 22 74 57
Total expected cash
inflows (net)
$108,250 $112,530 $116,982 $121,473 $126,143
Tenant #2
Years Year 1 Year 2 Year 3 Year 4 Year 5
Period ending on Dec-19 Dec-20 Dec-21 Dec-22 Dec-23
Revenue from rent $60,000 $62,400 $64,896 $67,492 $70,192
Less: Loss due to vacancy $0 $0 $0 $0 $0
Scheduled Base Rental
Revenue
$60,000 $62,400 $64,896 $67,492 $70,192
Reimbursed expenses $2,692 $2,765 $2,841 $2,920 $3,002
Total expected gross revenue $62,692 $65,165 $67,737 $70,412 $73,193
Capital cost of improvement
tabler-icon-diamond-filled.svg

Secure Best Marks with AI Grader

Need help grading? Try our AI Grader for instant feedback on your assignments.
Document Page
28
PROPERTY INVESTMENT AND RISK MANAGEMENT
Allowance for improvements $800.00 $832.00 $865.28 $899.89 $935.89
Total expected cash inflows
(net)
$61,892 $64,333 $66,871 $69,512 $72,257
Tenant #2
Years Year 6 Year 7 Year 8 Year 9 Year 10
Period ending on Dec-24 Dec-25 Dec-26 Dec-27 Dec-28
Revenue from rent $72,999 $75,919 $78,956 $82,114 $85,399
Less: Loss due to vacancy $0 $0 $0 $0 $0
Scheduled Base Rental
Revenue
$72,999 $75,919 $78,956 $82,114 $85,399
Reimbursed expenses $3,087 $3,176 $3,268 $3,268 $3,268
Total expected gross revenue $76,086 $79,095 $82,224 $85,383 $88,667
Capital cost of improvement
Allowance for improvements $973.32 $1,012.26 $1,052.7 $1,094.8 $1,138.65
Document Page
29
PROPERTY INVESTMENT AND RISK MANAGEMENT
5 6
Total expected cash inflows
(net)
$75,113 $78,083 $81,172 $84,288 $87,528
Expenses:
Expenses Tenant #1
Years Year 1 Year 2 Year 3 Year 4 Year 5
Period ending on: Dec-19 Dec-20 Dec-21 Dec-22 Dec-23
Expenses to be
reimbursed:
Maintenance of the
property
$1,296 $1,348 $1,402 $1,458 $1,516
Property tax (Fixed) $708 $708 $708 $708 $708
Insurance premium on the
property (Fixed)
$540 $540 $540 $540 $540
Utilities $1,152 $1,198 $1,246 $1,296 $1,348
Document Page
30
PROPERTY INVESTMENT AND RISK MANAGEMENT
Administrative expenses $180 $187 $195 $202 $211
Revenue from
Reimbursement
$3,876 $3,981 $4,091 $4,204 $4,323
Expenses Tenant #2
Years Year 1 Year 2 Year 3 Year 4 Year 5
Period ending on: Dec-19 Dec-20 Dec-21 Dec-22 Dec-23
Expenses to be
reimbursed:
Maintenance of the
property
$900 $936.00 $973.44 $1,012.3
8
$1,052.8
7
Property tax (Fixed) 491.
80
491.8
0
491.8
0
491.8
0
491.8
0
Insurance premium on the
property (Fixed)
375.
00
375.0
0
375.0
0
375.0
0
375.0
0
Utilities 800. $832.00 $865.28 $899.89 $935.89
tabler-icon-diamond-filled.svg

Paraphrase This Document

Need a fresh take? Get an instant paraphrase of this document with our AI Paraphraser
Document Page
31
PROPERTY INVESTMENT AND RISK MANAGEMENT
00
Administrative expenses 125.
00
$130.00 $135.20 $140.61 $146.23
Revenue from
Reimbursement
$2,692 $2,765 $2,841 $2,920 $3,002
Reimbursement Revenue in total
from tenants
$6,568 $6,746 $6,931 $7,124 $7,324
Expenses to be borne by the property owner
Management expenses $5,856 $6,090.2
4
$6,333.8
5
$6,587.2
0
$6,850.6
9
Expenses Tenant #1
Years Year 6 Year 7 Year 8 Year 9 Year 10
Period ending on: Dec-24 Dec-25 Dec-26 Dec-27 Dec-28
Document Page
32
PROPERTY INVESTMENT AND RISK MANAGEMENT
Expenses to be reimbursed:
Maintenance of the property $1,577 $1,640 $1,705 $1,774 $1,845
Property tax (Fixed) $708 $708 $708 $708 $708
Insurance premium on the
property (Fixed)
$540 $540 $540 $540 $540
Utilities $1,402 $1,458 $1,516 $1,577 $1,640
Administrative expenses $219 $228 $237 $246 $256
Revenue from Reimbursement $4,446 $4,573 $4,706 $4,845 $4,989
Expenses Tenant #2
Years Year 6 Year 7 Year 8 Year 9 Year 10
Period ending on: Dec-24 Dec-25 Dec-26 Dec-27 Dec-28
Expenses to be reimbursed:
Maintenance of the property $1,094.99 $1,138.7 $1,184.34 $1,231.7 $1,280.98
Document Page
33
PROPERTY INVESTMENT AND RISK MANAGEMENT
9 1
Property tax (Fixed) 491.8
0
491.8
0
491.8
0
491.8
0
491.8
0
Insurance premium on the
property (Fixed)
375.0
0
375.0
0
375.0
0
375.0
0
375.0
0
Utilities $973.32 $1,012.2
6
$1,052.75 $1,094.8
6
$1,138.65
Administrative expenses $152.08 $158.16 $164.49 $171.07 $177.91
Revenue from Reimbursement $3,087 $3,176 $3,268 $3,364 $3,464
Reimbursement Revenue in total from
tenants
$7,533 $7,749 $7,975 $8,209 $8,453
Internal rate of return:
IRR is calculated by using the following formula:
tabler-icon-diamond-filled.svg

Secure Best Marks with AI Grader

Need help grading? Try our AI Grader for instant feedback on your assignments.
Document Page
34
PROPERTY INVESTMENT AND RISK MANAGEMENT
IRR of the property is calculate below.
Calculation of IRR
Year Annual net cash inflows ($)
0 (1,900,000.00)
1 138,664.00
2 144,210.56
3 149,978.98
4 155,978.14
5 162,217.27
6 168,705.96
7 175,454.20
8 182,472.36
9 189,771.26
Document Page
35
PROPERTY INVESTMENT AND RISK MANAGEMENT
10 197,362.11
IRR -2.21%
Thus, IRR of the property is negative at (2.21%). This is a clear indication that the property is
not financially beneficial for the investor if it is rented as per the current terms and conditions as
enumerated in table 1 at the beginning of this document (Mardawiyah Daryanto, Primadona
and ., 2018).
Impact of leverage, risk and taxation on investment potential:
Scenario analysis:
Instead of $120 per sq. ft. if the property would have commanded an annual rent of $150 per sq.
ft. then the NPV and IRR would have been as following:
NPV calculation
Year Net cash
inflows
Present
value
factor
@8% pa
Present value
of cash
inflow
1 $173,800 $0.926
Document Page
36
PROPERTY INVESTMENT AND RISK MANAGEMENT
160,925.93
2 $180,752 $0.857
154,965.71
3 $187,982 $0.794
149,226.24
4 $195,501 $0.735
143,699.34
5 $203,321 $0.681
138,377.14
6 $211,454 $0.630
133,252.06
7 $219,912 $0.583
128,316.80
8 $228,709 $0.540
123,564.33
9 $237,857 $0.500
118,987.87
10 $247,372 $0.463
114,580.91
tabler-icon-diamond-filled.svg

Paraphrase This Document

Need a fresh take? Get an instant paraphrase of this document with our AI Paraphraser
Document Page
37
PROPERTY INVESTMENT AND RISK MANAGEMENT
Total Cash Flow $2,086,661
1,365,896.31
Expected resale value of the property (122348 /
14%)
$2,473,715.93
Less: Commission on resale value $49,474
Net Resale Cash Flow $2,424,242 $0.463
1,122,892.93
Present value of the property 2,4
88,789.24
Rounded to Thousands (use a formula) 2,4
88,794.48
Less: Property purchase value in 2011 (last time the
property sold)
1,9
00,000.00
Net present value (NPV) 588
,794.48
Document Page
38
PROPERTY INVESTMENT AND RISK MANAGEMENT
NPV of the property is $588,794.48 (Srithongrung, 2017).
IRR:
Calculation of IRR
Year Annual net
cash inflows
($)
0
(1,900,000.00)
1
173,800.00
2
180,752.00
3
187,982.08
4
195,501.36
5
203,321.42
6
Document Page
39
PROPERTY INVESTMENT AND RISK MANAGEMENT
211,454.27
7
219,912.45
8
228,708.94
9
237,857.30
10
247,371.59
IRR 1.64%
IRR of the property is 1.64% (Pagano, 2017).
Taxation impact:
In case tax is charged at the rate of 20% on operating income then the NPV will be as following:
NPV
Year Net cash inflows Present value
factor @8%
pa
Present value of
cash inflow
1 $110,555 $0.926
tabler-icon-diamond-filled.svg

Secure Best Marks with AI Grader

Need help grading? Try our AI Grader for instant feedback on your assignments.
Document Page
40
PROPERTY INVESTMENT AND RISK MANAGEMENT
102,365.93
2 $114,977 $0.857
98,574.60
3 $119,577 $0.794
94,923.68
4 $124,360 $0.735
91,407.99
5 $129,334 $0.681
88,022.51
6 $134,507 $0.630
84,762.42
7 $139,888 $0.583
81,623.07
8 $145,483 $0.540
78,599.99
9 $151,302 $0.500
75,688.88
10 $157,355 $0.463
72,885.59
Document Page
41
PROPERTY INVESTMENT AND RISK MANAGEMENT
Total Cash Flow $1,327,338
868,854.66
Expected resale value of the property
(122348 / 14%)
$1,573,545.22
Less: Commission on resale value $31,471
Net Resale Cash Flow $1,542,074 $0.463
714,278.78
Present value of the property 1,583,13
3.44
Rounded to Thousands (use a formula) 1,583,13
8.68
Less: Property purchase value in 2011 (last
time the property sold)
1,900,00
0.00
Net present value (NPV) (316,861.
32)
Document Page
42
PROPERTY INVESTMENT AND RISK MANAGEMENT
NPV is ($316,861.32) (Mukherjee and Scott, 2017).
IRR:
With taxation the IRR will be as following:
Calculation of IRR
Year Annual net
cash inflows
($)
0
(1,900,000.00)
1
110,555.20
2
114,977.41
3
119,576.50
4
124,359.56
5
129,333.95
tabler-icon-diamond-filled.svg

Paraphrase This Document

Need a fresh take? Get an instant paraphrase of this document with our AI Paraphraser
Document Page
43
PROPERTY INVESTMENT AND RISK MANAGEMENT
6
134,507.30
7
139,887.60
8
145,483.10
9
151,302.43
10
157,354.52
IRR -5.74%
IRR of the property is (5.74%) (MERRIFIELD and MONSON, 2017).
Conclusion:
As per the existing terms and conditions of the rental agreement with two tenants who are
expected to share the property between themselves the NPV of the property is $85,652.37 which
is though positive but not very encouraging considering the tenancy agreement is for 10 years.
IRR of the project which is negative at (2.21%) making it further clear that the property if rented
will not be beneficial for the owner of the property. In fact the above NPV and IRR both were
without considering tax implications at the beginning. Later when the taxation implication has
Document Page
44
PROPERTY INVESTMENT AND RISK MANAGEMENT
been considered NPV of the property end up in negative as can be seen in the scenario analysis.
IRR was also further dipped in negative to (5.74%) (Beranek, 2017).
Recommendation:
Considering the above analysis the investor would be recommended to not enter into tenancy
agreement with the existing terms and conditions as it is financially not viable option for the
property owner (Bagire and Namada, 2017).
Document Page
45
PROPERTY INVESTMENT AND RISK MANAGEMENT
References:
Bagire, V. and Namada, J. (2017). Managerial Skills, Financial Capability and Strategic Planning
in Organizations. American Journal of Industrial and Business Management, 03(05), pp.480-
487.
Beranek, W. (2017). Some New Capital Budgeting Theorems. The Journal of Financial and
Quantitative Analysis, 15(6), p.809.
Bird, P. and Hunt, P. (2017). Financial Analysis in Capital Budgeting. Economica, 35(133),
p.483.
Calabrese, T. (2017). Testing Competing Capital Structure Theories of Nonprofit
Organizations. Public Budgeting & Finance, 33(5), pp.119-143.
Cornell, B. (2016). Capital Budgeting: A 'General Equilibrium' Analysis. SSRN Electronic
Journal, 2(2), pp.13-234.
Fisher, R. and Wassmer, R. (2015). An Analysis of State-Local Government Capital Expenditure
During the 2000s. Public Budgeting & Finance, 35(1), pp.3-28.
Holland, J. (2018). CAPITAL BUDGETING FOR INTERNATIONAL BUSINESS: A
FRAMEWORK FOR ANALYSIS. Managerial Finance, 18(4), pp.1-6.
Johnsen, Å. (2015). Strategic Management Thinking and Practice in the Public Sector: A
Strategic Planning for All Seasons?. Financial Accountability & Management, 31(3), pp.243-
268.
tabler-icon-diamond-filled.svg

Secure Best Marks with AI Grader

Need help grading? Try our AI Grader for instant feedback on your assignments.
Document Page
46
PROPERTY INVESTMENT AND RISK MANAGEMENT
Mardawiyah Daryanto, W., Primadona, A. and ., .. (2018). Capital Budgeting Model and
Sensitivity Analysis of the Conventional Oil Production Sharing Contract (PSC) Fiscal Systems:
Empirical Evidence from Indonesia. International Journal of Engineering & Technology,
7(3.21), p.5.
Merrifield, J. and Monson, D. (2017). Simulation of a Constitutional Spending Limit for a
Conservative State: With Dynamic Adjustment and Sensitivity Analysis. Public Budgeting &
Finance, 33(4), pp.1-25.
Mukherjee, T. and Scott, D. (2017). THE CAPITAL BUDGETING PROCESS OF LARGE
FIRMS: AN ANALYSIS OF CAPITAL BUDGETING MANUALS. The Financial Review,
32(5), pp.92-92.
Pagano, M. (2017). Notes on Capital Budgeting. Public Budgeting & Finance, 6(4), pp.31-40.
Srithongrung, A. (2017). Capital Budgeting and Management Practices: Smoothing Out Rough
Spots in Government Outlays. Public Budgeting & Finance, 38(1), pp.47-71.
Wang, W. and Wu, Y. (2018). Why Are We Lagging Behind? An Empirical Analysis of
Municipal Capital Spending in the United States. Public Budgeting & Finance, 38(3), pp.76-91.
chevron_up_icon
1 out of 47
circle_padding
hide_on_mobile
zoom_out_icon
logo.png

Your All-in-One AI-Powered Toolkit for Academic Success.

Available 24*7 on WhatsApp / Email

[object Object]