In-depth Property Market Research and Analysis of Mascot, NSW
VerifiedAdded on  2023/06/11
|16
|2198
|329
Report
AI Summary
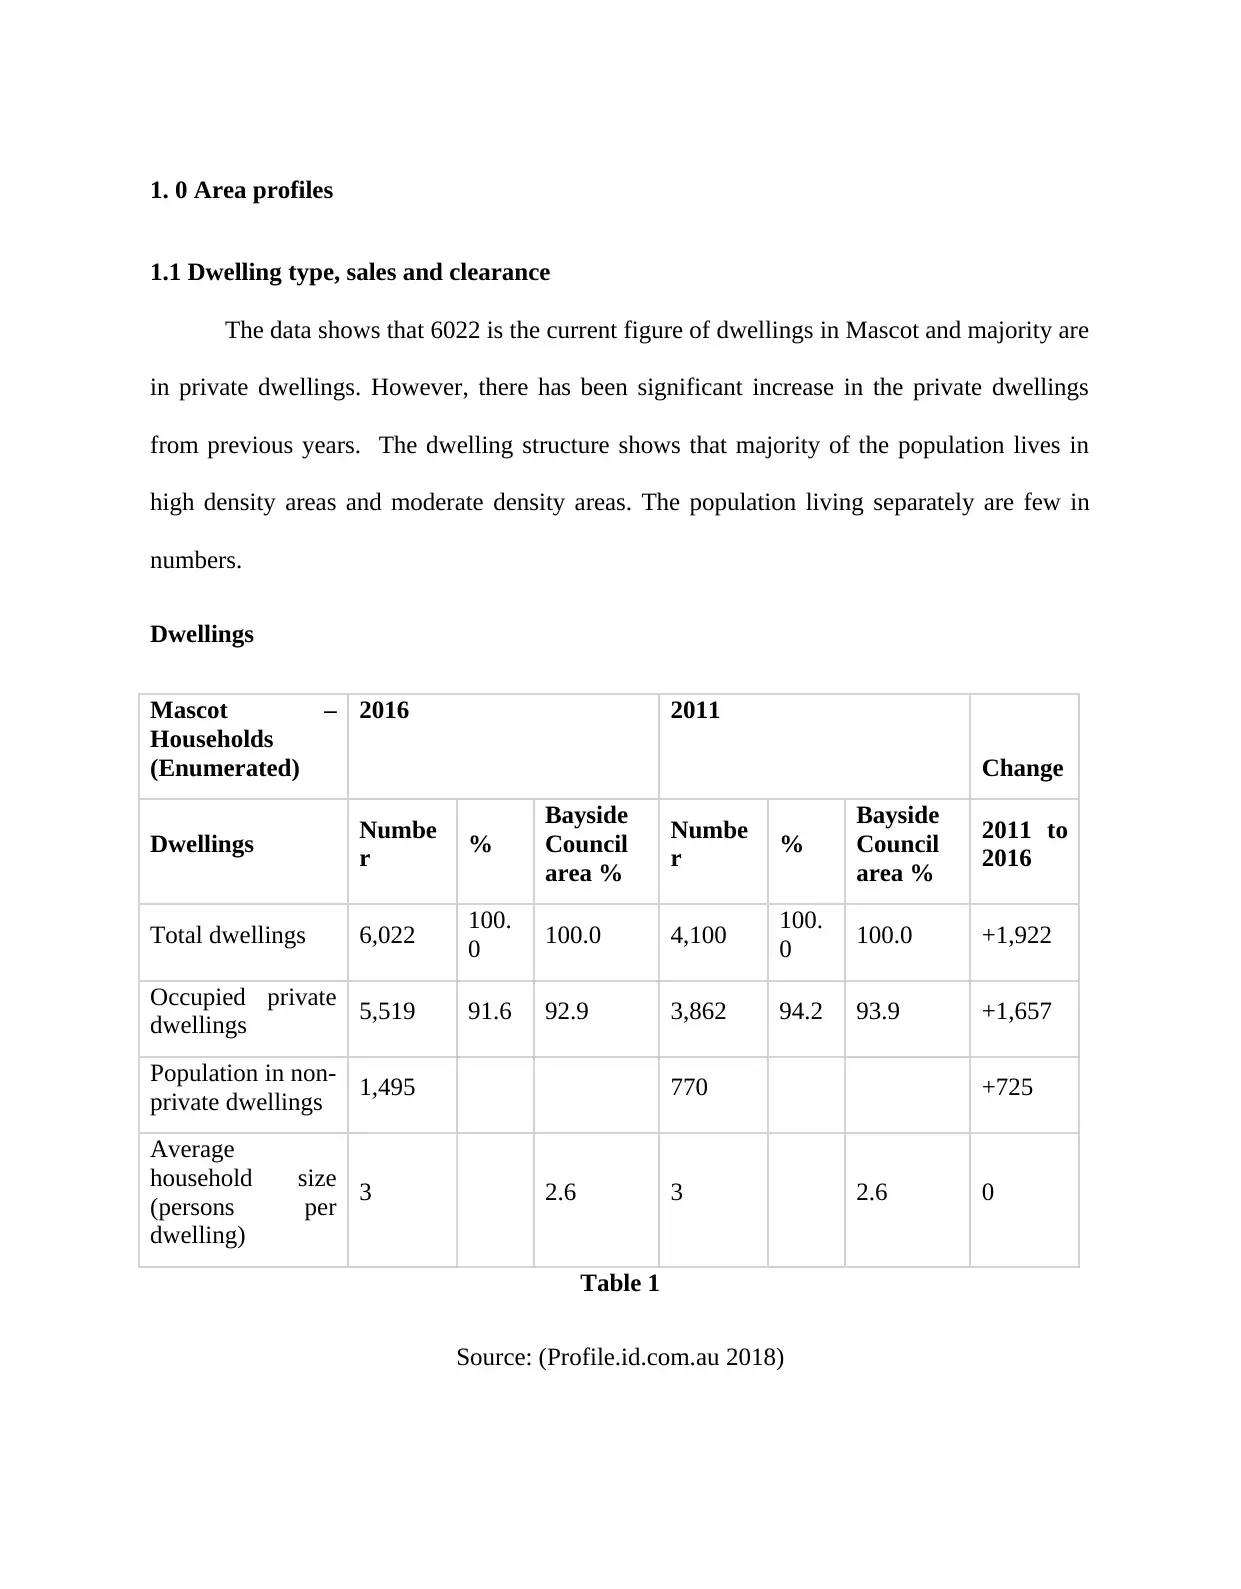
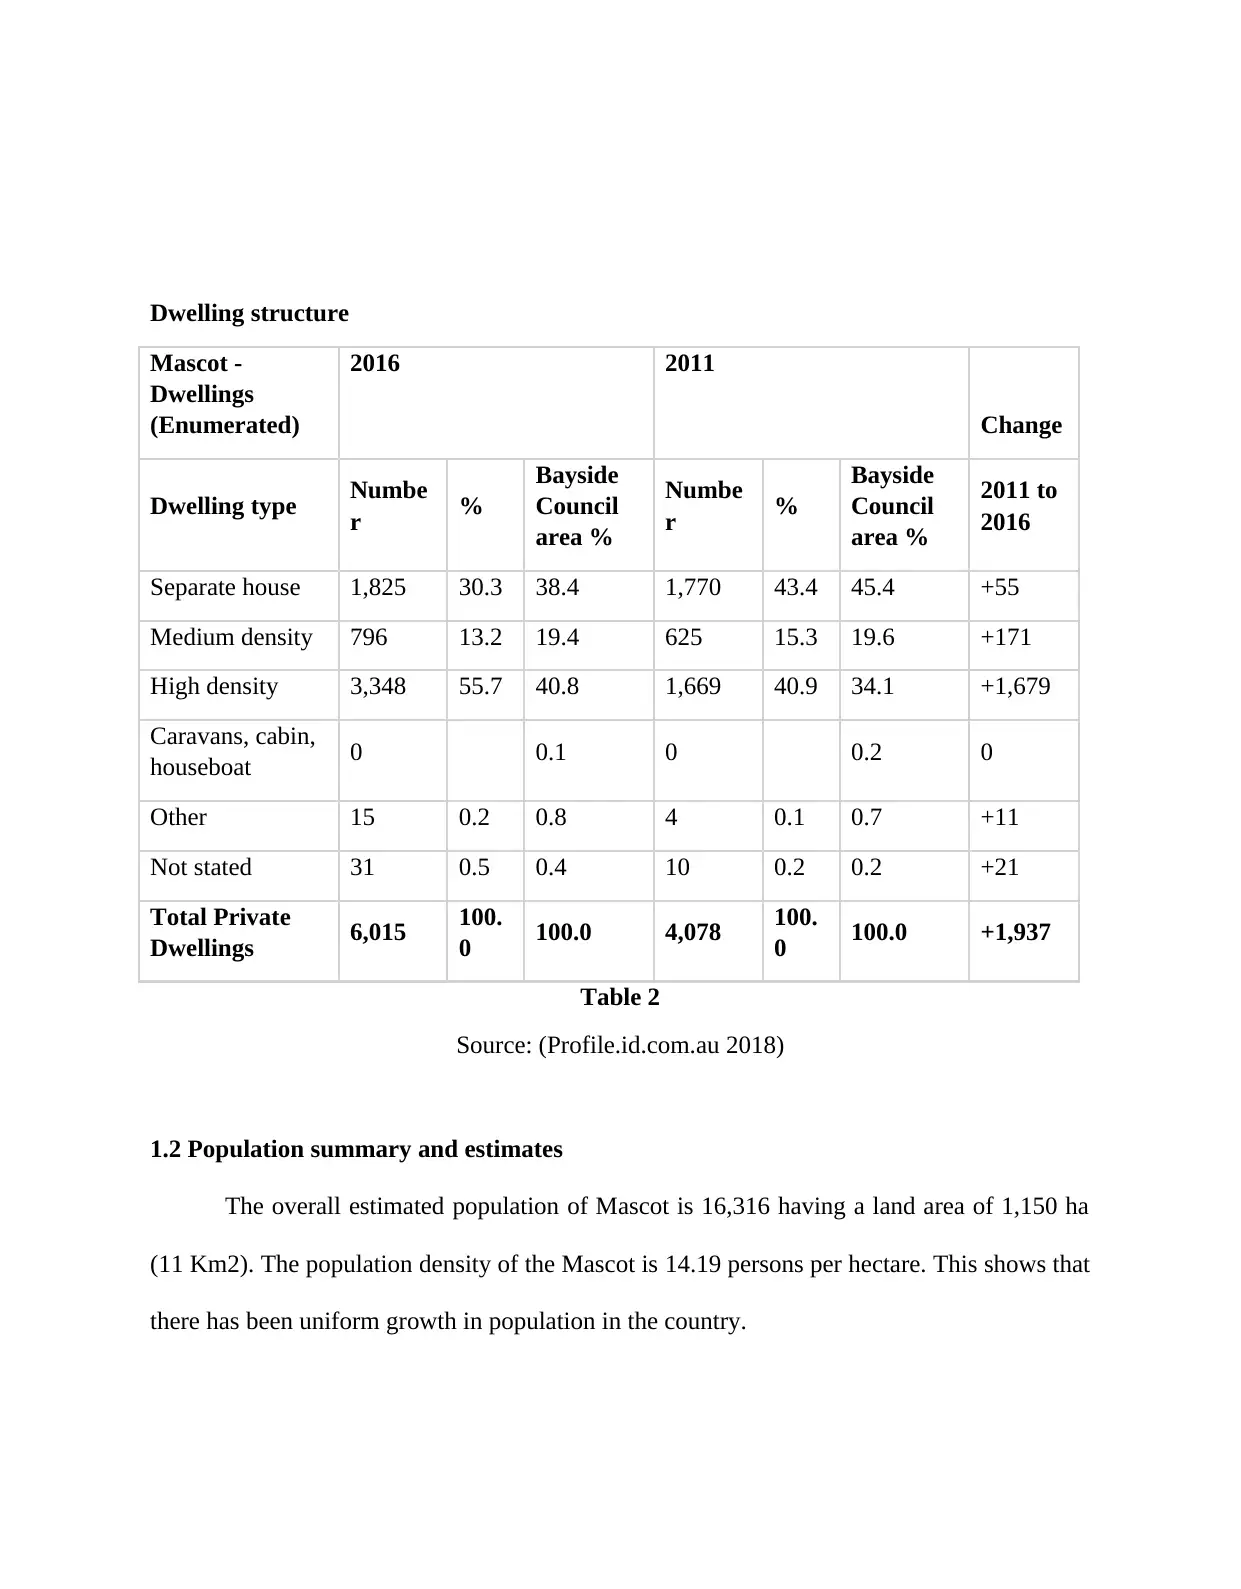
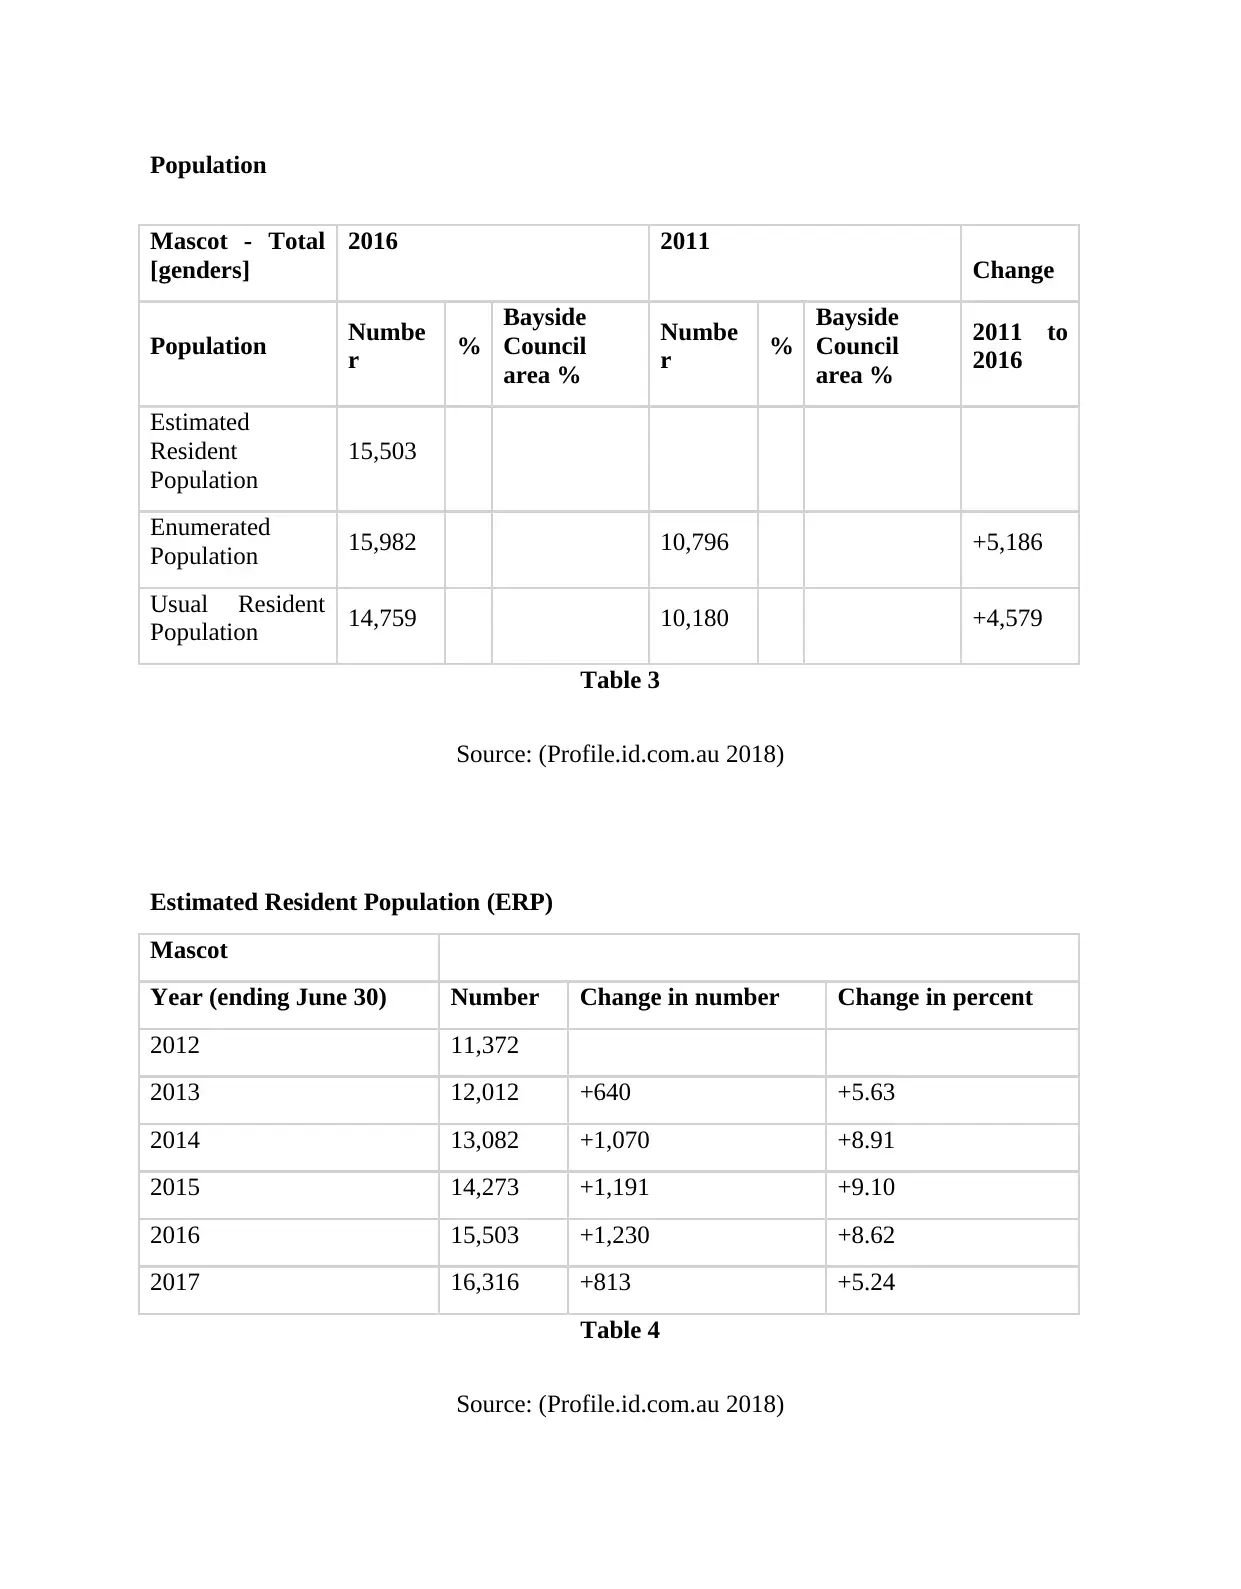
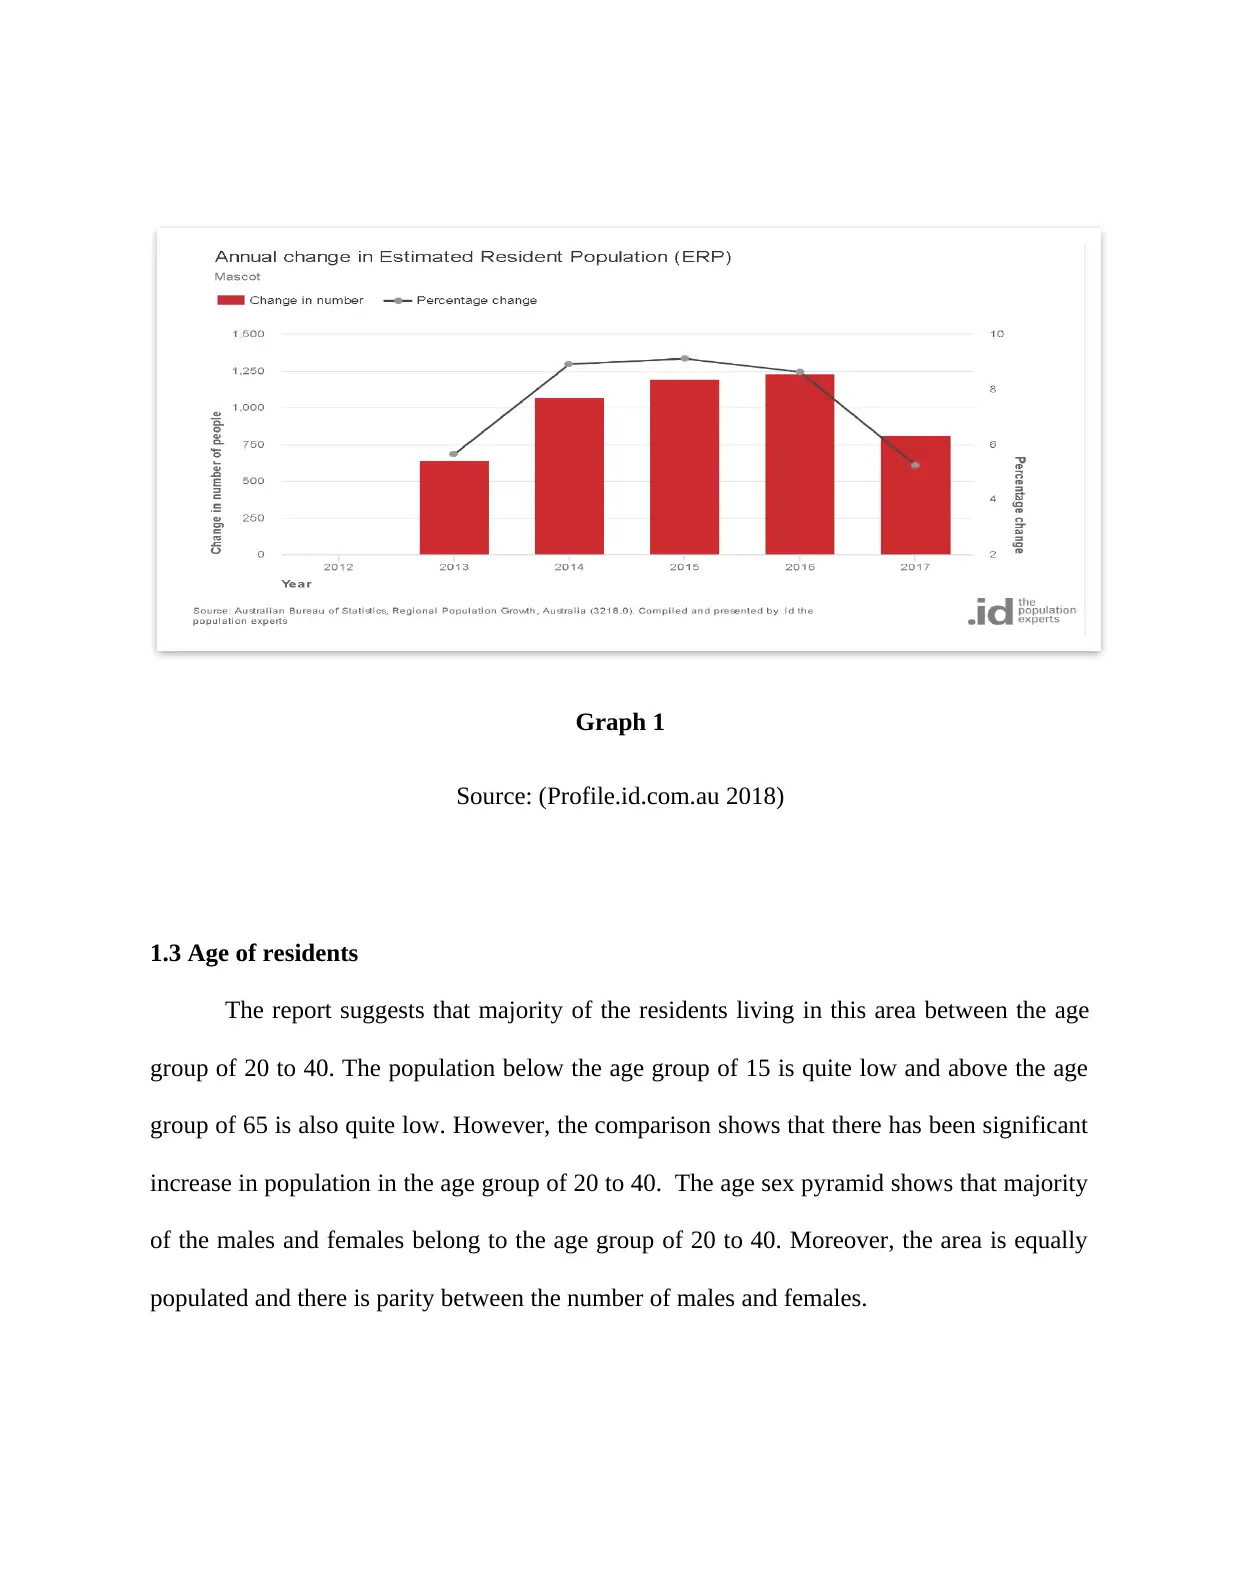
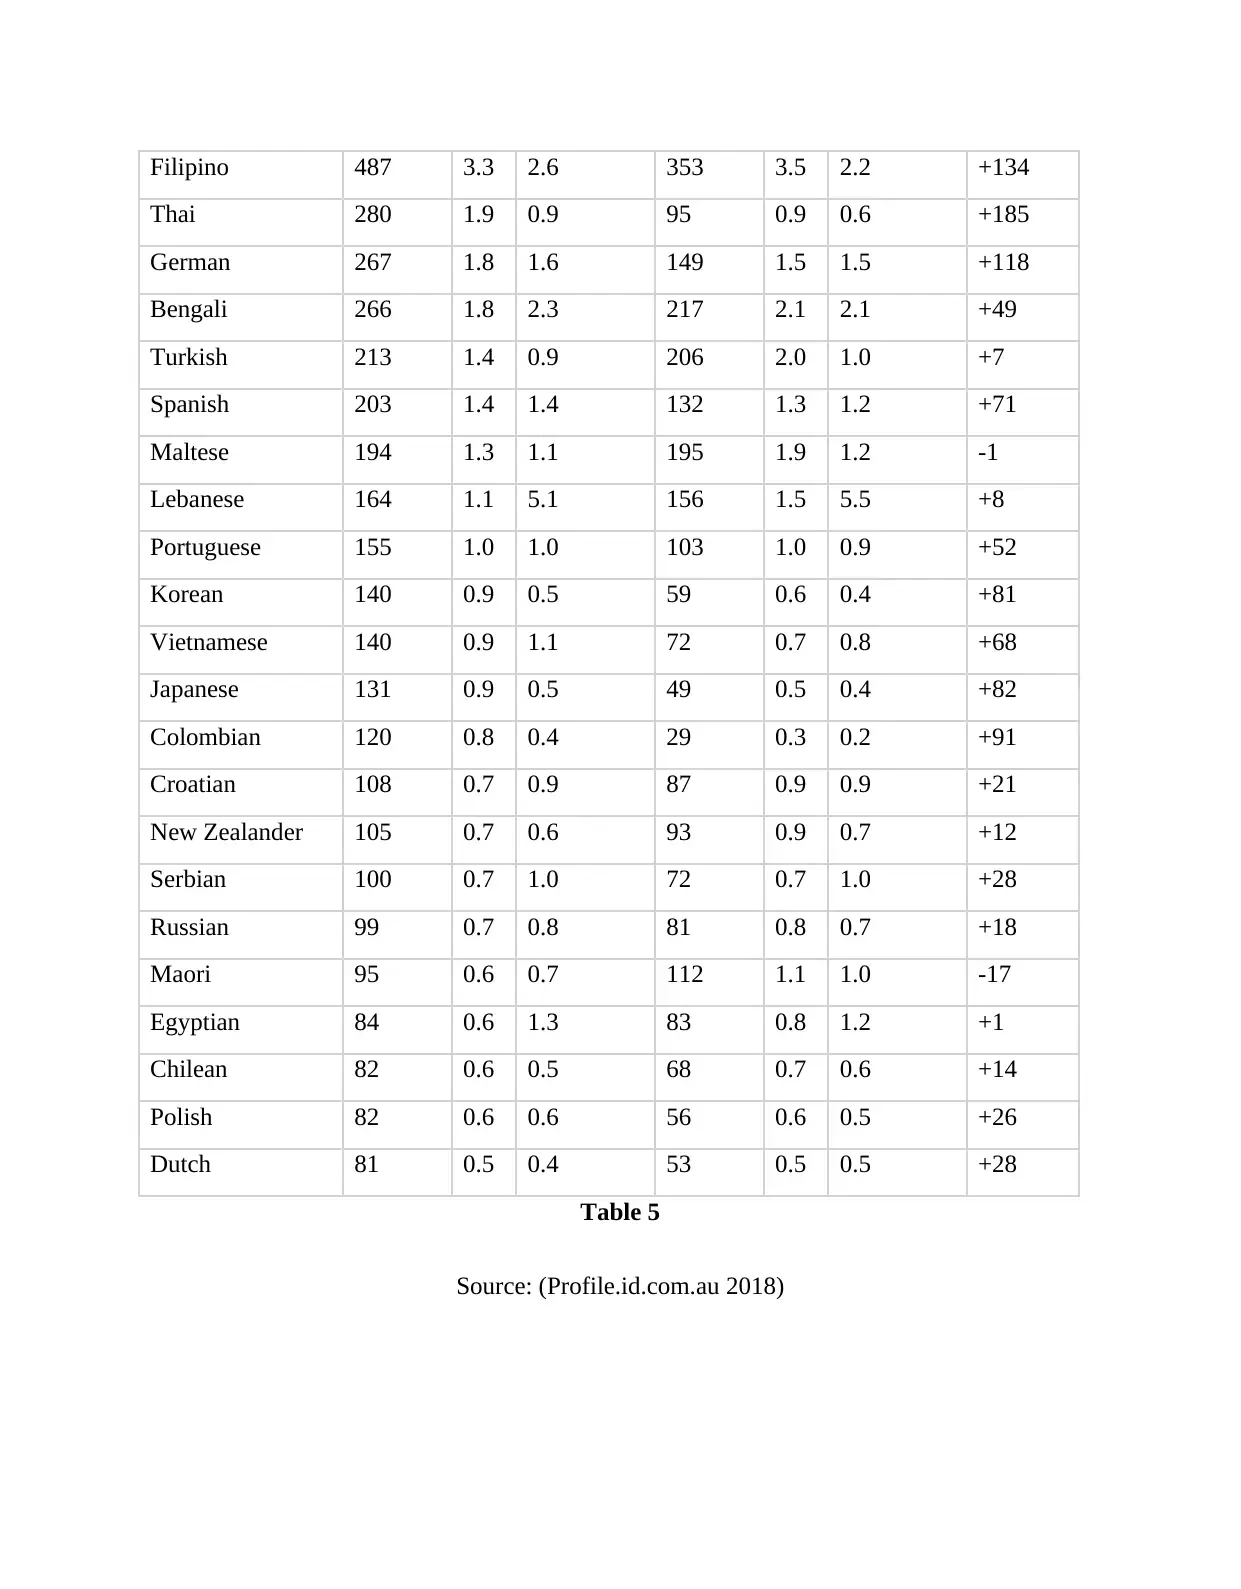
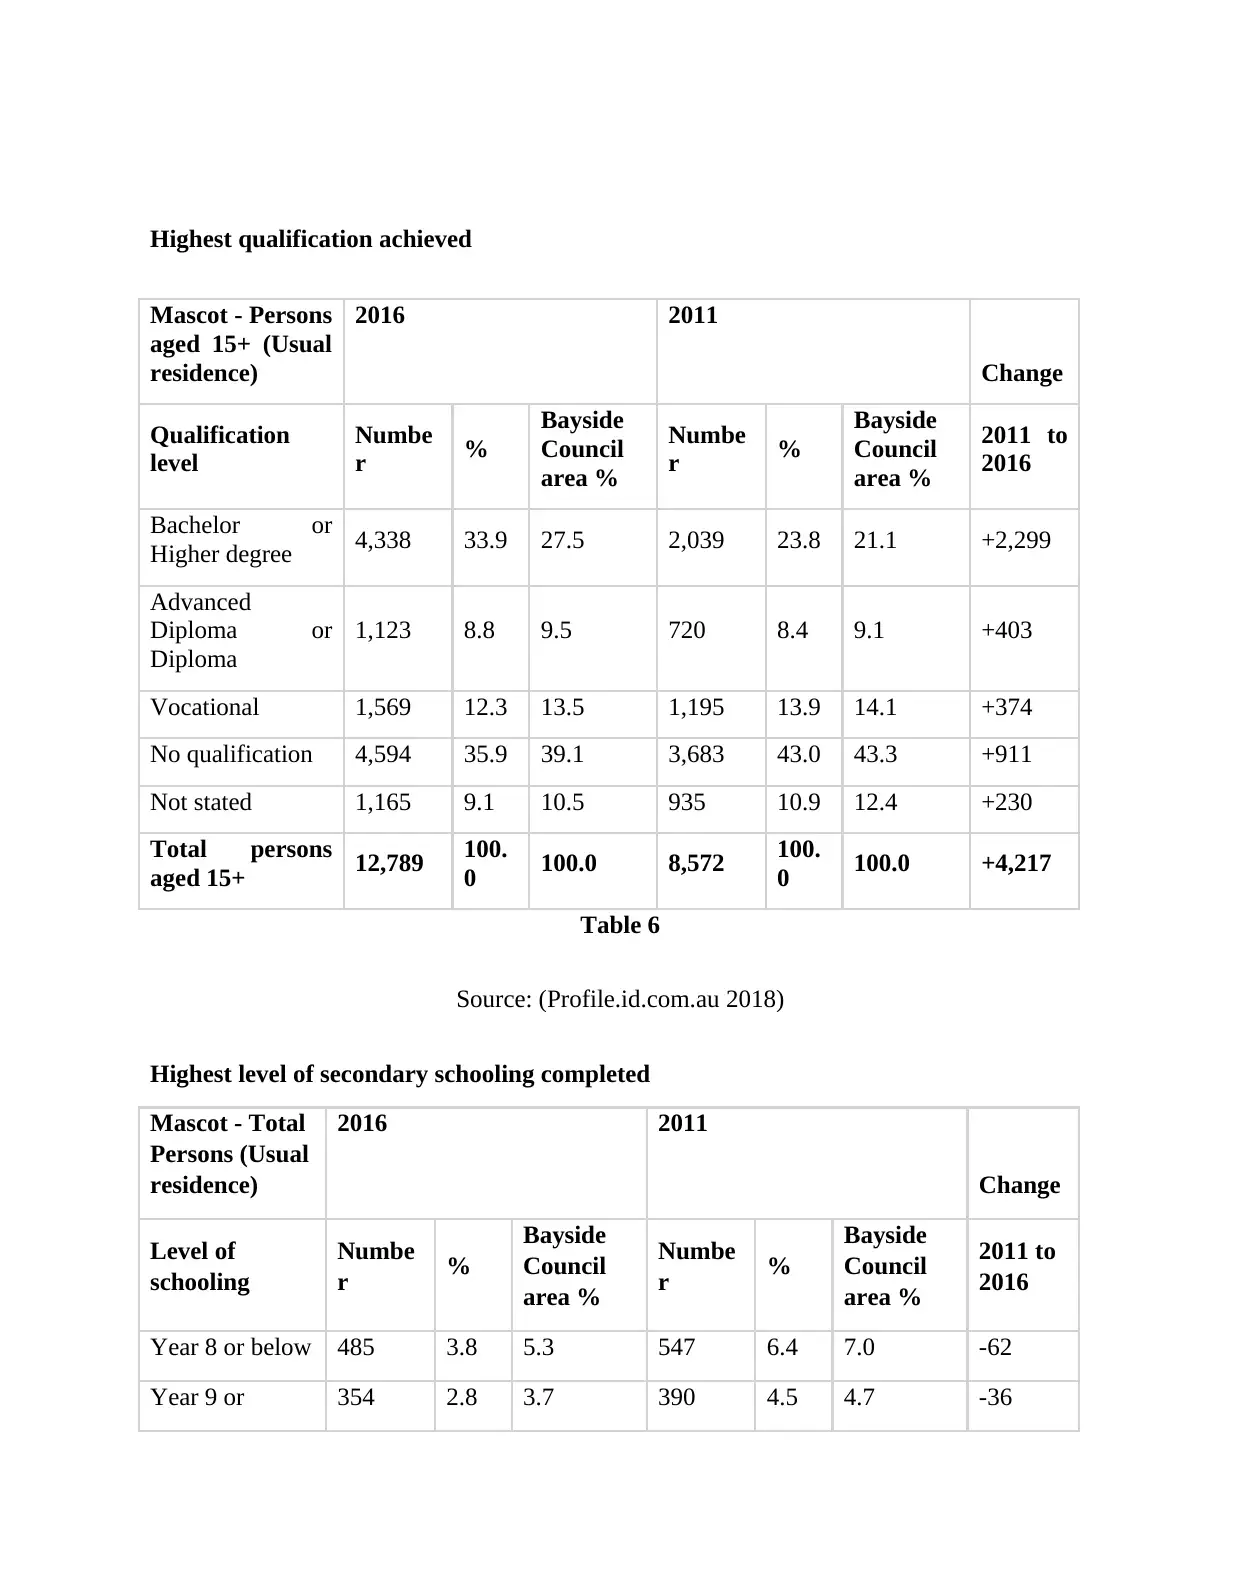
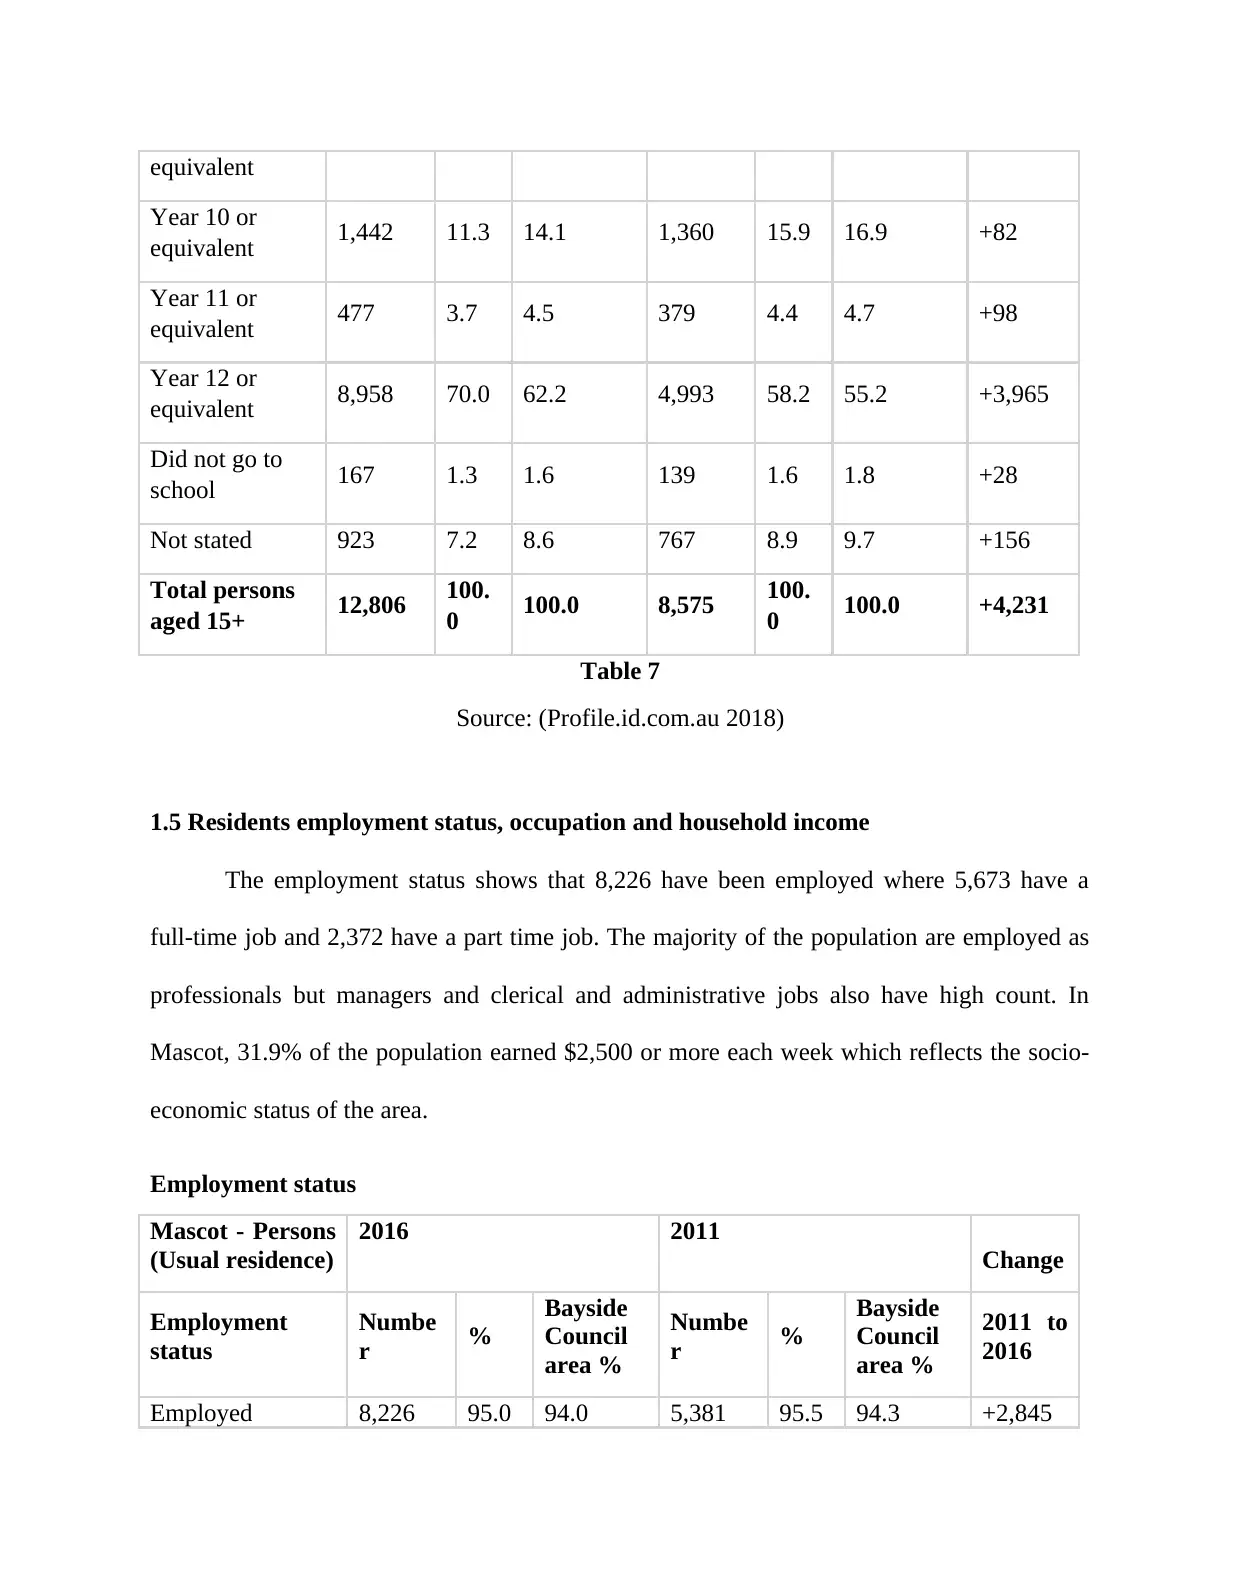
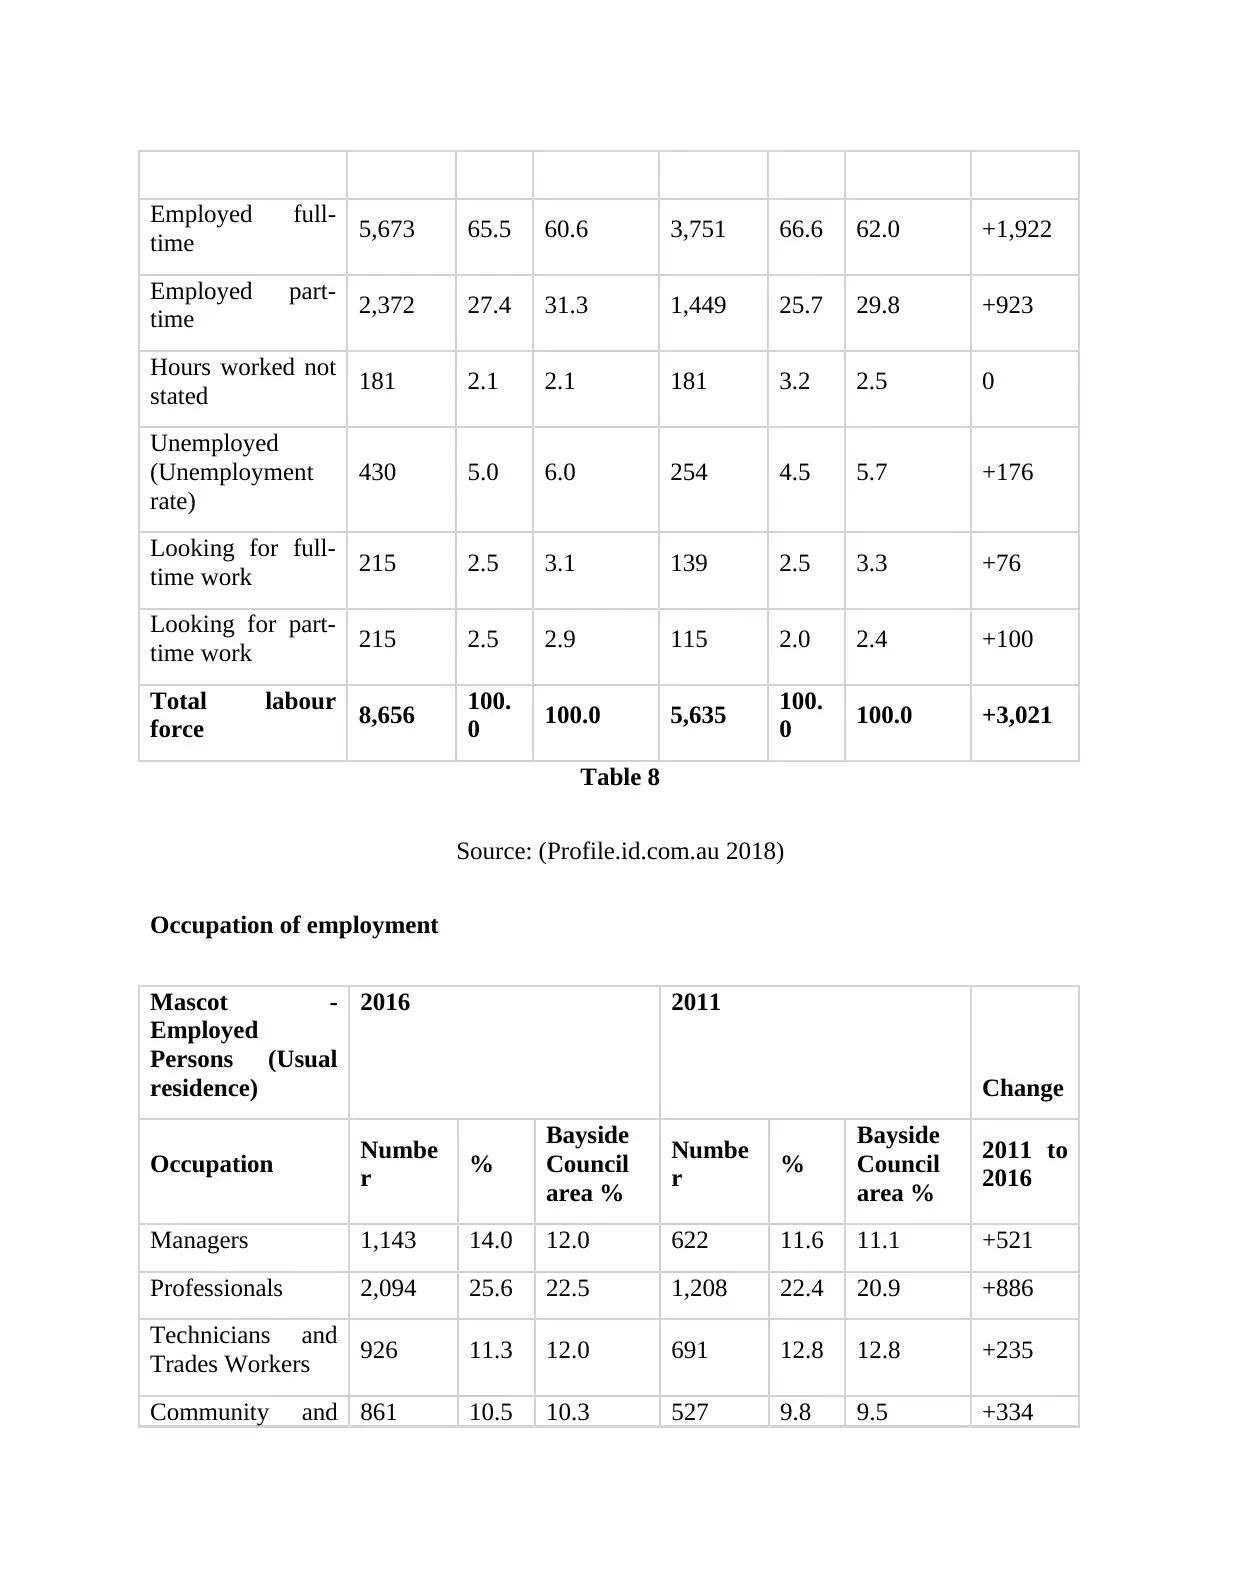
This report provides a comprehensive analysis of the property market in Mascot, NSW, focusing on demographic trends, dwelling types, population estimates, age distribution, cultural background, education levels, employment status, household income, and living styles. The analysis utilizes data from Profile.id.com.au to examine changes in population, dwelling structures, and resident characteristics between 2011 and 2016. Key findings include a significant increase in private dwellings and population, particularly among residents aged 20-40, and a growing Asian population. The report also highlights the high percentage of residents with tertiary qualifications and the area's socioeconomic status based on household income. Changes in household types, such as an increase in couples without children and group households, are also discussed. The data-driven insights provide a detailed overview of the Mascot area, essential for understanding its property market dynamics.

Property Market Research and Analysis
Name of the student
Name of the university
Author note
Name of the student
Name of the university
Author note
Paraphrase This Document
Need a fresh take? Get an instant paraphrase of this document with our AI Paraphraser

1. 0 Area profiles
1.1 Dwelling type, sales and clearance
The data shows that 6022 is the current figure of dwellings in Mascot and majority are
in private dwellings. However, there has been significant increase in the private dwellings
from previous years. The dwelling structure shows that majority of the population lives in
high density areas and moderate density areas. The population living separately are few in
numbers.
Dwellings
Mascot –
Households
(Enumerated)
2016 2011
Change
Dwellings Numbe
r %
Bayside
Council
area %
Numbe
r %
Bayside
Council
area %
2011 to
2016
Total dwellings 6,022 100.
0 100.0 4,100 100.
0 100.0 +1,922
Occupied private
dwellings 5,519 91.6 92.9 3,862 94.2 93.9 +1,657
Population in non-
private dwellings 1,495 770 +725
Average
household size
(persons per
dwelling)
3 2.6 3 2.6 0
Table 1
Source: (Profile.id.com.au 2018)

Dwelling structure
Mascot -
Dwellings
(Enumerated)
2016 2011
Change
Dwelling type Numbe
r %
Bayside
Council
area %
Numbe
r %
Bayside
Council
area %
2011 to
2016
Separate house 1,825 30.3 38.4 1,770 43.4 45.4 +55
Medium density 796 13.2 19.4 625 15.3 19.6 +171
High density 3,348 55.7 40.8 1,669 40.9 34.1 +1,679
Caravans, cabin,
houseboat 0 0.1 0 0.2 0
Other 15 0.2 0.8 4 0.1 0.7 +11
Not stated 31 0.5 0.4 10 0.2 0.2 +21
Total Private
Dwellings 6,015 100.
0 100.0 4,078 100.
0 100.0 +1,937
Table 2
Source: (Profile.id.com.au 2018)
1.2 Population summary and estimates
The overall estimated population of Mascot is 16,316 having a land area of 1,150 ha
(11 Km2). The population density of the Mascot is 14.19 persons per hectare. This shows that
there has been uniform growth in population in the country.
⊘ This is a preview!⊘
Do you want full access?
Subscribe today to unlock all pages.

Trusted by 1+ million students worldwide

Population
Mascot - Total
[genders]
2016 2011
Change
Population Numbe
r %
Bayside
Council
area %
Numbe
r %
Bayside
Council
area %
2011 to
2016
Estimated
Resident
Population
15,503
Enumerated
Population 15,982 10,796 +5,186
Usual Resident
Population 14,759 10,180 +4,579
Table 3
Source: (Profile.id.com.au 2018)
Estimated Resident Population (ERP)
Mascot
Year (ending June 30) Number Change in number Change in percent
2012 11,372
2013 12,012 +640 +5.63
2014 13,082 +1,070 +8.91
2015 14,273 +1,191 +9.10
2016 15,503 +1,230 +8.62
2017 16,316 +813 +5.24
Table 4
Source: (Profile.id.com.au 2018)
Paraphrase This Document
Need a fresh take? Get an instant paraphrase of this document with our AI Paraphraser

Graph 1
Source: (Profile.id.com.au 2018)
1.3 Age of residents
The report suggests that majority of the residents living in this area between the age
group of 20 to 40. The population below the age group of 15 is quite low and above the age
group of 65 is also quite low. However, the comparison shows that there has been significant
increase in population in the age group of 20 to 40. The age sex pyramid shows that majority
of the males and females belong to the age group of 20 to 40. Moreover, the area is equally
populated and there is parity between the number of males and females.

Age structure - Five-year age groups
Mascot - Total
Persons (Usual
residence)
2016 2011
Change
Five-year age
groups (years)
Numbe
r %
Bayside
Council
area %
Numbe
r %
Bayside
Council
area %
2011 to
2016
0 to 4 867 5.9 6.1 631 6.2 6.6 +236
5 to 9 610 4.1 5.4 490 4.8 5.7 +120
10 to 14 480 3.2 4.7 503 4.9 5.3 -23
15 to 19 843 5.7 5.2 547 5.4 5.3 +296
20 to 24 1,554 10.5 7.6 744 7.3 6.7 +810
25 to 29 2,175 14.7 10.0 1,075 10.6 8.7 +1,100
30 to 34 1,878 12.7 9.7 950 9.3 8.4 +928
35 to 39 1,347 9.1 7.8 867 8.5 8.0 +480
40 to 44 977 6.6 6.9 804 7.9 7.2 +173
45 to 49 792 5.4 6.3 722 7.1 6.7 +70
50 to 54 735 5.0 5.9 670 6.6 6.0 +65
55 to 59 673 4.6 5.2 522 5.1 5.4 +151
60 to 64 540 3.7 4.6 412 4.0 5.1 +128
65 to 69 397 2.7 4.2 396 3.9 4.0 +1
70 to 74 301 2.0 3.3 296 2.9 3.4 +5
75 to 79 270 1.8 2.7 265 2.6 2.8 +5
80 to 84 190 1.3 2.1 178 1.7 2.3 +12
85 and over 155 1.0 2.3 108 1.1 2.3 +47
Total
population 14,784 100.
0 100.0 10,180 100.
0 100.0 +4,604
Table 5
⊘ This is a preview!⊘
Do you want full access?
Subscribe today to unlock all pages.

Trusted by 1+ million students worldwide

Source: (Profile.id.com.au 2018)
Graph 2
Source: (Profile.id.com.au 2018)
Graph 2
Source: (Profile.id.com.au 2018)
Paraphrase This Document
Need a fresh take? Get an instant paraphrase of this document with our AI Paraphraser

Graph 3
Source: (Profile.id.com.au 2018)
1.4 Resident cultural background, qualification and schooling level
The majority of the population living in Mascot are Chinese, English, Australian, Irish
and Greek. However, there has been significant increase in the Asian population in the past
five years. In Mascot, 70% of the population have completed their schooling and from the
qualification data shows that 5461 people have tertiary qualification.
Ancestry - Ranked by size
Mascot - Total
[genders] (Usual
residence)
2016 2011
Change
Ancestry Numbe
r %
Bayside
Council
area %
Numbe
r %
Bayside
Council
area %
2011 to
2016
Chinese 3,339 22.
6 13.8 1,454 14.
3 11.2 +1,885
English 2,378 16.
1 15.0 1,674 16.
4 15.3 +704
Australian 2,150 14.
5 14.8 1,895 18.
6 16.3 +255
Irish 1,005 6.8 6.1 668 6.6 5.7 +337
Greek 781 5.3 9.0 786 7.7 9.7 -5
Indonesian 623 4.2 1.4 254 2.5 1.0 +369
Scottish 544 3.7 3.6 379 3.7 3.7 +165
Indian 519 3.5 2.6 332 3.3 2.2 +187
Italian 509 3.4 4.3 378 3.7 4.4 +131

Filipino 487 3.3 2.6 353 3.5 2.2 +134
Thai 280 1.9 0.9 95 0.9 0.6 +185
German 267 1.8 1.6 149 1.5 1.5 +118
Bengali 266 1.8 2.3 217 2.1 2.1 +49
Turkish 213 1.4 0.9 206 2.0 1.0 +7
Spanish 203 1.4 1.4 132 1.3 1.2 +71
Maltese 194 1.3 1.1 195 1.9 1.2 -1
Lebanese 164 1.1 5.1 156 1.5 5.5 +8
Portuguese 155 1.0 1.0 103 1.0 0.9 +52
Korean 140 0.9 0.5 59 0.6 0.4 +81
Vietnamese 140 0.9 1.1 72 0.7 0.8 +68
Japanese 131 0.9 0.5 49 0.5 0.4 +82
Colombian 120 0.8 0.4 29 0.3 0.2 +91
Croatian 108 0.7 0.9 87 0.9 0.9 +21
New Zealander 105 0.7 0.6 93 0.9 0.7 +12
Serbian 100 0.7 1.0 72 0.7 1.0 +28
Russian 99 0.7 0.8 81 0.8 0.7 +18
Maori 95 0.6 0.7 112 1.1 1.0 -17
Egyptian 84 0.6 1.3 83 0.8 1.2 +1
Chilean 82 0.6 0.5 68 0.7 0.6 +14
Polish 82 0.6 0.6 56 0.6 0.5 +26
Dutch 81 0.5 0.4 53 0.5 0.5 +28
Table 5
Source: (Profile.id.com.au 2018)
⊘ This is a preview!⊘
Do you want full access?
Subscribe today to unlock all pages.

Trusted by 1+ million students worldwide

Highest qualification achieved
Mascot - Persons
aged 15+ (Usual
residence)
2016 2011
Change
Qualification
level
Numbe
r %
Bayside
Council
area %
Numbe
r %
Bayside
Council
area %
2011 to
2016
Bachelor or
Higher degree 4,338 33.9 27.5 2,039 23.8 21.1 +2,299
Advanced
Diploma or
Diploma
1,123 8.8 9.5 720 8.4 9.1 +403
Vocational 1,569 12.3 13.5 1,195 13.9 14.1 +374
No qualification 4,594 35.9 39.1 3,683 43.0 43.3 +911
Not stated 1,165 9.1 10.5 935 10.9 12.4 +230
Total persons
aged 15+ 12,789 100.
0 100.0 8,572 100.
0 100.0 +4,217
Table 6
Source: (Profile.id.com.au 2018)
Highest level of secondary schooling completed
Mascot - Total
Persons (Usual
residence)
2016 2011
Change
Level of
schooling
Numbe
r %
Bayside
Council
area %
Numbe
r %
Bayside
Council
area %
2011 to
2016
Year 8 or below 485 3.8 5.3 547 6.4 7.0 -62
Year 9 or 354 2.8 3.7 390 4.5 4.7 -36
Paraphrase This Document
Need a fresh take? Get an instant paraphrase of this document with our AI Paraphraser

equivalent
Year 10 or
equivalent 1,442 11.3 14.1 1,360 15.9 16.9 +82
Year 11 or
equivalent 477 3.7 4.5 379 4.4 4.7 +98
Year 12 or
equivalent 8,958 70.0 62.2 4,993 58.2 55.2 +3,965
Did not go to
school 167 1.3 1.6 139 1.6 1.8 +28
Not stated 923 7.2 8.6 767 8.9 9.7 +156
Total persons
aged 15+ 12,806 100.
0 100.0 8,575 100.
0 100.0 +4,231
Table 7
Source: (Profile.id.com.au 2018)
1.5 Residents employment status, occupation and household income
The employment status shows that 8,226 have been employed where 5,673 have a
full-time job and 2,372 have a part time job. The majority of the population are employed as
professionals but managers and clerical and administrative jobs also have high count. In
Mascot, 31.9% of the population earned $2,500 or more each week which reflects the socio-
economic status of the area.
Employment status
Mascot - Persons
(Usual residence)
2016 2011
Change
Employment
status
Numbe
r %
Bayside
Council
area %
Numbe
r %
Bayside
Council
area %
2011 to
2016
Employed 8,226 95.0 94.0 5,381 95.5 94.3 +2,845

Employed full-
time 5,673 65.5 60.6 3,751 66.6 62.0 +1,922
Employed part-
time 2,372 27.4 31.3 1,449 25.7 29.8 +923
Hours worked not
stated 181 2.1 2.1 181 3.2 2.5 0
Unemployed
(Unemployment
rate)
430 5.0 6.0 254 4.5 5.7 +176
Looking for full-
time work 215 2.5 3.1 139 2.5 3.3 +76
Looking for part-
time work 215 2.5 2.9 115 2.0 2.4 +100
Total labour
force 8,656 100.
0 100.0 5,635 100.
0 100.0 +3,021
Table 8
Source: (Profile.id.com.au 2018)
Occupation of employment
Mascot -
Employed
Persons (Usual
residence)
2016 2011
Change
Occupation Numbe
r %
Bayside
Council
area %
Numbe
r %
Bayside
Council
area %
2011 to
2016
Managers 1,143 14.0 12.0 622 11.6 11.1 +521
Professionals 2,094 25.6 22.5 1,208 22.4 20.9 +886
Technicians and
Trades Workers 926 11.3 12.0 691 12.8 12.8 +235
Community and 861 10.5 10.3 527 9.8 9.5 +334
⊘ This is a preview!⊘
Do you want full access?
Subscribe today to unlock all pages.

Trusted by 1+ million students worldwide
1 out of 16
Your All-in-One AI-Powered Toolkit for Academic Success.
 +13062052269
info@desklib.com
Available 24*7 on WhatsApp / Email
Unlock your academic potential
Copyright © 2020–2025 A2Z Services. All Rights Reserved. Developed and managed by ZUCOL.
