Property Investment and Risk Management: A Detailed Analysis

Verified

Added on  2022/09/18

|39
|4253
|42
Report
AI Summary
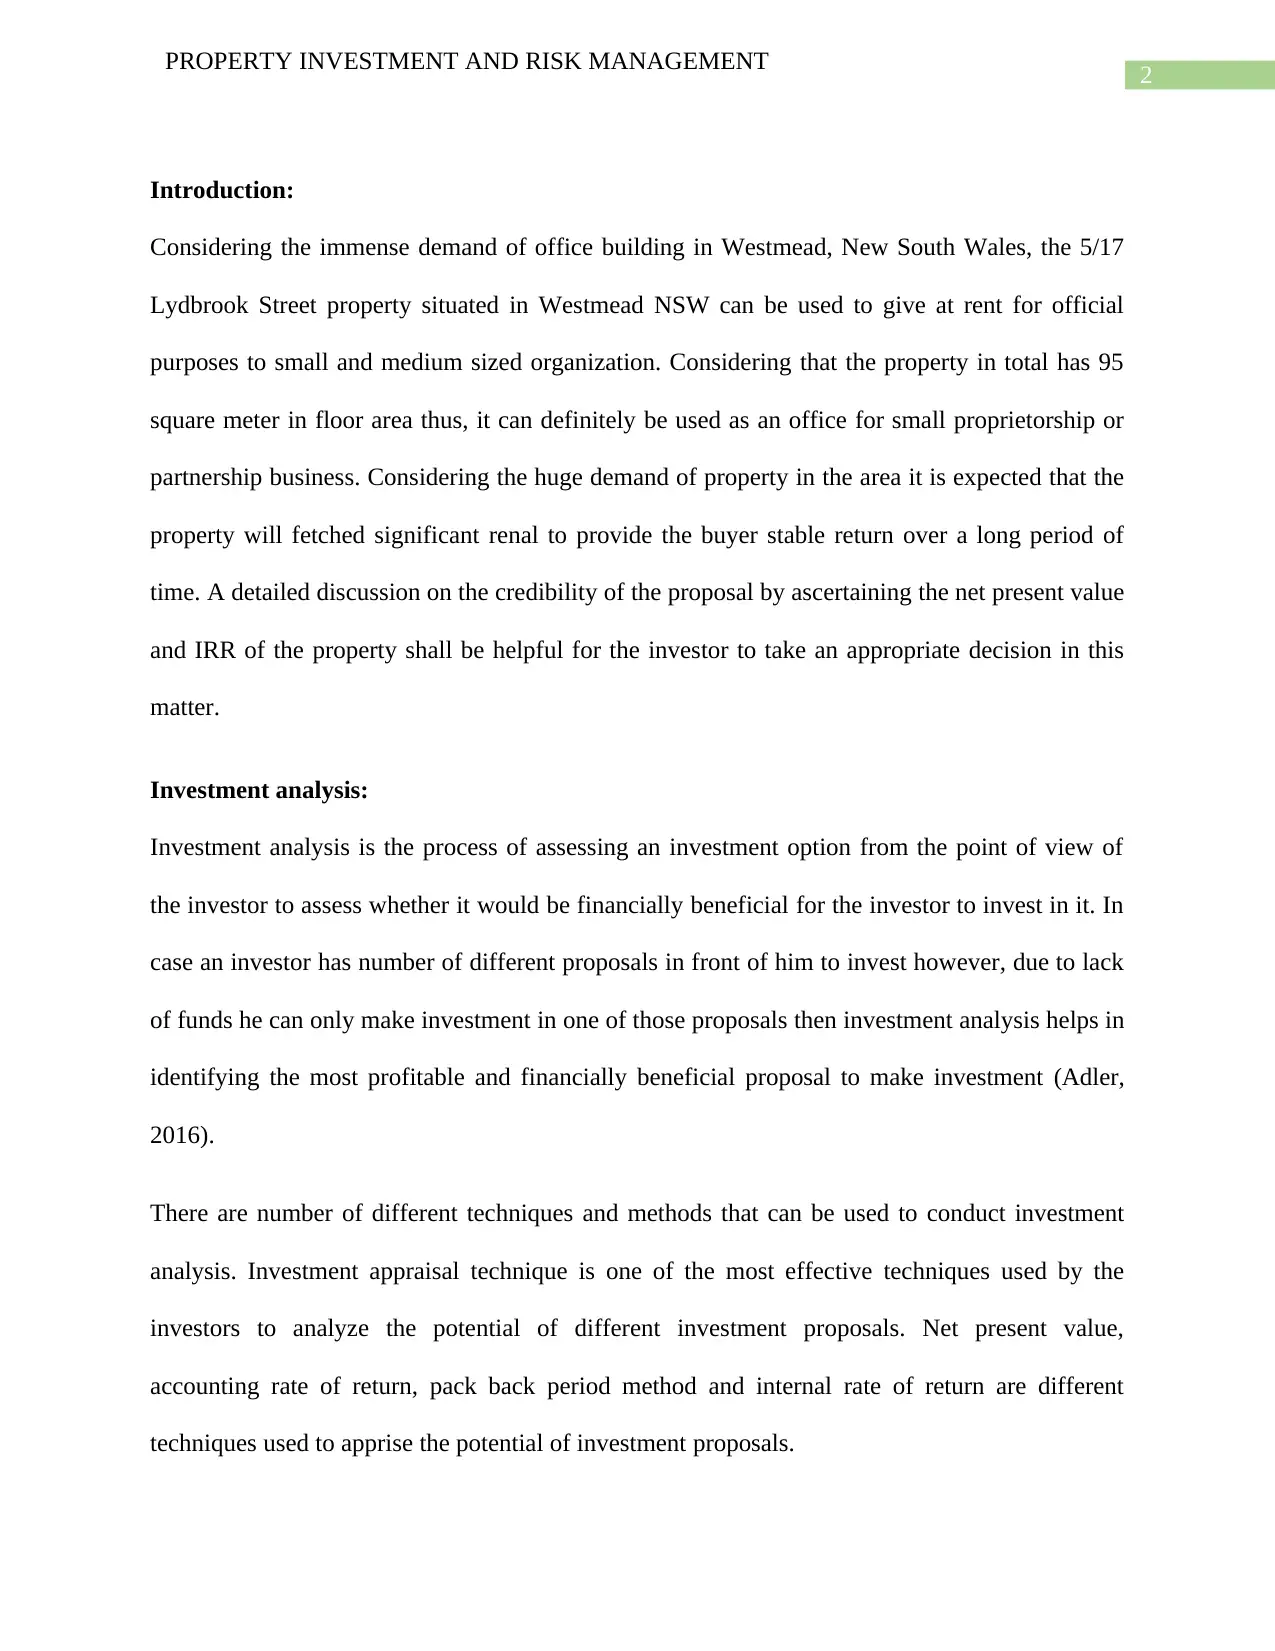
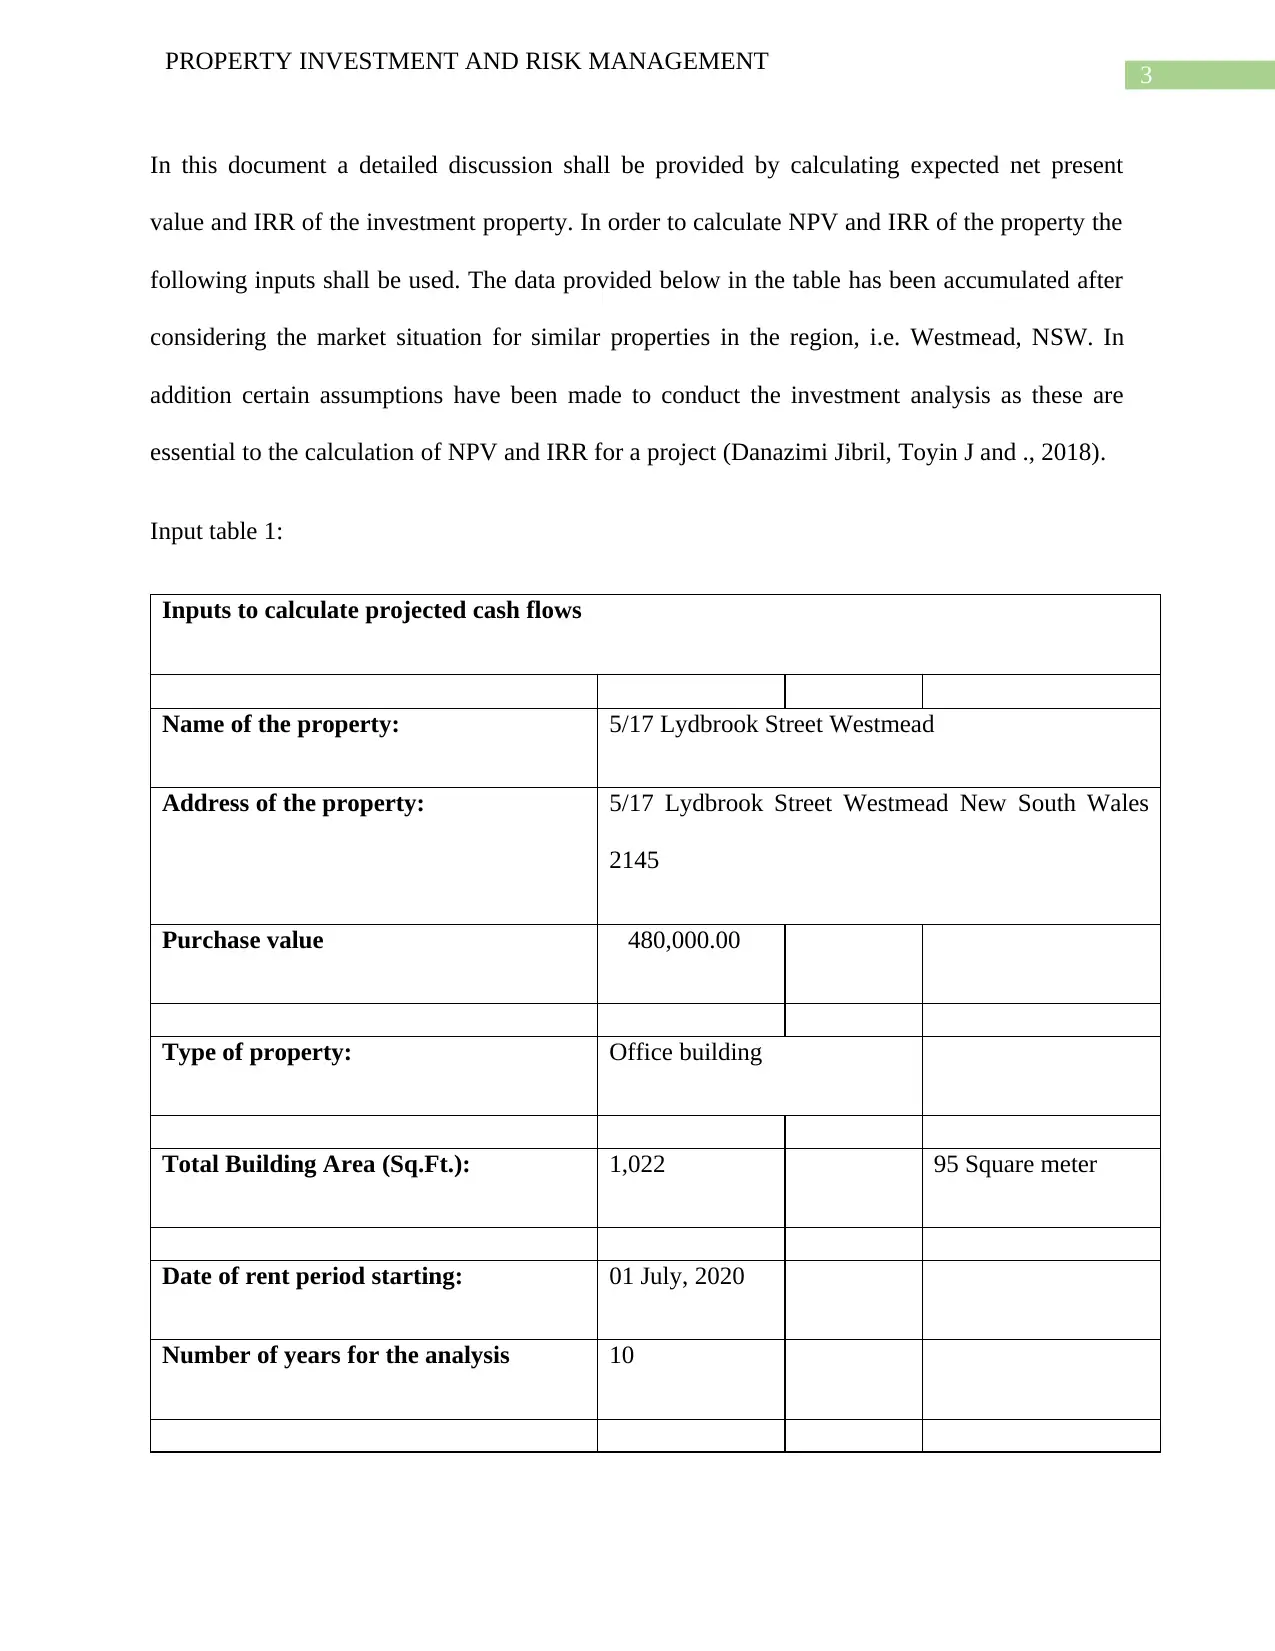
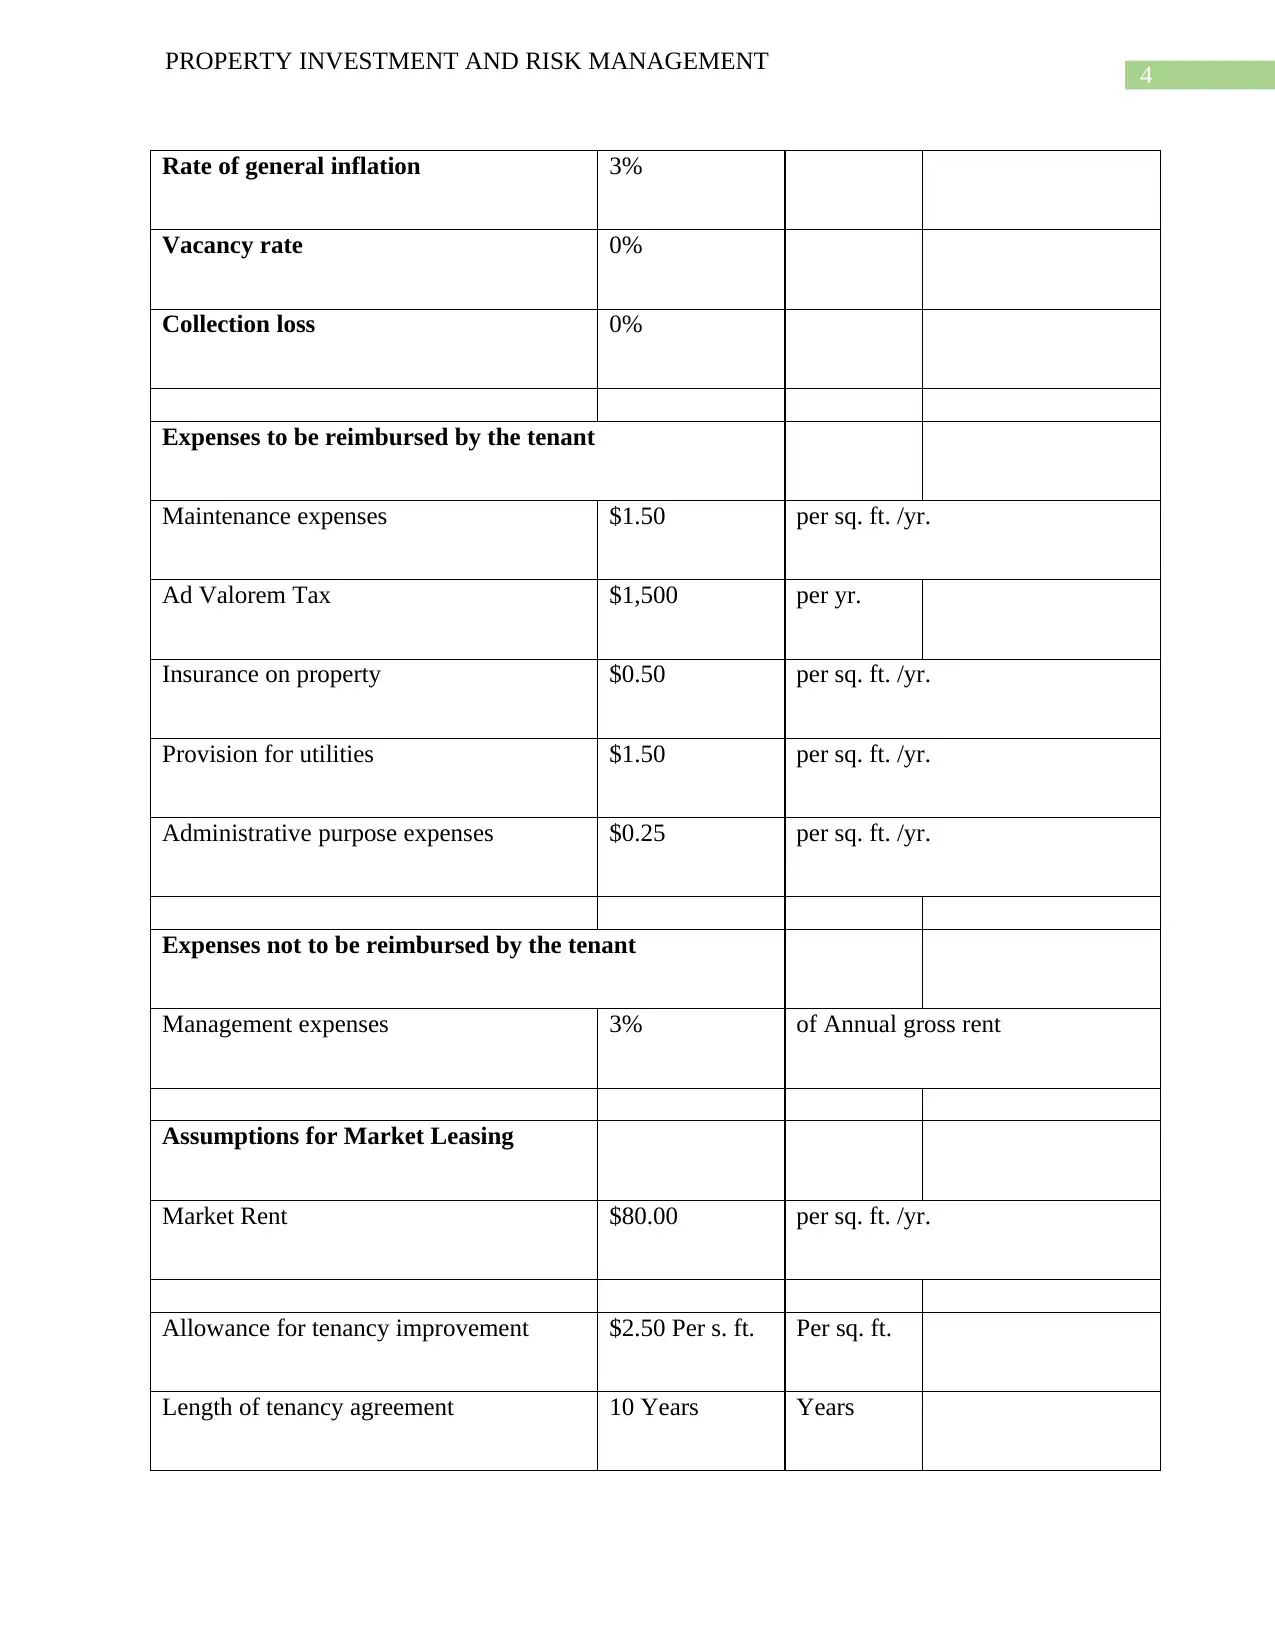
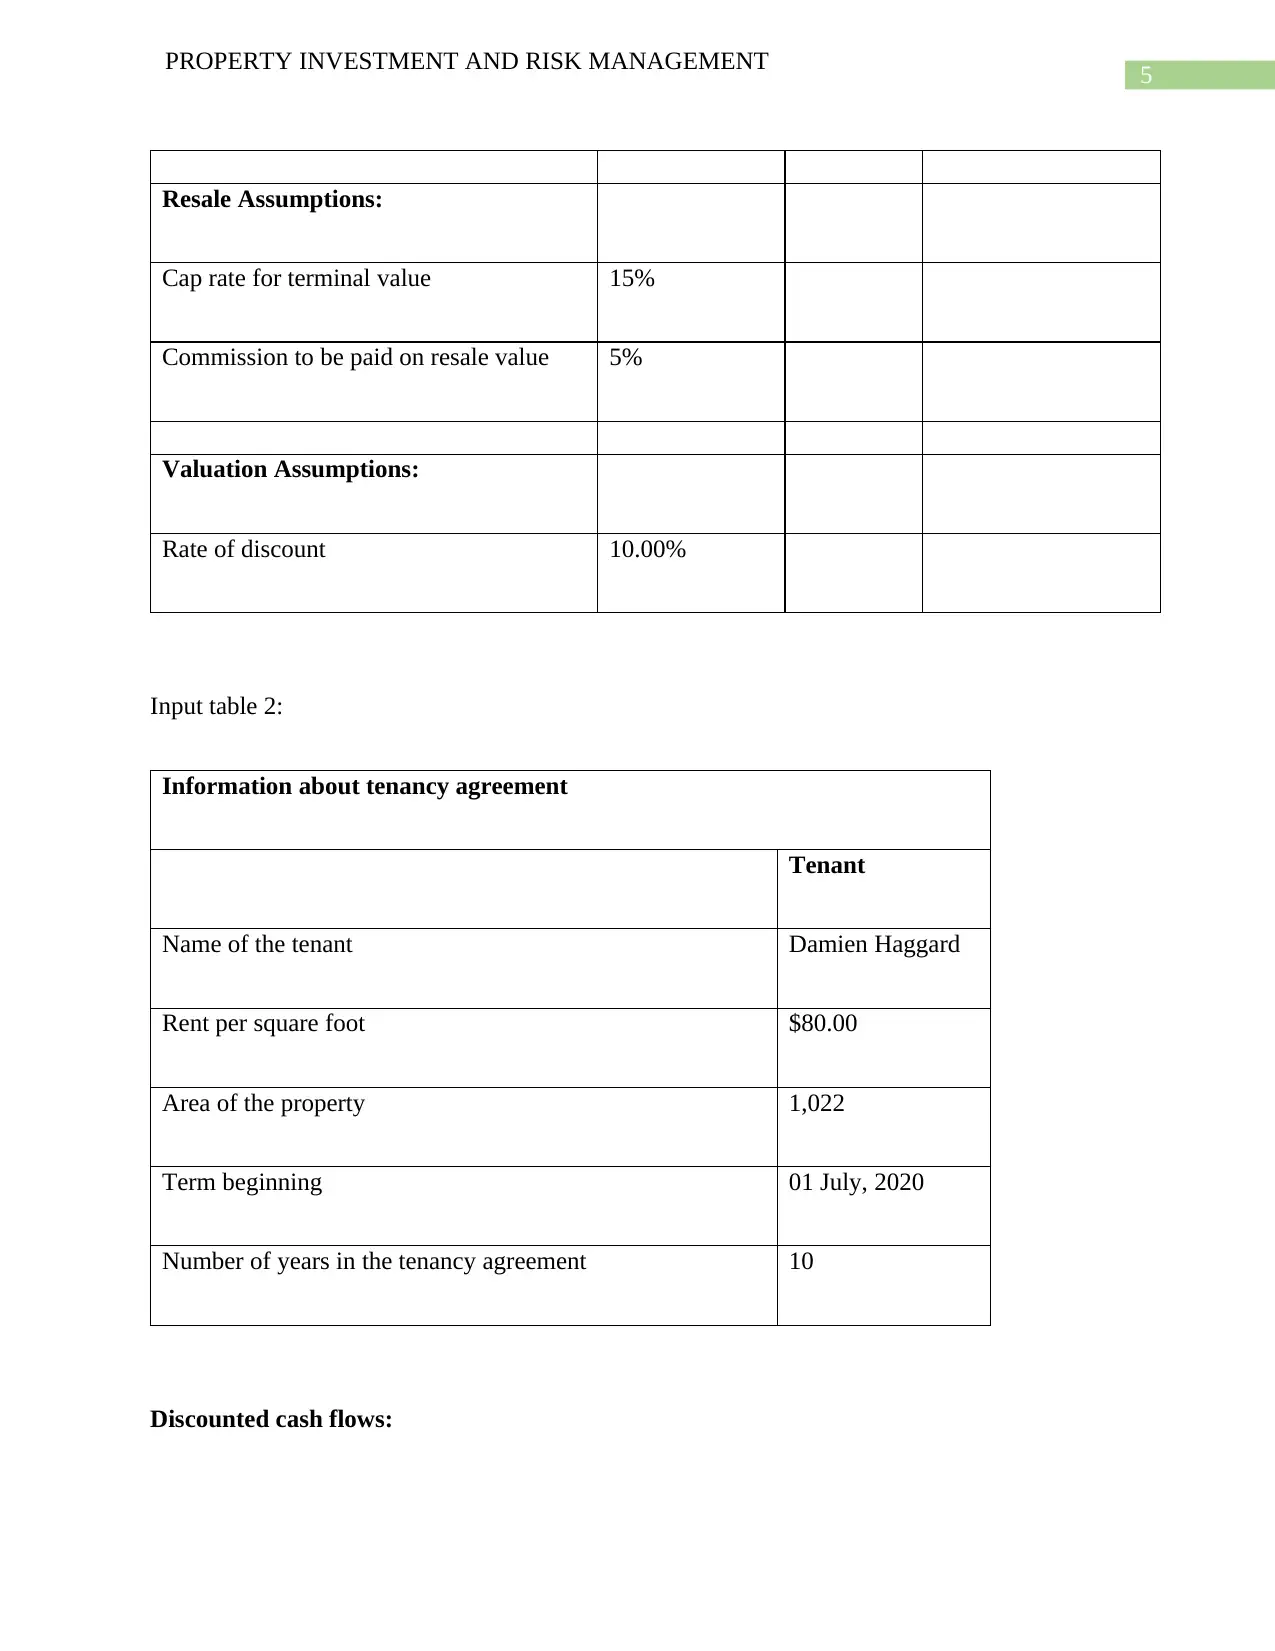
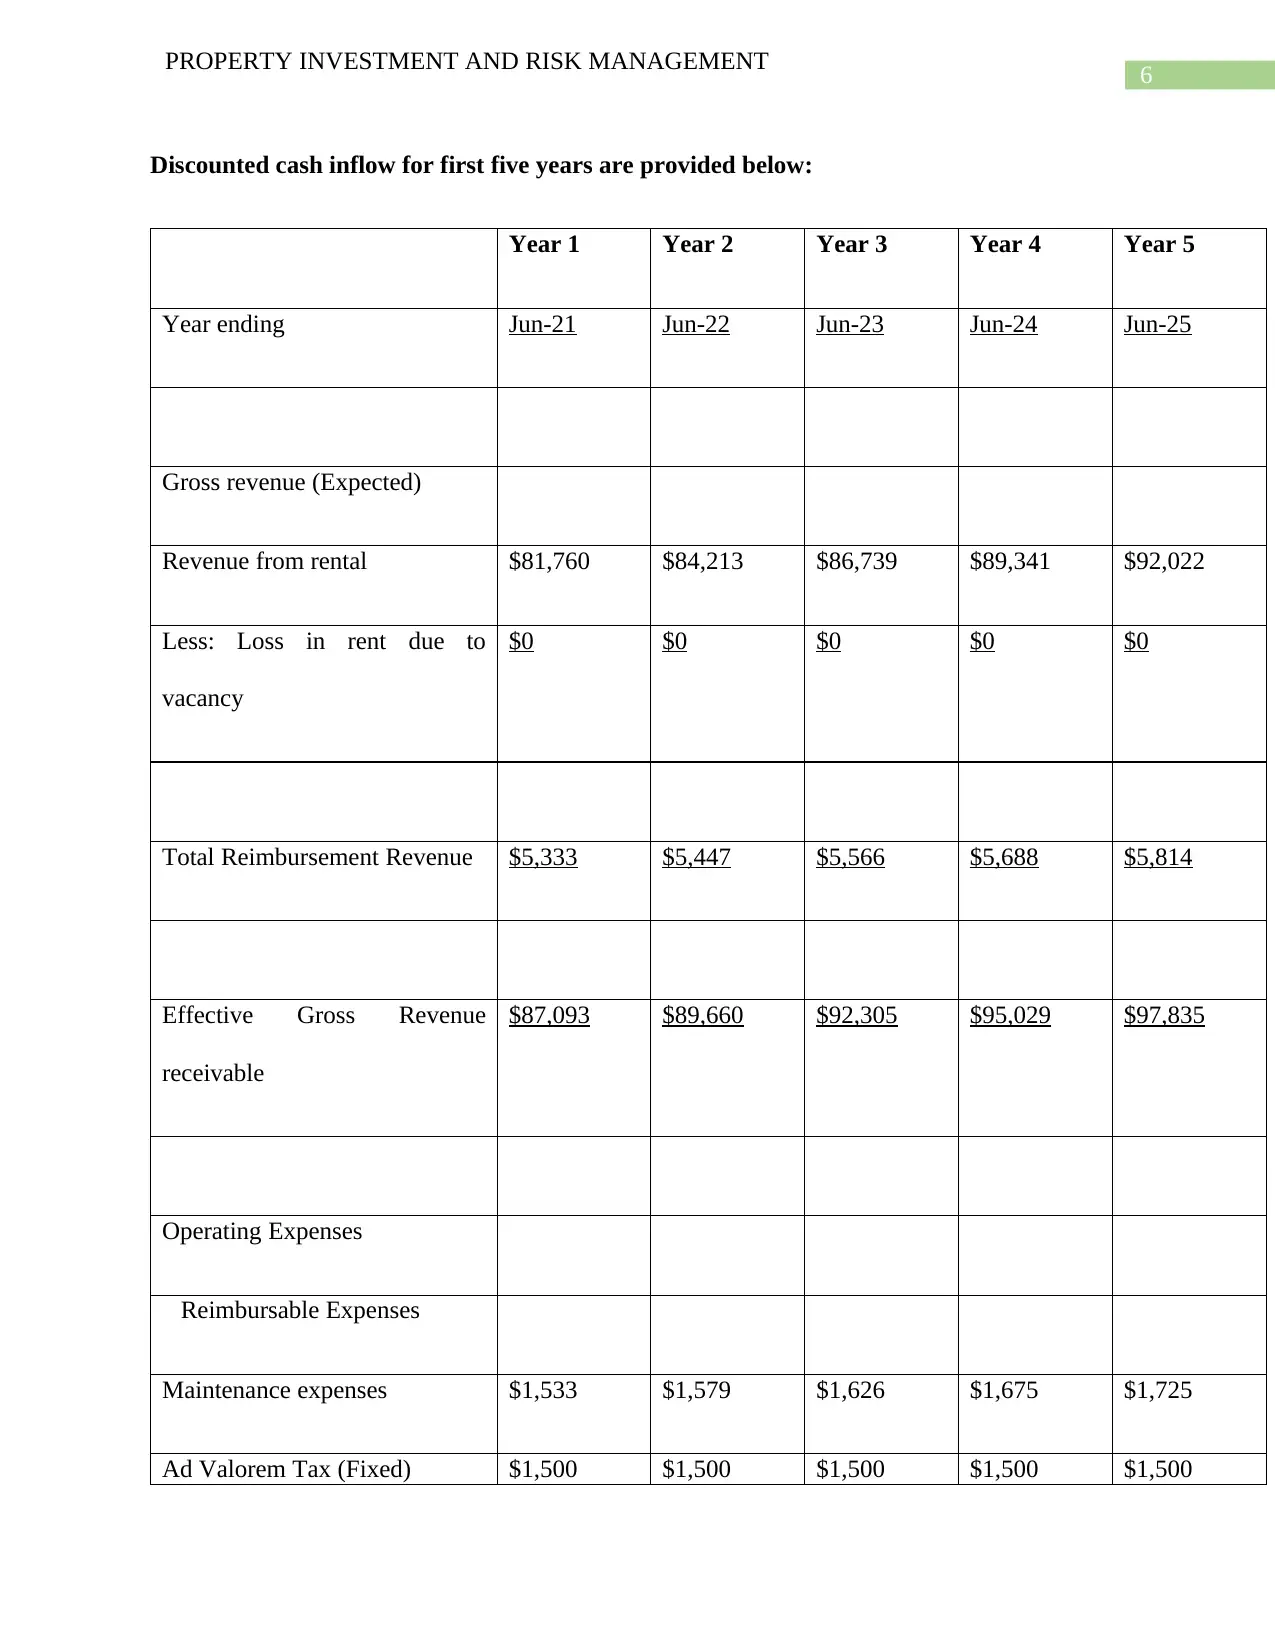
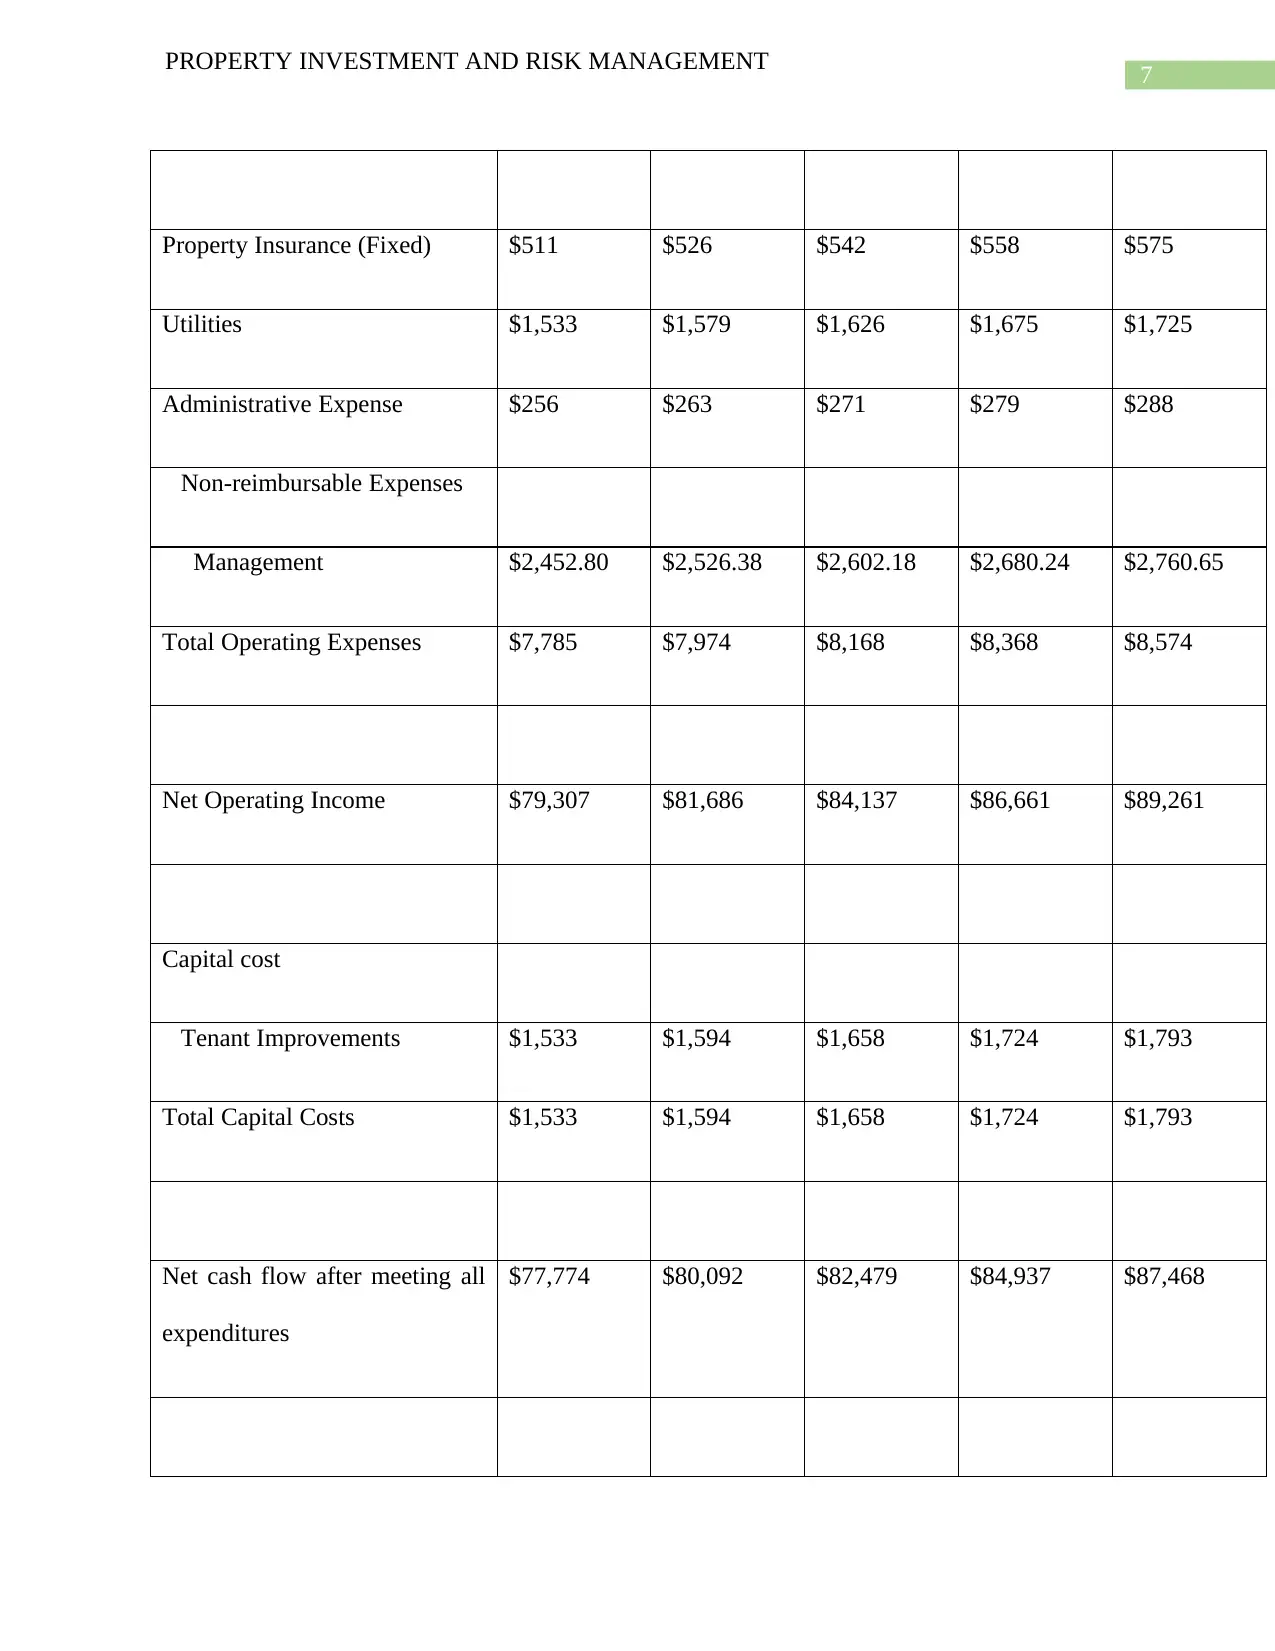
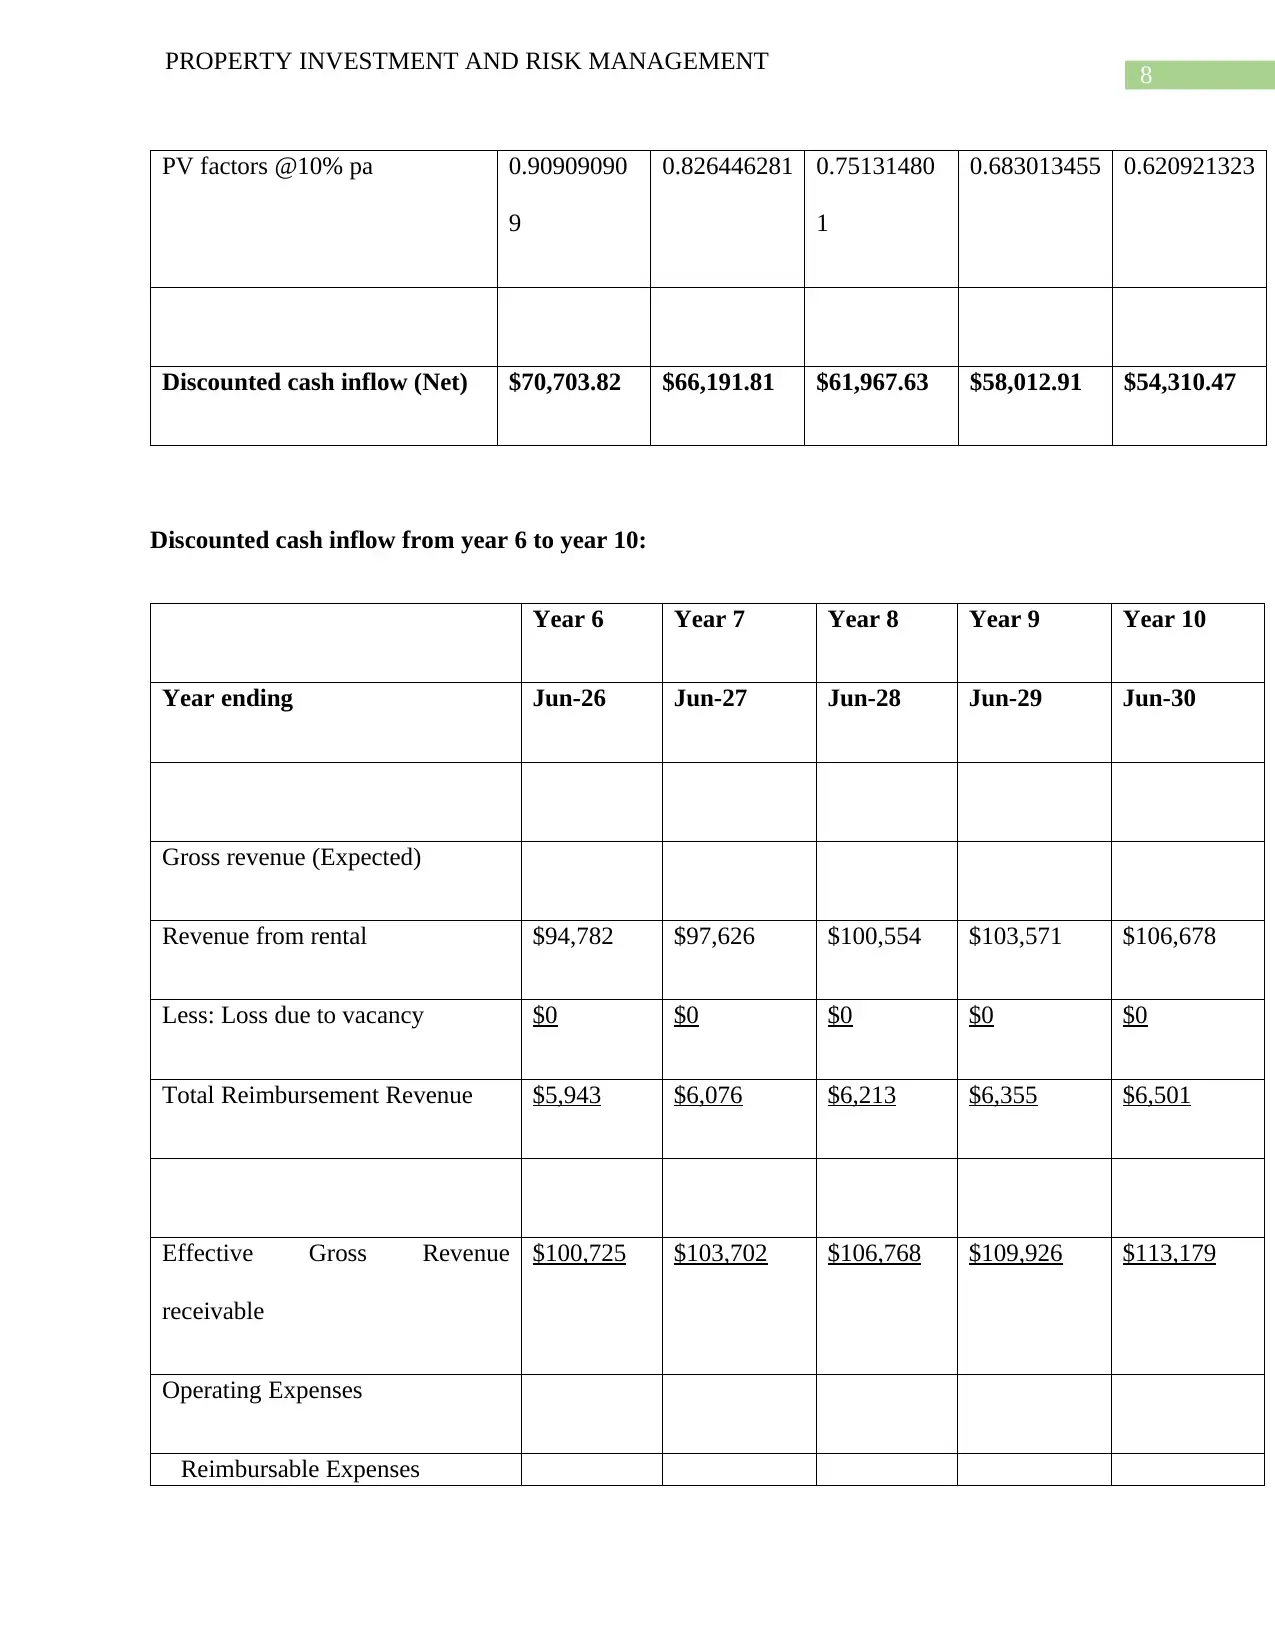
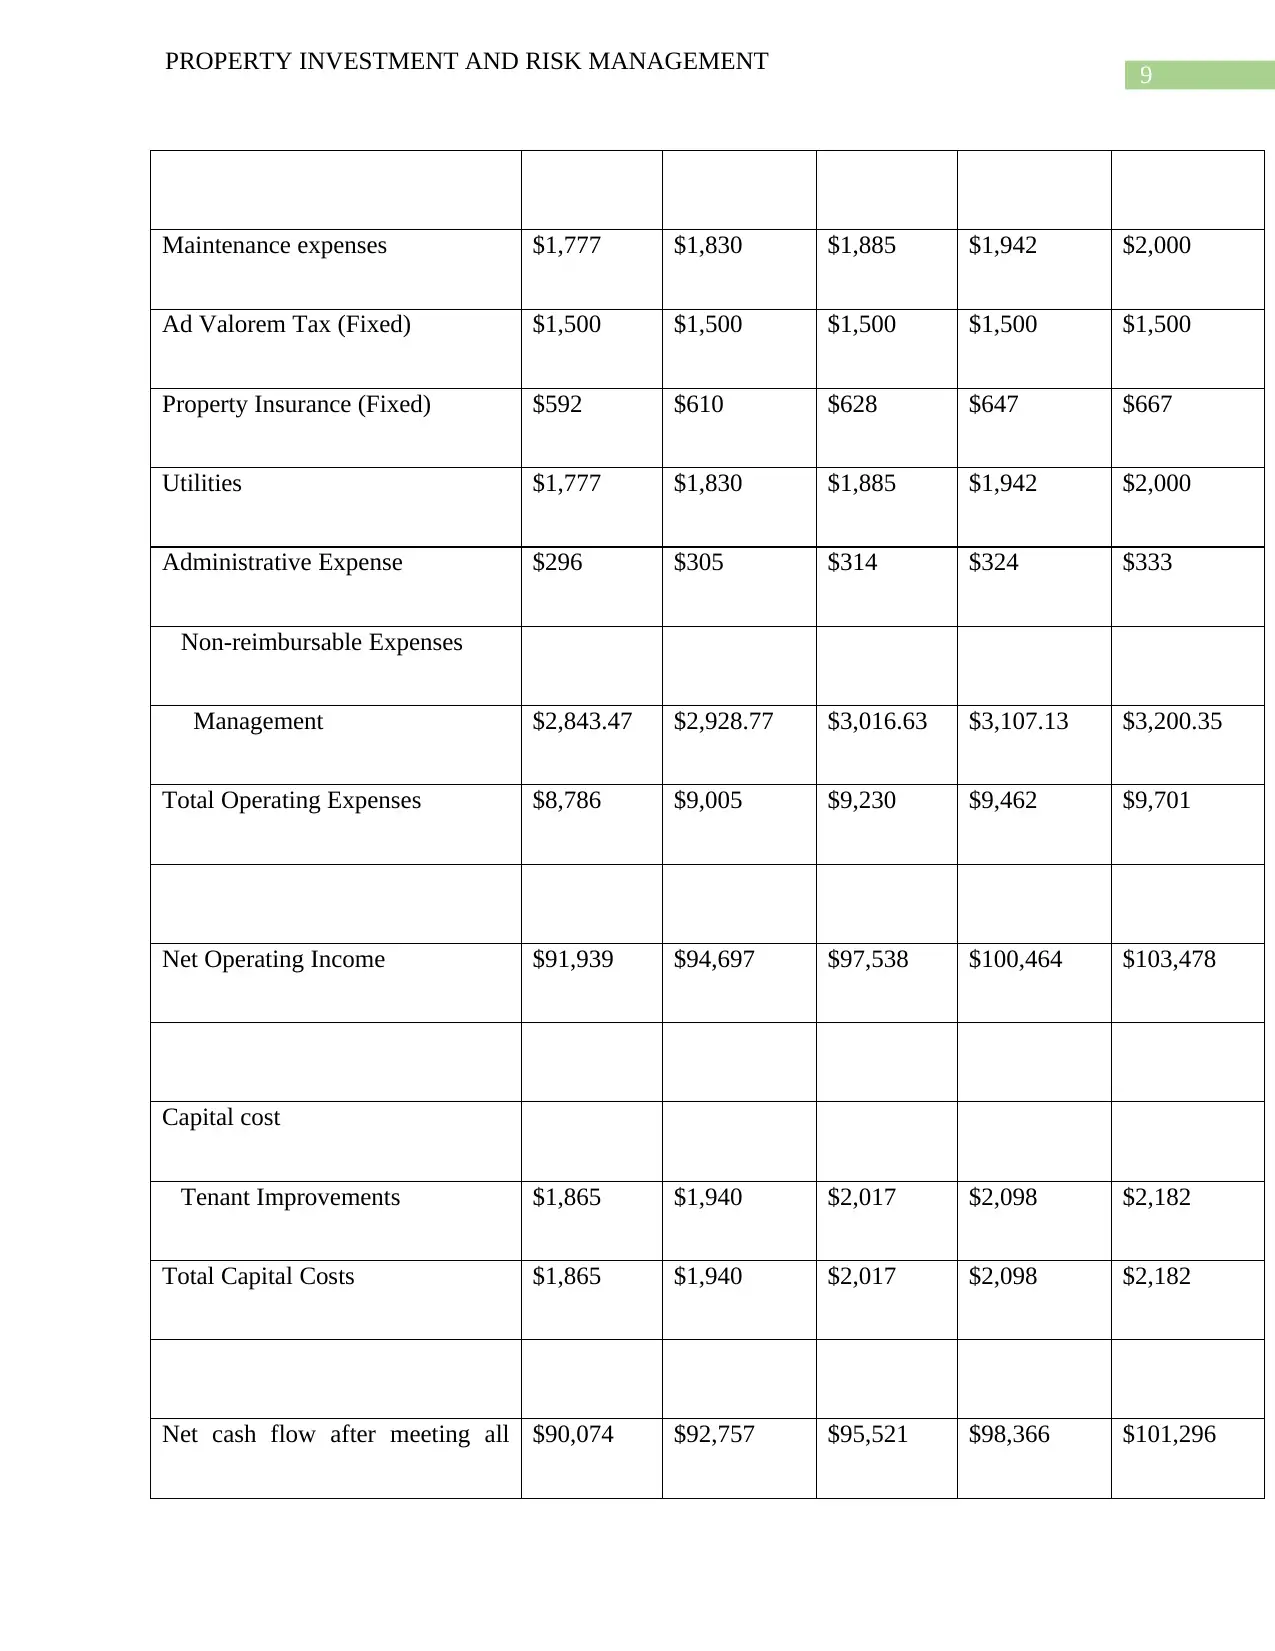
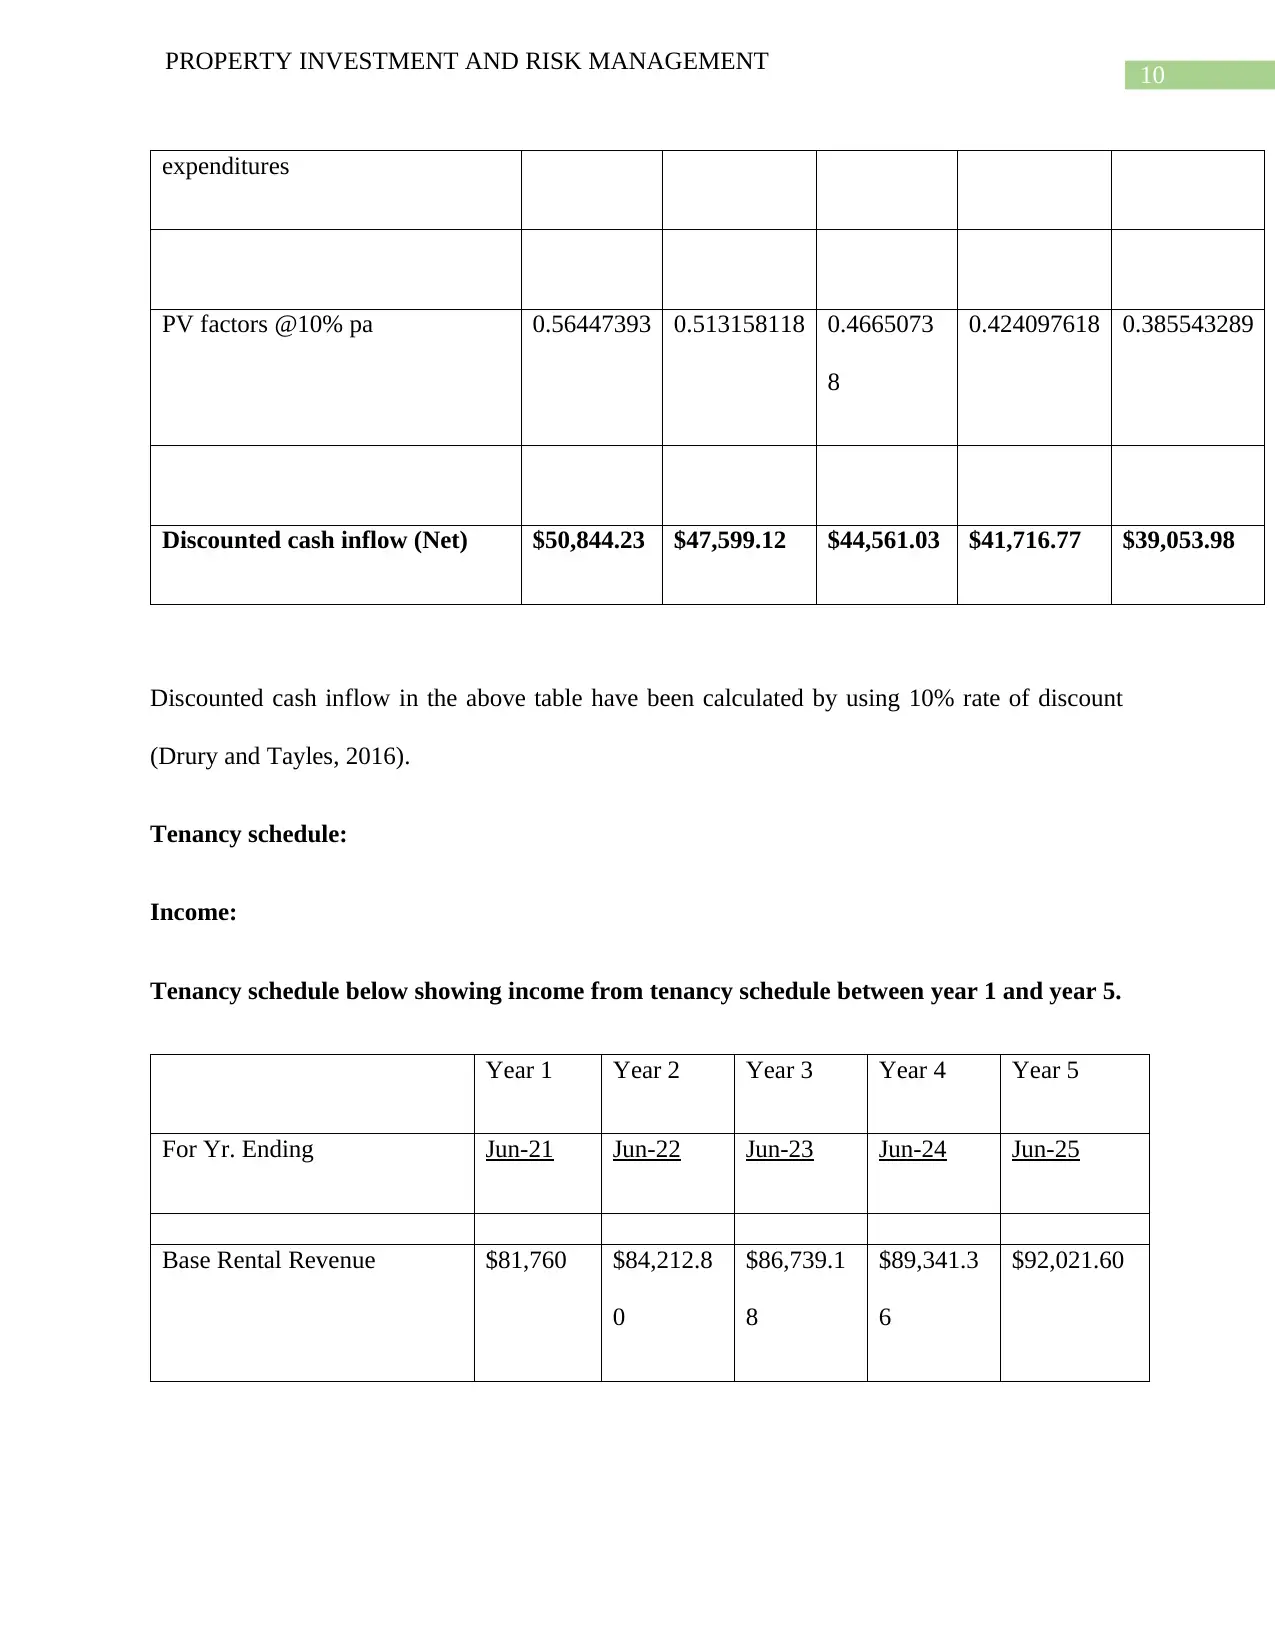
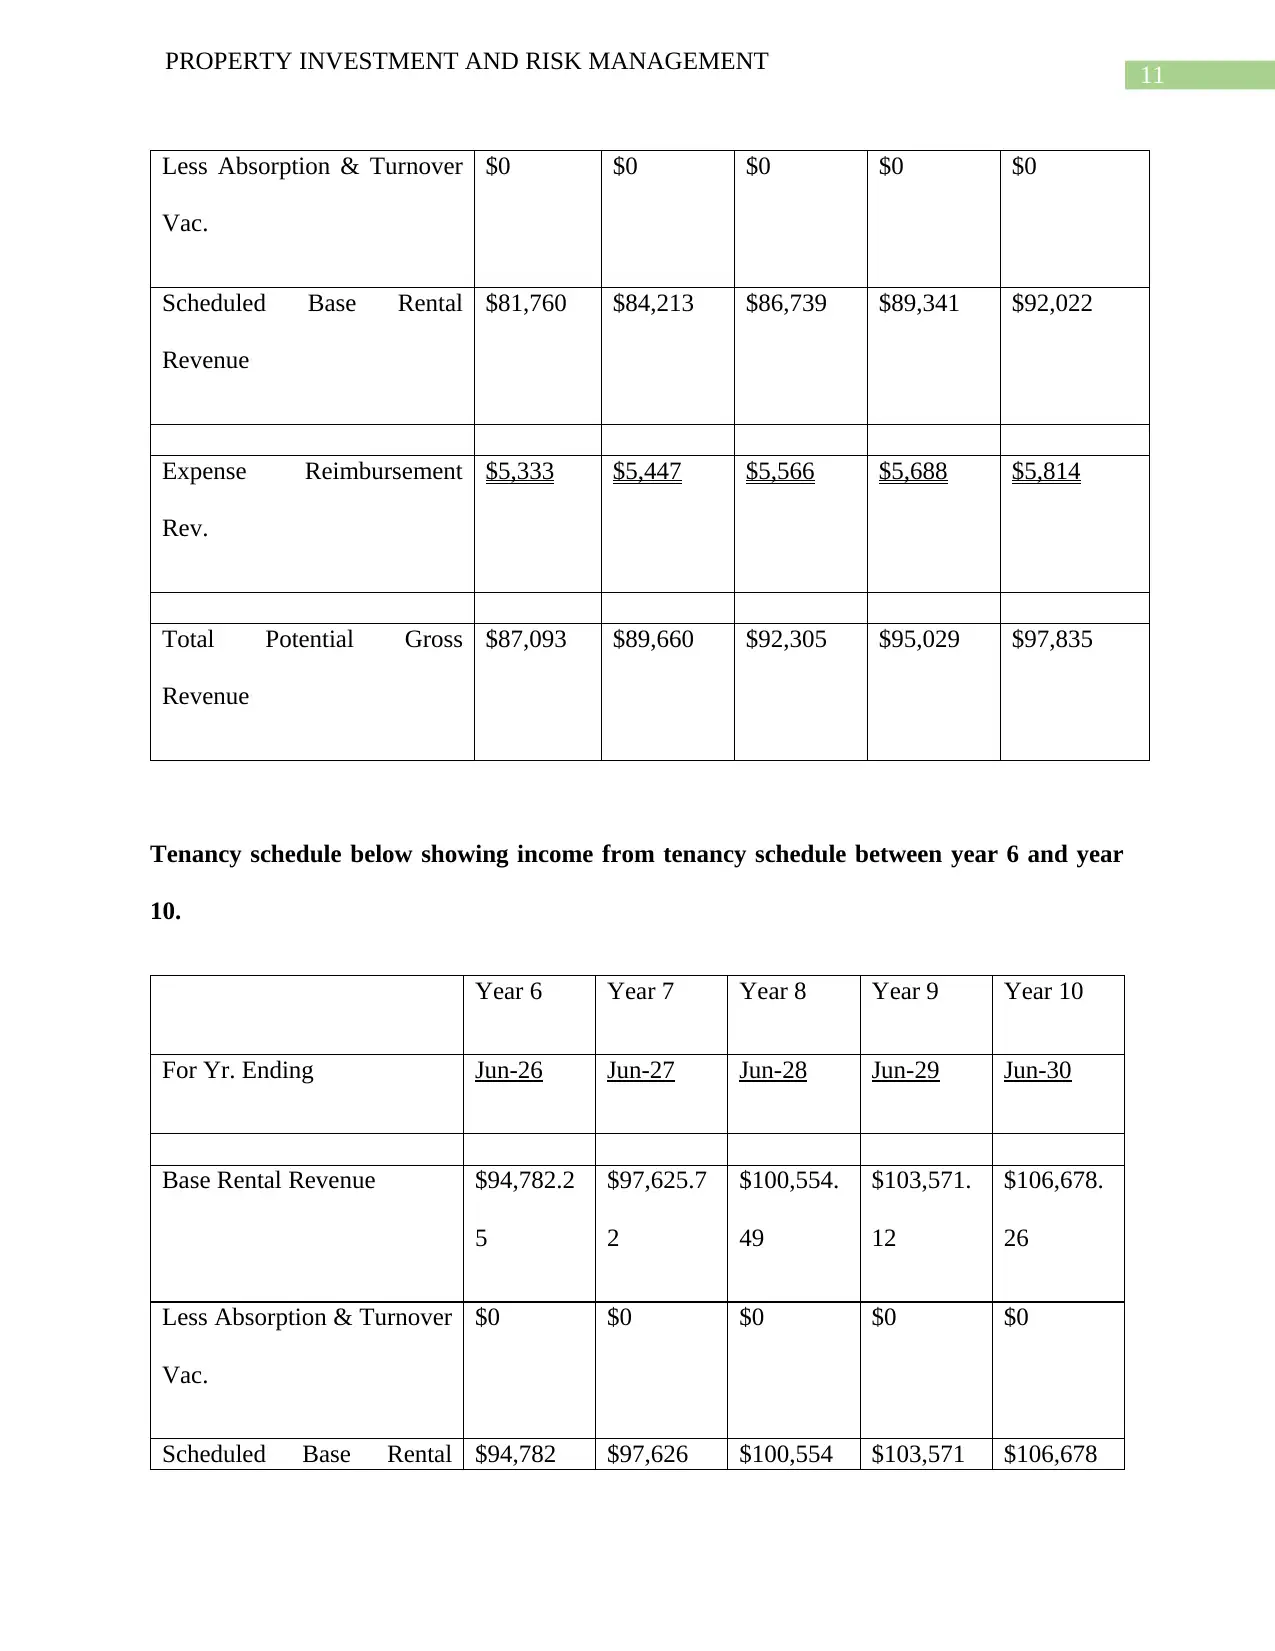
This report presents a detailed investment analysis of a property located at 5/17 Lydbrook Street, Westmead, NSW, considering its potential as an office building for small and medium-sized organizations. The analysis utilizes discounted cash flow (DCF) techniques to evaluate the property's financial viability, calculating Net Present Value (NPV) and Internal Rate of Return (IRR) based on market data and assumptions. The report includes input tables outlining property details, tenancy agreements, and financial projections over a ten-year period, including revenue, expenses, and capital costs. It also includes tenancy and outgoing schedules, discount rate schedules, and terminal yield calculations. The analysis projects discounted cash inflows, considering factors like inflation, vacancy rates, and operating expenses to determine the property's profitability and investment potential. The report also touches upon the impact of leverage, risk, and taxation. The report provides a comprehensive overview of the financial aspects of the property investment, aiming to assist investors in making informed decisions.
Document Page
Running head: PROPERTY INVESTMENT AND RISK MANAGEMENT
Property Investment and Risk Management
Name of the Student:
Name of the University:
Authors Note:
tabler-icon-diamond-filled.svg

Paraphrase This Document

Need a fresh take? Get an instant paraphrase of this document with our AI Paraphraser
Document Page
1
PROPERTY INVESTMENT AND RISK MANAGEMENT
Contents
Introduction:....................................................................................................................................2
Investment analysis:.........................................................................................................................2
Leverage, risk and taxation analysis:.............................................................................................28
Conclusion:....................................................................................................................................35
References:....................................................................................................................................37
Document Page
2
PROPERTY INVESTMENT AND RISK MANAGEMENT
Introduction:
Considering the immense demand of office building in Westmead, New South Wales, the 5/17
Lydbrook Street property situated in Westmead NSW can be used to give at rent for official
purposes to small and medium sized organization. Considering that the property in total has 95
square meter in floor area thus, it can definitely be used as an office for small proprietorship or
partnership business. Considering the huge demand of property in the area it is expected that the
property will fetched significant renal to provide the buyer stable return over a long period of
time. A detailed discussion on the credibility of the proposal by ascertaining the net present value
and IRR of the property shall be helpful for the investor to take an appropriate decision in this
matter.
Investment analysis:
Investment analysis is the process of assessing an investment option from the point of view of
the investor to assess whether it would be financially beneficial for the investor to invest in it. In
case an investor has number of different proposals in front of him to invest however, due to lack
of funds he can only make investment in one of those proposals then investment analysis helps in
identifying the most profitable and financially beneficial proposal to make investment (Adler,
2016).
There are number of different techniques and methods that can be used to conduct investment
analysis. Investment appraisal technique is one of the most effective techniques used by the
investors to analyze the potential of different investment proposals. Net present value,
accounting rate of return, pack back period method and internal rate of return are different
techniques used to apprise the potential of investment proposals.
Document Page
3
PROPERTY INVESTMENT AND RISK MANAGEMENT
In this document a detailed discussion shall be provided by calculating expected net present
value and IRR of the investment property. In order to calculate NPV and IRR of the property the
following inputs shall be used. The data provided below in the table has been accumulated after
considering the market situation for similar properties in the region, i.e. Westmead, NSW. In
addition certain assumptions have been made to conduct the investment analysis as these are
essential to the calculation of NPV and IRR for a project (Danazimi Jibril, Toyin J and ., 2018).
Input table 1:
Inputs to calculate projected cash flows
Name of the property: 5/17 Lydbrook Street Westmead
Address of the property: 5/17 Lydbrook Street Westmead New South Wales
2145
Purchase value 480,000.00
Type of property: Office building
Total Building Area (Sq.Ft.): 1,022 95 Square meter
Date of rent period starting: 01 July, 2020
Number of years for the analysis 10
tabler-icon-diamond-filled.svg

Paraphrase This Document

Need a fresh take? Get an instant paraphrase of this document with our AI Paraphraser
Document Page
4
PROPERTY INVESTMENT AND RISK MANAGEMENT
Rate of general inflation 3%
Vacancy rate 0%
Collection loss 0%
Expenses to be reimbursed by the tenant
Maintenance expenses $1.50 per sq. ft. /yr.
Ad Valorem Tax $1,500 per yr.
Insurance on property $0.50 per sq. ft. /yr.
Provision for utilities $1.50 per sq. ft. /yr.
Administrative purpose expenses $0.25 per sq. ft. /yr.
Expenses not to be reimbursed by the tenant
Management expenses 3% of Annual gross rent
Assumptions for Market Leasing
Market Rent $80.00 per sq. ft. /yr.
Allowance for tenancy improvement $2.50 Per s. ft. Per sq. ft.
Length of tenancy agreement 10 Years Years
Document Page
5
PROPERTY INVESTMENT AND RISK MANAGEMENT
Resale Assumptions:
Cap rate for terminal value 15%
Commission to be paid on resale value 5%
Valuation Assumptions:
Rate of discount 10.00%
Input table 2:
Information about tenancy agreement
Tenant
Name of the tenant Damien Haggard
Rent per square foot $80.00
Area of the property 1,022
Term beginning 01 July, 2020
Number of years in the tenancy agreement 10
Discounted cash flows:
Document Page
6
PROPERTY INVESTMENT AND RISK MANAGEMENT
Discounted cash inflow for first five years are provided below:
Year 1 Year 2 Year 3 Year 4 Year 5
Year ending Jun-21 Jun-22 Jun-23 Jun-24 Jun-25
Gross revenue (Expected)
Revenue from rental $81,760 $84,213 $86,739 $89,341 $92,022
Less: Loss in rent due to
vacancy
$0 $0 $0 $0 $0
Total Reimbursement Revenue $5,333 $5,447 $5,566 $5,688 $5,814
Effective Gross Revenue
receivable
$87,093 $89,660 $92,305 $95,029 $97,835
Operating Expenses
Reimbursable Expenses
Maintenance expenses $1,533 $1,579 $1,626 $1,675 $1,725
Ad Valorem Tax (Fixed) $1,500 $1,500 $1,500 $1,500 $1,500
tabler-icon-diamond-filled.svg

Paraphrase This Document

Need a fresh take? Get an instant paraphrase of this document with our AI Paraphraser
Document Page
7
PROPERTY INVESTMENT AND RISK MANAGEMENT
Property Insurance (Fixed) $511 $526 $542 $558 $575
Utilities $1,533 $1,579 $1,626 $1,675 $1,725
Administrative Expense $256 $263 $271 $279 $288
Non-reimbursable Expenses
Management $2,452.80 $2,526.38 $2,602.18 $2,680.24 $2,760.65
Total Operating Expenses $7,785 $7,974 $8,168 $8,368 $8,574
Net Operating Income $79,307 $81,686 $84,137 $86,661 $89,261
Capital cost
Tenant Improvements $1,533 $1,594 $1,658 $1,724 $1,793
Total Capital Costs $1,533 $1,594 $1,658 $1,724 $1,793
Net cash flow after meeting all
expenditures
$77,774 $80,092 $82,479 $84,937 $87,468
Document Page
8
PROPERTY INVESTMENT AND RISK MANAGEMENT
PV factors @10% pa 0.90909090
9
0.826446281 0.75131480
1
0.683013455 0.620921323
Discounted cash inflow (Net) $70,703.82 $66,191.81 $61,967.63 $58,012.91 $54,310.47
Discounted cash inflow from year 6 to year 10:
Year 6 Year 7 Year 8 Year 9 Year 10
Year ending Jun-26 Jun-27 Jun-28 Jun-29 Jun-30
Gross revenue (Expected)
Revenue from rental $94,782 $97,626 $100,554 $103,571 $106,678
Less: Loss due to vacancy $0 $0 $0 $0 $0
Total Reimbursement Revenue $5,943 $6,076 $6,213 $6,355 $6,501
Effective Gross Revenue
receivable
$100,725 $103,702 $106,768 $109,926 $113,179
Operating Expenses
Reimbursable Expenses
Document Page
9
PROPERTY INVESTMENT AND RISK MANAGEMENT
Maintenance expenses $1,777 $1,830 $1,885 $1,942 $2,000
Ad Valorem Tax (Fixed) $1,500 $1,500 $1,500 $1,500 $1,500
Property Insurance (Fixed) $592 $610 $628 $647 $667
Utilities $1,777 $1,830 $1,885 $1,942 $2,000
Administrative Expense $296 $305 $314 $324 $333
Non-reimbursable Expenses
Management $2,843.47 $2,928.77 $3,016.63 $3,107.13 $3,200.35
Total Operating Expenses $8,786 $9,005 $9,230 $9,462 $9,701
Net Operating Income $91,939 $94,697 $97,538 $100,464 $103,478
Capital cost
Tenant Improvements $1,865 $1,940 $2,017 $2,098 $2,182
Total Capital Costs $1,865 $1,940 $2,017 $2,098 $2,182
Net cash flow after meeting all $90,074 $92,757 $95,521 $98,366 $101,296
tabler-icon-diamond-filled.svg

Paraphrase This Document

Need a fresh take? Get an instant paraphrase of this document with our AI Paraphraser
Document Page
10
PROPERTY INVESTMENT AND RISK MANAGEMENT
expenditures
PV factors @10% pa 0.56447393 0.513158118 0.4665073
8
0.424097618 0.385543289
Discounted cash inflow (Net) $50,844.23 $47,599.12 $44,561.03 $41,716.77 $39,053.98
Discounted cash inflow in the above table have been calculated by using 10% rate of discount
(Drury and Tayles, 2016).
Tenancy schedule:
Income:
Tenancy schedule below showing income from tenancy schedule between year 1 and year 5.
Year 1 Year 2 Year 3 Year 4 Year 5
For Yr. Ending Jun-21 Jun-22 Jun-23 Jun-24 Jun-25
Base Rental Revenue $81,760 $84,212.8
0
$86,739.1
8
$89,341.3
6
$92,021.60
Document Page
11
PROPERTY INVESTMENT AND RISK MANAGEMENT
Less Absorption & Turnover
Vac.
$0 $0 $0 $0 $0
Scheduled Base Rental
Revenue
$81,760 $84,213 $86,739 $89,341 $92,022
Expense Reimbursement
Rev.
$5,333 $5,447 $5,566 $5,688 $5,814
Total Potential Gross
Revenue
$87,093 $89,660 $92,305 $95,029 $97,835
Tenancy schedule below showing income from tenancy schedule between year 6 and year
10.
Year 6 Year 7 Year 8 Year 9 Year 10
For Yr. Ending Jun-26 Jun-27 Jun-28 Jun-29 Jun-30
Base Rental Revenue $94,782.2
5
$97,625.7
2
$100,554.
49
$103,571.
12
$106,678.
26
Less Absorption & Turnover
Vac.
$0 $0 $0 $0 $0
Scheduled Base Rental $94,782 $97,626 $100,554 $103,571 $106,678
chevron_up_icon
1 out of 39
circle_padding
hide_on_mobile
zoom_out_icon
[object Object]