PSY 335 Interpreting Statistics Worksheet

Verified

Added on  2019/09/16

|3
|314
|876
Homework Assignment
AI Summary
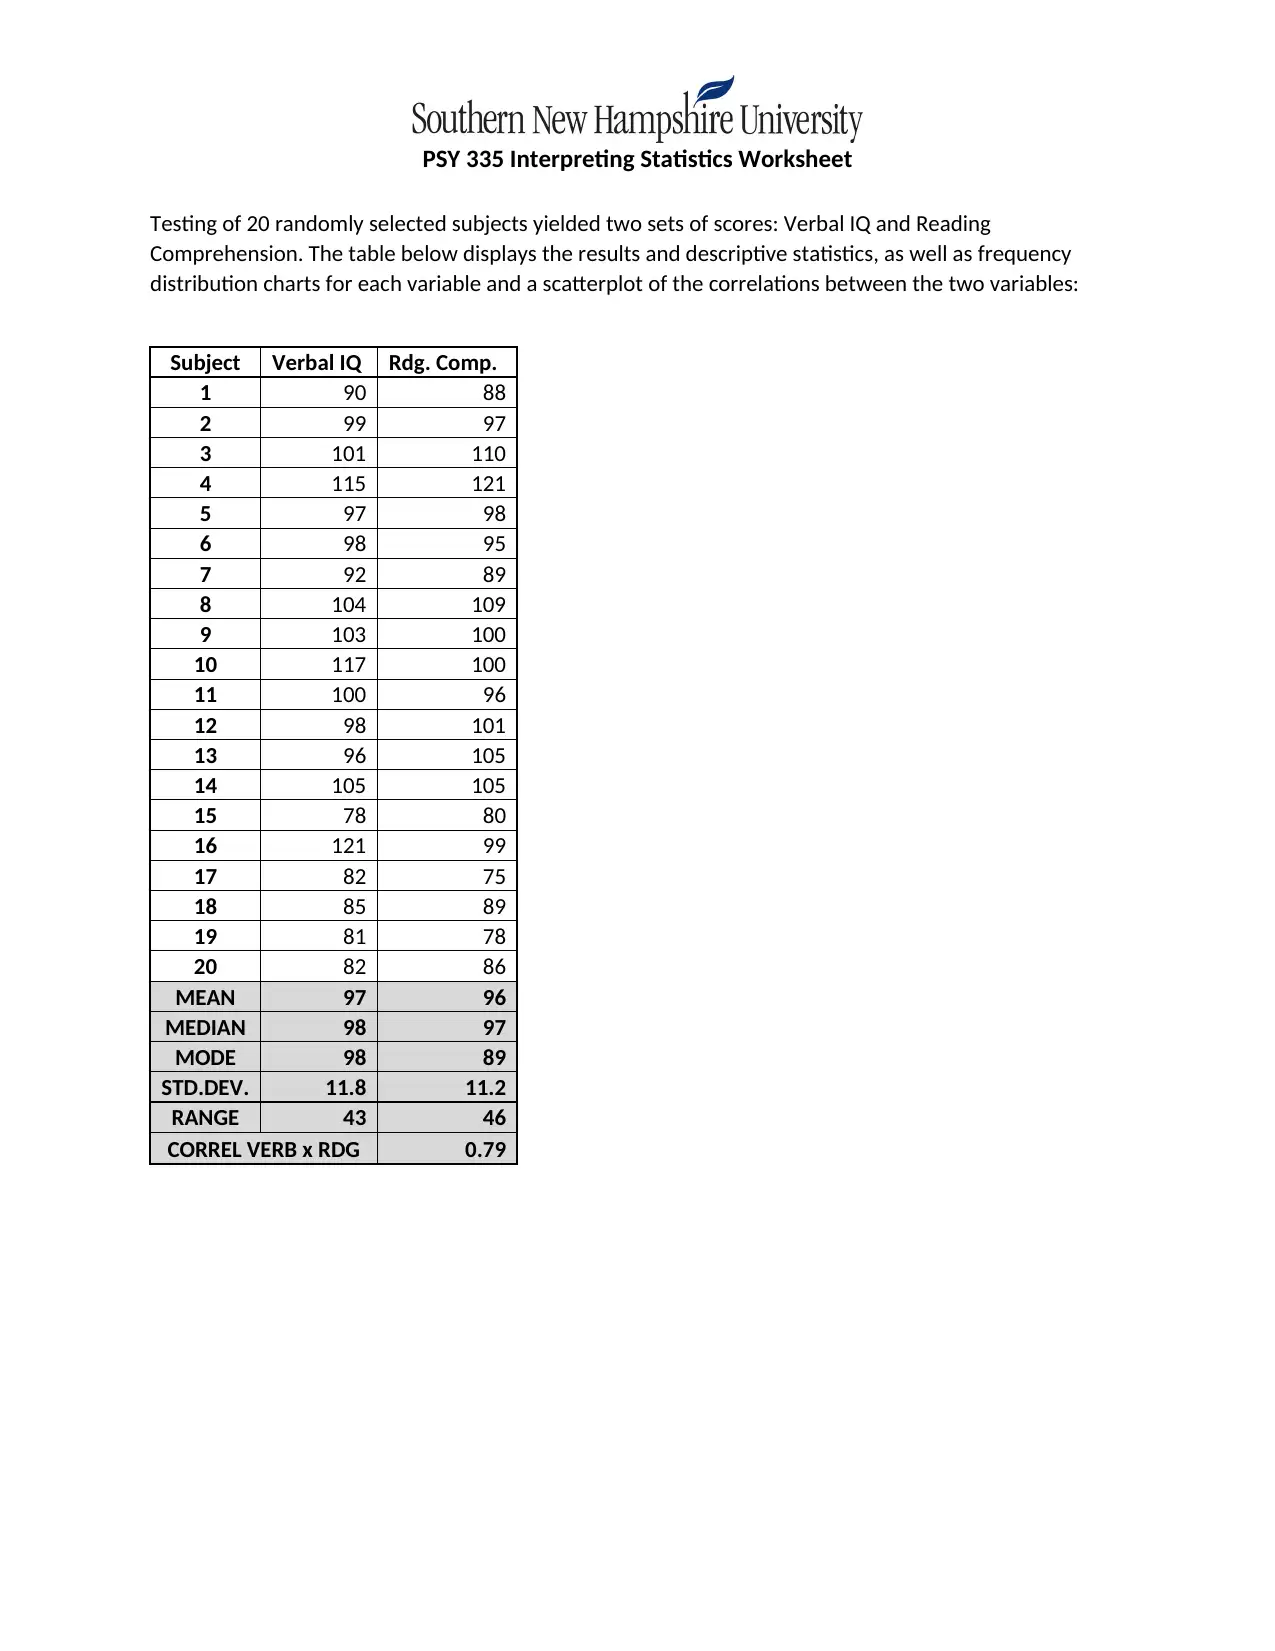
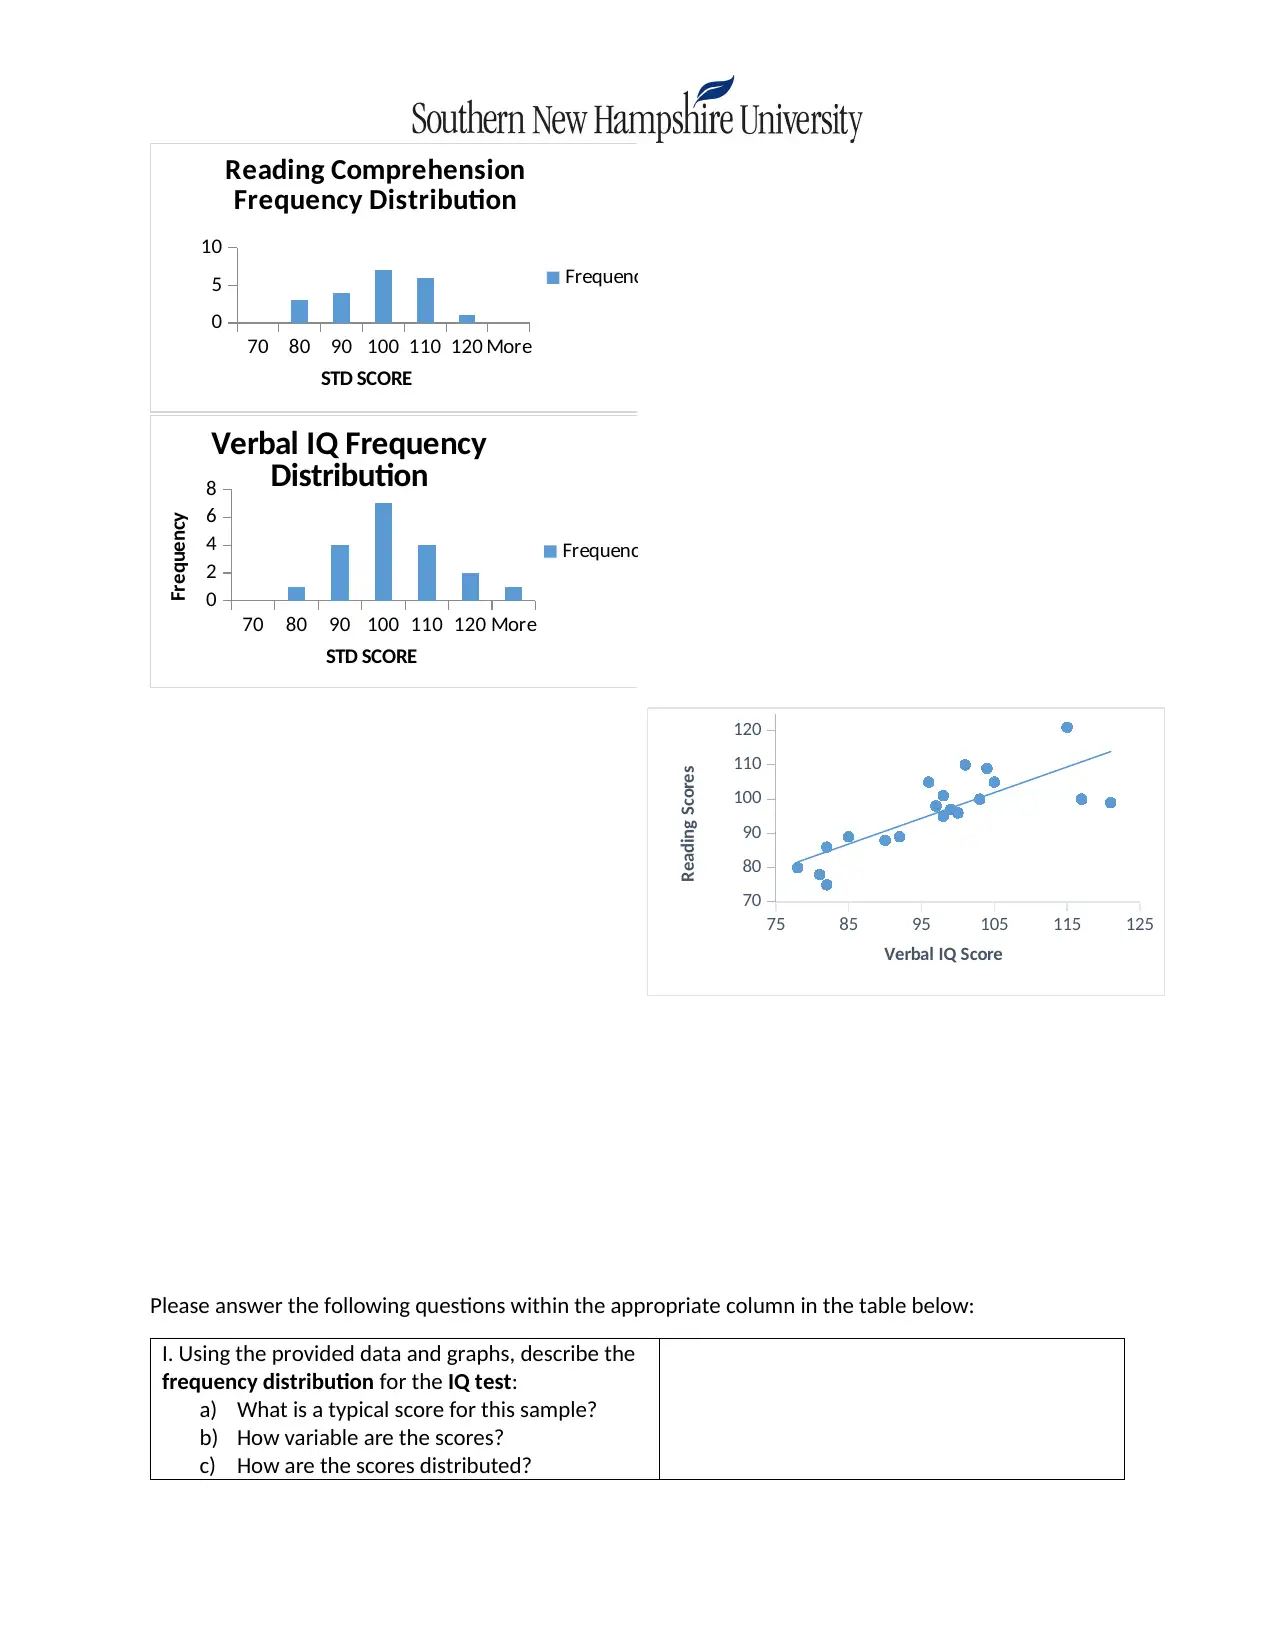
This document presents a solved homework assignment for PSY 335, focusing on interpreting statistical data related to Verbal IQ and Reading Comprehension scores. The assignment includes descriptive statistics, frequency distributions, and correlation analysis. It also requires an evaluation of the data from a psychological testing perspective, addressing sample representativeness and the implications of the correlation results. The solutions provide detailed answers to questions about typical scores, variability, distribution, and the relationship between IQ and reading achievement.
Document Page
PSY 335 Interpreting Statistics Worksheet
Testing of 20 randomly selected subjects yielded two sets of scores: Verbal IQ and Reading
Comprehension. The table below displays the results and descriptive statistics, as well as frequency
distribution charts for each variable and a scatterplot of the correlations between the two variables:
Subject Verbal IQ Rdg. Comp.
1 90 88
2 99 97
3 101 110
4 115 121
5 97 98
6 98 95
7 92 89
8 104 109
9 103 100
10 117 100
11 100 96
12 98 101
13 96 105
14 105 105
15 78 80
16 121 99
17 82 75
18 85 89
19 81 78
20 82 86
MEAN 97 96
MEDIAN 98 97
MODE 98 89
STD.DEV. 11.8 11.2
RANGE 43 46
CORREL VERB x RDG 0.79
tabler-icon-diamond-filled.svg

Paraphrase This Document

Need a fresh take? Get an instant paraphrase of this document with our AI Paraphraser
Document Page
70 80 90 100 110 120 More
0
5
10
Reading Comprehension
Frequency Distribution
Frequency
STD SCORE
70 80 90 100 110 120 More
0
2
4
6
8
Verbal IQ Frequency
Distribution
Frequency
STD SCORE
Frequency
75 85 95 105 115 125
70
80
90
100
110
120
Verbal IQ Score
Reading Scores
Please answer the following questions within the appropriate column in the table below:
I. Using the provided data and graphs, describe the
frequency distribution for the IQ test:
a) What is a typical score for this sample?
b) How variable are the scores?
c) How are the scores distributed?
Document Page
II. Using the provided data and graphs, describe the
frequency distribution of the reading test scores:
a) What is a typical score for this sample?
b) How variable are the scores?
c) How are the scores distributed?
III. Consider the correlation data given the provided
data and graph:
a) How are IQ and reading achievement
related?
IV. Evaluate the data from a psychological testing
perspective:
a) Are these samples good representations of
the general population? How do you know?
b) What could you do to make them a more
representative sample?
c) How would you interpret the correlation
results?
d) What are some ways this knowledge of
their relationship could be used?
chevron_up_icon
1 out of 3
circle_padding
hide_on_mobile
zoom_out_icon
[object Object]