PSYC 2525: Z-Tests, Hypothesis Testing, Type I & II Errors Analysis

Verified

Added on  2023/06/07

|5
|550
|259
Homework Assignment
AI Summary
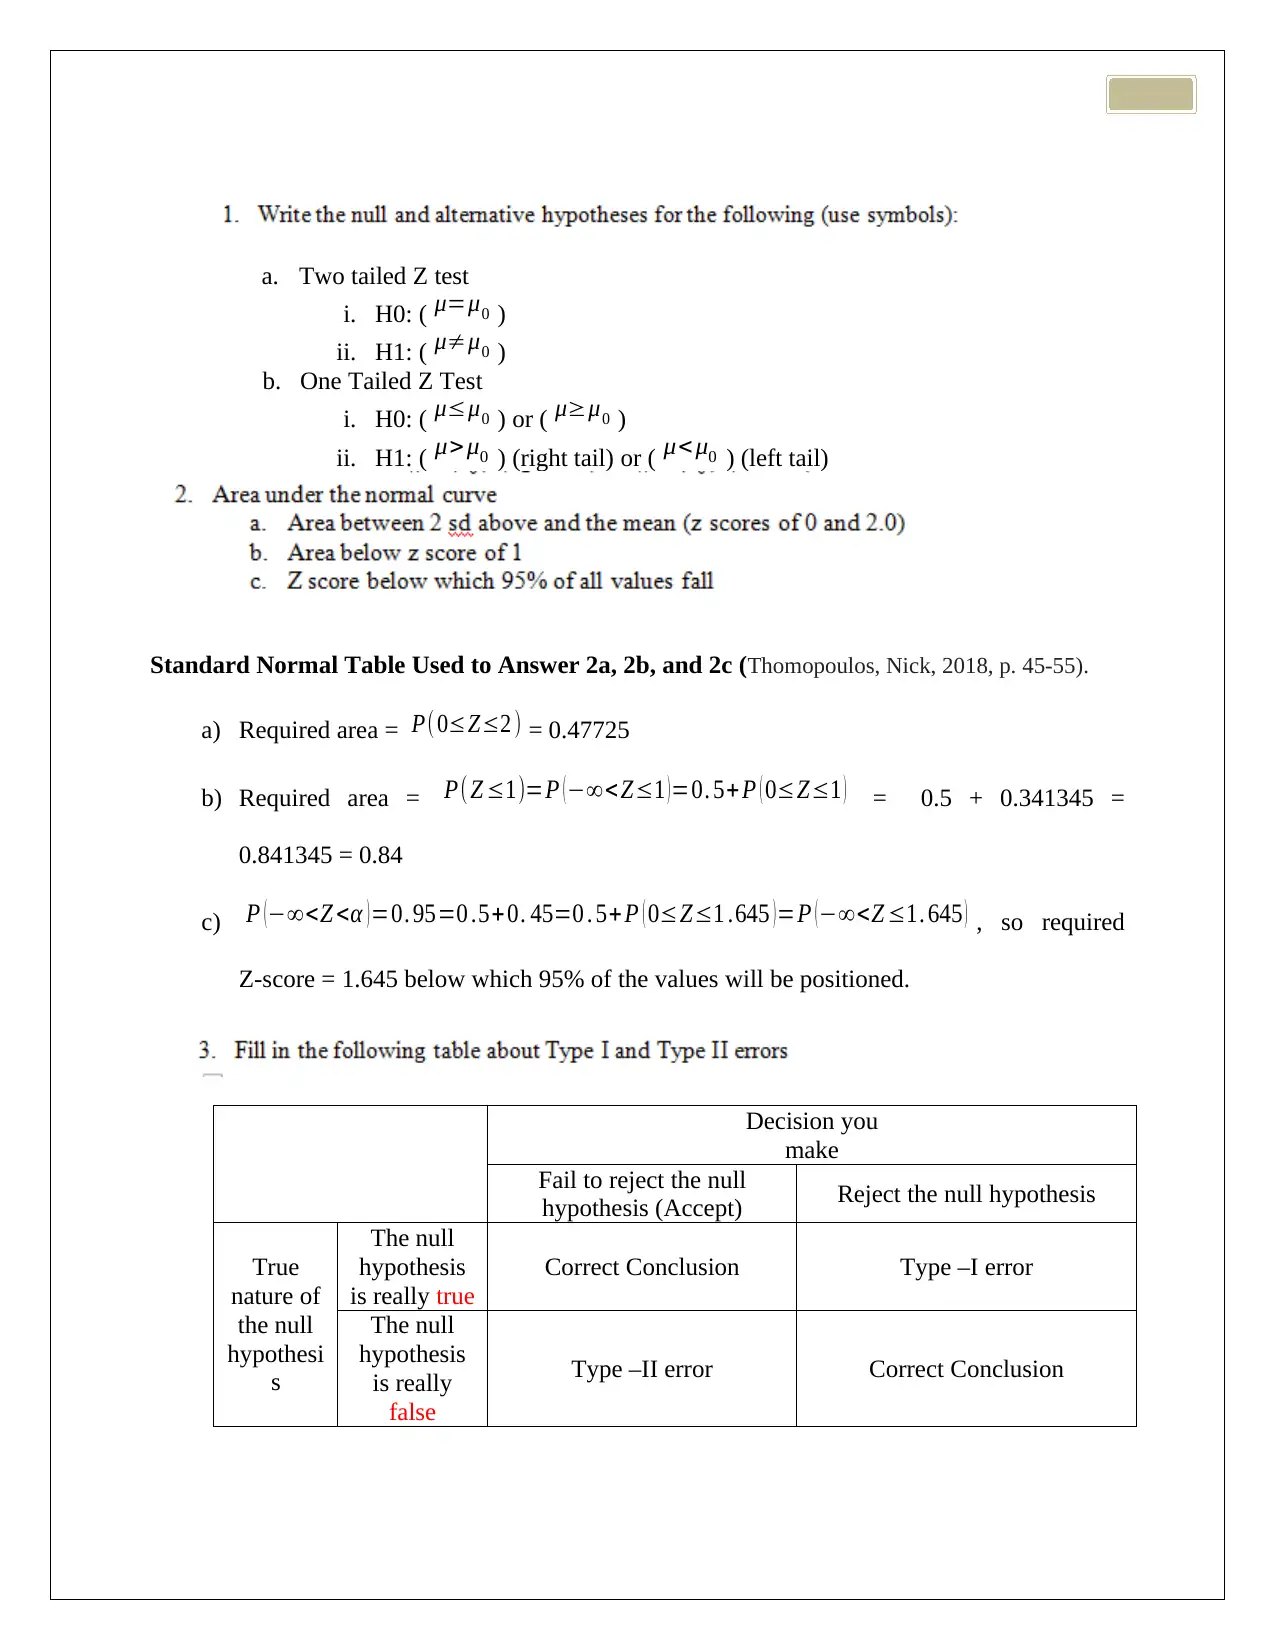
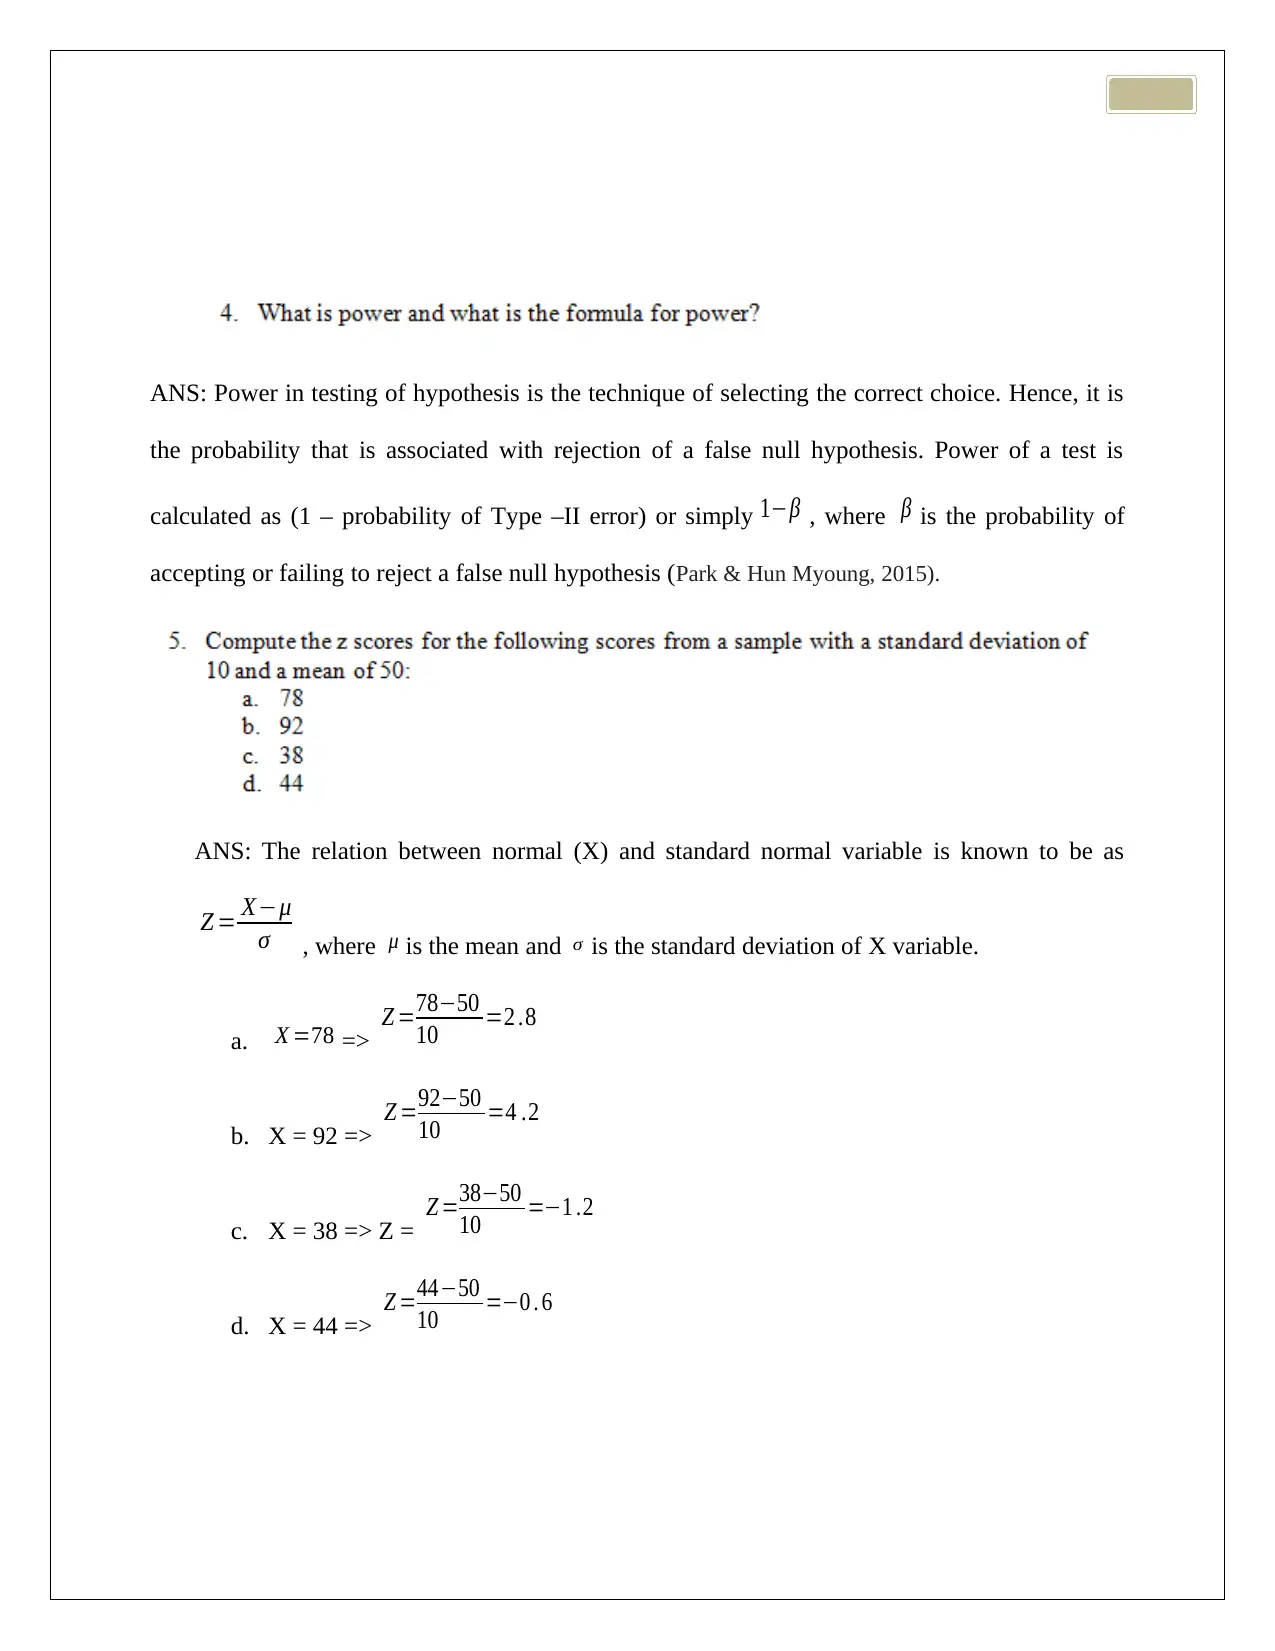
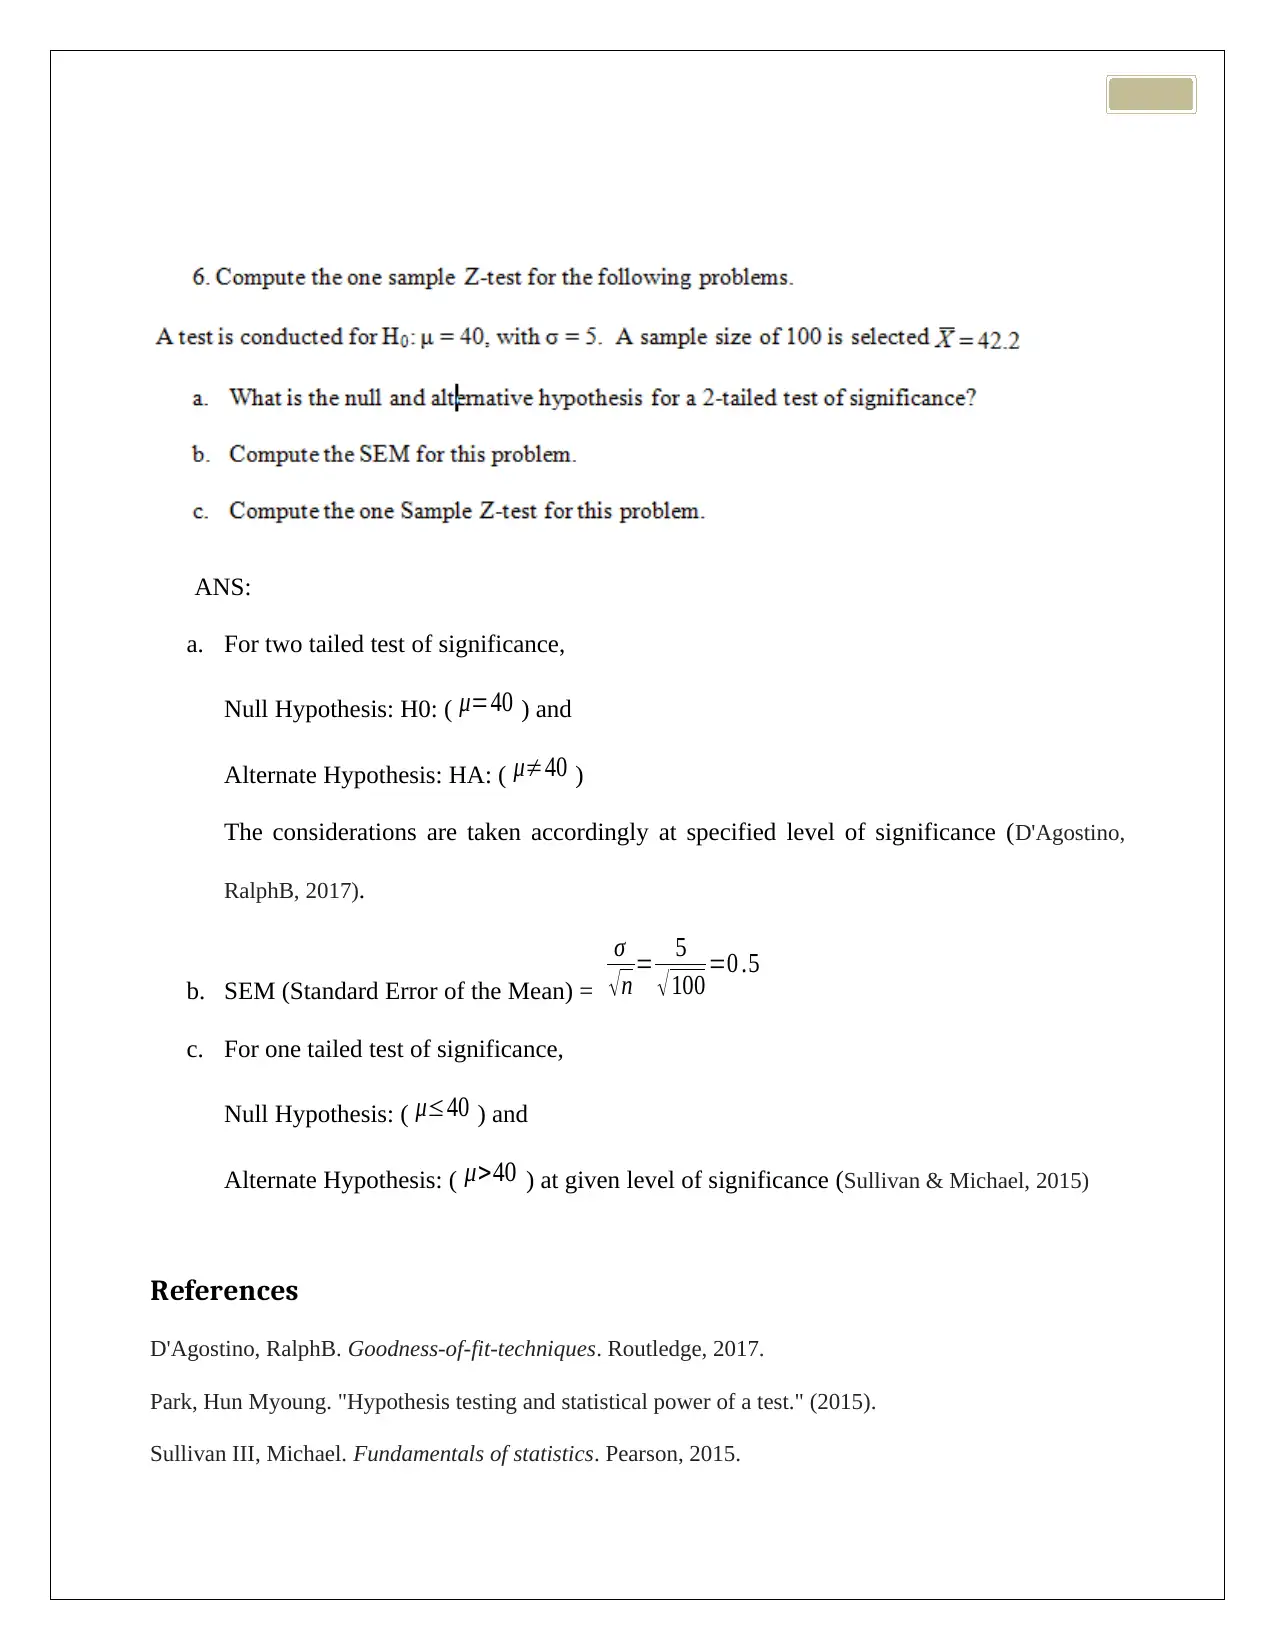
This assignment for PSYC 2525 delves into hypothesis testing using Z-tests, covering both two-tailed and one-tailed tests. It includes the formulation of null and alternative hypotheses, calculation of areas under the normal curve, and determination of Z-scores. The assignment further examines Type I and Type II errors, defining statistical power and its formula. Practical application is demonstrated through computing Z-scores for given values based on a sample mean and standard deviation. Finally, the solution calculates a one-sample Z-test, determining the null and alternative hypotheses, standard error of the mean (SEM), and conducting the test at a specified significance level. Desklib provides access to similar assignments and study tools to aid student learning.
Document Page
Assignment 2
PSYC 2525
tabler-icon-diamond-filled.svg

Paraphrase This Document

Need a fresh take? Get an instant paraphrase of this document with our AI Paraphraser
Document Page
a. Two tailed Z test
i. H0: ( μ=μ0 )
ii. H1: ( μμ0 )
b. One Tailed Z Test
i. H0: ( μμ0 ) or ( μμ0 )
ii. H1: ( μ> μ0 ) (right tail) or ( μ< μ0 ) (left tail)
Standard Normal Table Used to Answer 2a, 2b, and 2c (Thomopoulos, Nick, 2018, p. 45-55).
a) Required area = P( 0Z2 ) = 0.47725
b) Required area = P( Z 1)=P ( <Z1 ) =0. 5+ P ( 0Z1 ) = 0.5 + 0.341345 =
0.841345 = 0.84
c) P ( <Z <α ) =0. 95=0 .5+0. 45=0 . 5+P ( 0Z1 .645 ) =P ( <Z 1. 645 ) , so required
Z-score = 1.645 below which 95% of the values will be positioned.
Decision you
make
Fail to reject the null
hypothesis (Accept) Reject the null hypothesis
True
nature of
the null
hypothesi
s
The null
hypothesis
is really true
Correct Conclusion Type –I error
The null
hypothesis
is really
false
Type –II error Correct Conclusion
Document Page
ANS: Power in testing of hypothesis is the technique of selecting the correct choice. Hence, it is
the probability that is associated with rejection of a false null hypothesis. Power of a test is
calculated as (1 – probability of Type –II error) or simply 1β , where β is the probability of
accepting or failing to reject a false null hypothesis (Park & Hun Myoung, 2015).
ANS: The relation between normal (X) and standard normal variable is known to be as
Z = Xμ
σ , where μ is the mean and σ is the standard deviation of X variable.
a. X =78 => Z =7850
10 =2 .8
b. X = 92 => Z =9250
10 =4 .2
c. X = 38 => Z = Z =3850
10 =1 .2
d. X = 44 => Z =4450
10 =0 . 6
Document Page
ANS:
a. For two tailed test of significance,
Null Hypothesis: H0: ( μ=40 ) and
Alternate Hypothesis: HA: ( μ40 )
The considerations are taken accordingly at specified level of significance (D'Agostino,
RalphB, 2017).
b. SEM (Standard Error of the Mean) =
σ
n = 5
100 =0 .5
c. For one tailed test of significance,
Null Hypothesis: ( μ40 ) and
Alternate Hypothesis: ( μ>40 ) at given level of significance (Sullivan & Michael, 2015)
References
D'Agostino, RalphB. Goodness-of-fit-techniques. Routledge, 2017.
Park, Hun Myoung. "Hypothesis testing and statistical power of a test." (2015).
Sullivan III, Michael. Fundamentals of statistics. Pearson, 2015.
tabler-icon-diamond-filled.svg

Paraphrase This Document

Need a fresh take? Get an instant paraphrase of this document with our AI Paraphraser
Document Page
Thomopoulos, Nick T. "Standard Normal." Probability Distributions. Springer, Cham, 2018. 45-55.
chevron_up_icon
1 out of 5
circle_padding
hide_on_mobile
zoom_out_icon
[object Object]