Psychological Distress Analysis for MAT1004
VerifiedAdded on 2020/03/15
|13
|2377
|65
Report
AI Summary
This report analyzes psychological distress among students in MAT1004, focusing on stress levels during exams compared to the general population. It examines correlations between BMI and distress, gender differences, and offers recommendations for reducing stress through counseling and extracurricular activities.
Running head: PSYCHOLOGICAL DISTRESS
Psychological Distress: Analytical Approach
Name
Course Number
Date
Faculty Name
Psychological Distress: Analytical Approach
Name
Course Number
Date
Faculty Name
Paraphrase This Document
Need a fresh take? Get an instant paraphrase of this document with our AI Paraphraser
PSYCHOLOGICAL DISTRESS
Abstract
This report focuses on an analytical approach of students’ psychological distress for MAT1004. The project relies on a
phenomenon that students are more stressed during exam periods compared to other occasions. Several hypotheses were tested,
hence compiling the report in favour of factors influencing high distress level. In comparison to the general population, students
were found to be more stressed based on the proportion of students experiencing high and very high distress levels. It was found
that Body Mass Index of a student is positively correlated to high distress level. In general, female students were found to be less
stressed, indicating that the male counterparts are highly affected by factors contributing to distress.
PSYCHOLOGICAL DISTRESS
Table of Contents
Table of Figures..........................................................................................................................................................3
Table of Tables...........................................................................................................................................................3
1. Introduction............................................................................................................................................................4
1.1 Research questions..........................................................................................................................................4
2. Methods..................................................................................................................................................................4
3. Results & Discussions............................................................................................................................................5
3.1 How students balance university life..............................................................................................................5
3.2 Proportion of students with high and very high distress levels.......................................................................5
3.3 Relationship between BMI, waist size and distress level................................................................................7
3.4 Mean Psychological Distress..........................................................................................................................9
4. Conclusion............................................................................................................................................................11
5. Recommendations................................................................................................................................................11
References...............................................................................................................................................................12
Table of Figures
Figure 1: BMI by K10 total scatter plot............................................................................................................................7
Figure 2: Scatterplot of Waist size by Psychological Distress..........................................................................................8
Figure 3: Boxplot for Psychological distress by Gender...................................................................................................9
Table of Tables
Table 1: Frequency table for K10_Level........................................................................................................................6
Table 2: One sample t-test output...................................................................................................................................6
Table 3: Cross tabulation for gender and distress level...................................................................................................6
Table 4: Chi-Square test table.........................................................................................................................................6
Table 5: Correlation table between BMI and K10 total..................................................................................................8
Table 6: Correlation between Waist size and psychological distress..............................................................................8
Table 7: Independent sample test for psychological distress by Gender.........................................................................9
Table 8: Psychological distress levels by degree 12 and 17..........................................................................................10
⊘ This is a preview!⊘
Do you want full access?
Subscribe today to unlock all pages.
Trusted by 1+ million students worldwide
PSYCHOLOGICAL DISTRESS
Psychological Distress: Analytical Approach
1. Introduction
People react differently to external pressures that affect an individual’s peace of mind. In this cases, we
are focusing on the psychological distress that student goes through their times in school. Academic
timetables are structured in such a way that students are taught in a predefined period then examinations
conducted to make evaluations for purposes of ratings. It is presumed that students would be at ease when
they are being taught but the academic temperatures increase towards the exam time. However, these factors
affect the students’ different based on personal views of the exams, ambitions and levels of understanding.
Despite the fact that students’ stress levels rise during exams, it cannot be fully concluded that they are
stress-free when there are no exams (Rieber, 2009). This paper will focus on making direct comparisons
between students and the general population on distress levels.
1.1 Research questions
i. Is the proportion of students with high distress greater than the general population?
ii. How do the students achieve balance in their university live?
iii. Is there a significant difference in proportions of female and male in the elevated distress
category?
iv. Is there a relationship between BMI and psychological distress in the students in MAT1004,
semester 2, 2017?
v. Is there a relationship between the waist size of a student and the psychological distress level?
vi. Is there a significant difference in mean psychological distress levels between males and female
students?
vii. Is there a significant difference in mean psychological distress levels between students enrolled
in degree 12 and 17?
2. Methods
The methods to be used in answering the research questions are either parametric or non-parametric
based on whether the data is normally distributed or not. Therefore, for the cases of a continuous variable,
histograms will first be plotted to check normality based on the distribution. Therefore, the test will follow
to answer the question. The first research question will be answered by using proportion test to determine
whether there is a difference between the students having higher distress compared to the others. Qualitative
Paraphrase This Document
Need a fresh take? Get an instant paraphrase of this document with our AI Paraphraser
PSYCHOLOGICAL DISTRESS
analysis will be used to determine how the students achieve balance in the university based on the fact there
other factors leading to distress.
Independent t-test for proportions will also be used to determine whether there is a significant difference
between male and female student on distress levels. To answer this question, a dummy will be created to
represent those having elevated distress as one category. Therefore, a test will be undertaken to determine
whether there is a significant difference in the proportion of the female and male students having high
distress levels.
Correlation test will be performed to test whether BMI and psychological distress levels are related. A
scatter plot will first be plotted to graphically show the nature of the relationship. Therefore, research
question four will be answered by linear regression or correlation test. Question five and six will be
answered by using two-independent sample t-test for the mean of psychological distress for the respective
groups.
3. Results & Discussions
3.1 How students balance university life
Based on thematic analysis of the qualitative variable of how students achieve balance in their university
life; most of the students prefer spending time with family, friends, pets, and extra-curricular activities
among other ways. This depends on one’s personality, like and preferences; hence having variations on how
the students prefer to reduce stress levels for time well spent. Based on the students’ response, the five top
probable top most ways used in balancing university life are listed below.
i. Spending quality time with family.
ii. Friends
iii. Gym, physical exercises and extra-curricular activities
iv. Nature walks, movies and video games
v. Sleeping
3.2 Proportion of students with high and very high distress levels
According to the existing statistics, in 2014-2015, the proportion of people aged above 18 years who had
high and very high distress in Australia was 0.117 (National Health Survey, 2017). Therefore, we will test
whether this is different from the students in MAT1004, second semester, 2017. The hypothesis for the first
PSYCHOLOGICAL DISTRESS
question will be a proportion test to determine whether there is a difference between the general population
and students (Meyers, Gamst & Guarino, 2013).
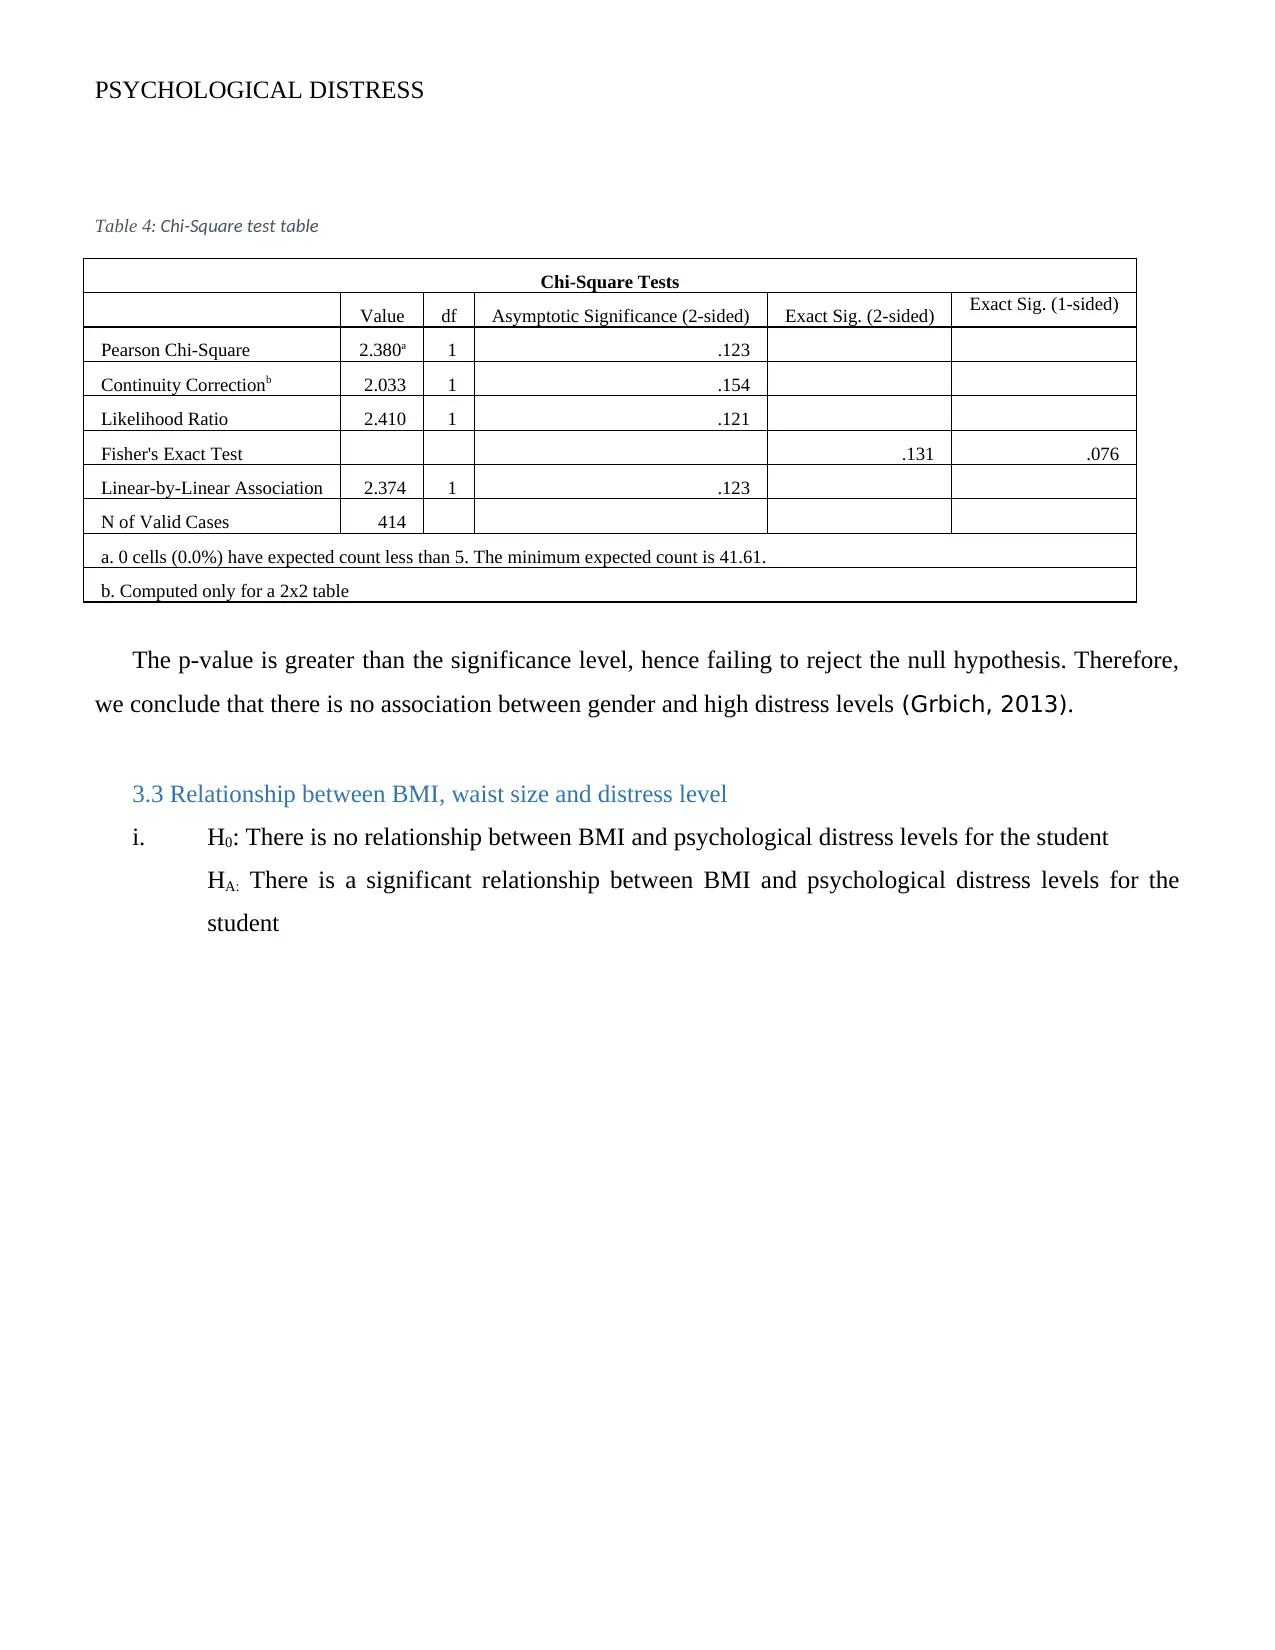
i. H0: P (students with high and very high distress) = 0.117
HA: P (students with high and very high distress) ≠ 0.117
Table 1: Frequency table for K10_Level
K10_level
Frequency Percent Valid Percent Cumulative Percent
Valid Low 241 57.1 58.1 58.1
High 174 41.2 41.9 100.0
Total 415 98.3 100.0
Missing System 7 1.7
Total 422 100.0
One-Sample Statistics
N Mean Std. Deviation Std. Error Mean
K10_level 415 .42 .494 .024
Table 2: One sample t-test output
One-Sample Test
Test Value = 0.117
t df Sig. (2-tailed) Mean Difference 95% Confidence Interval of the Difference
Lower Upper
K10_level 12.464 414 .000 .302 .25 .35
The significance level for the test is less than 0.001, hence rejecting the null hypothesis and concluding
that the proportion of students having high distress levels for the MAT1004 class is not the same to the
general population.
ii. H0: There is no association between gender of the students and high levels of distress
Table 3: Cross tabulation for gender and distress level
Gender * K10_level Crosstabulation
Count
K10_level Total
Low High
Gender Male 176 139 315
Female 64 35 99
Total 240 174 414
question will be a proportion test to determine whether there is a difference between the general population
and students (Meyers, Gamst & Guarino, 2013).
i. H0: P (students with high and very high distress) = 0.117
HA: P (students with high and very high distress) ≠ 0.117
Table 1: Frequency table for K10_Level
K10_level
Frequency Percent Valid Percent Cumulative Percent
Valid Low 241 57.1 58.1 58.1
High 174 41.2 41.9 100.0
Total 415 98.3 100.0
Missing System 7 1.7
Total 422 100.0
One-Sample Statistics
N Mean Std. Deviation Std. Error Mean
K10_level 415 .42 .494 .024
Table 2: One sample t-test output
One-Sample Test
Test Value = 0.117
t df Sig. (2-tailed) Mean Difference 95% Confidence Interval of the Difference
Lower Upper
K10_level 12.464 414 .000 .302 .25 .35
The significance level for the test is less than 0.001, hence rejecting the null hypothesis and concluding
that the proportion of students having high distress levels for the MAT1004 class is not the same to the
general population.
ii. H0: There is no association between gender of the students and high levels of distress
Table 3: Cross tabulation for gender and distress level
Gender * K10_level Crosstabulation
Count
K10_level Total
Low High
Gender Male 176 139 315
Female 64 35 99
Total 240 174 414
⊘ This is a preview!⊘
Do you want full access?
Subscribe today to unlock all pages.
Trusted by 1+ million students worldwide
PSYCHOLOGICAL DISTRESS
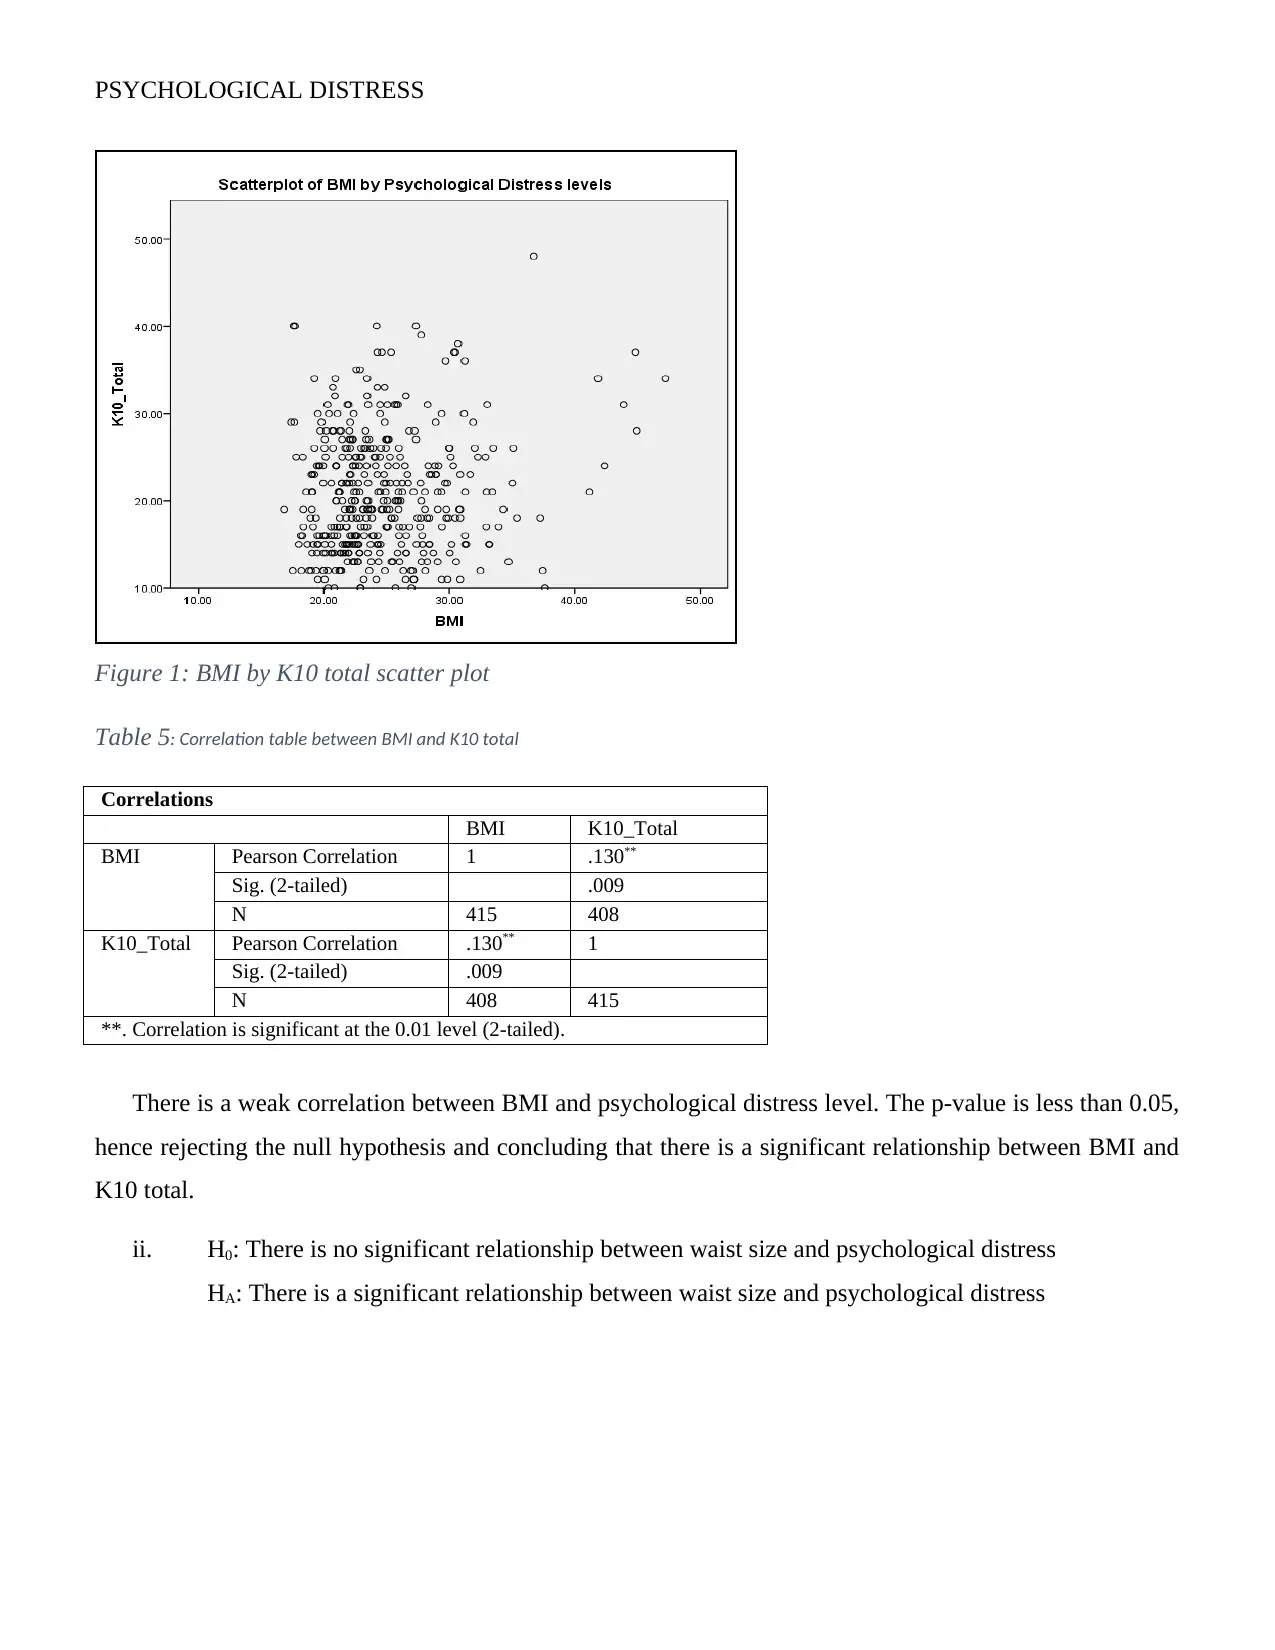
Table 4: Chi-Square test table
Chi-Square Tests
Value df Asymptotic Significance (2-sided) Exact Sig. (2-sided) Exact Sig. (1-sided)
Pearson Chi-Square 2.380a 1 .123
Continuity Correctionb 2.033 1 .154
Likelihood Ratio 2.410 1 .121
Fisher's Exact Test .131 .076
Linear-by-Linear Association 2.374 1 .123
N of Valid Cases 414
a. 0 cells (0.0%) have expected count less than 5. The minimum expected count is 41.61.
b. Computed only for a 2x2 table
The p-value is greater than the significance level, hence failing to reject the null hypothesis. Therefore,
we conclude that there is no association between gender and high distress levels (Grbich, 2013).
3.3 Relationship between BMI, waist size and distress level
i. H0: There is no relationship between BMI and psychological distress levels for the student
HA: There is a significant relationship between BMI and psychological distress levels for the
student
Paraphrase This Document
Need a fresh take? Get an instant paraphrase of this document with our AI Paraphraser
PSYCHOLOGICAL DISTRESS
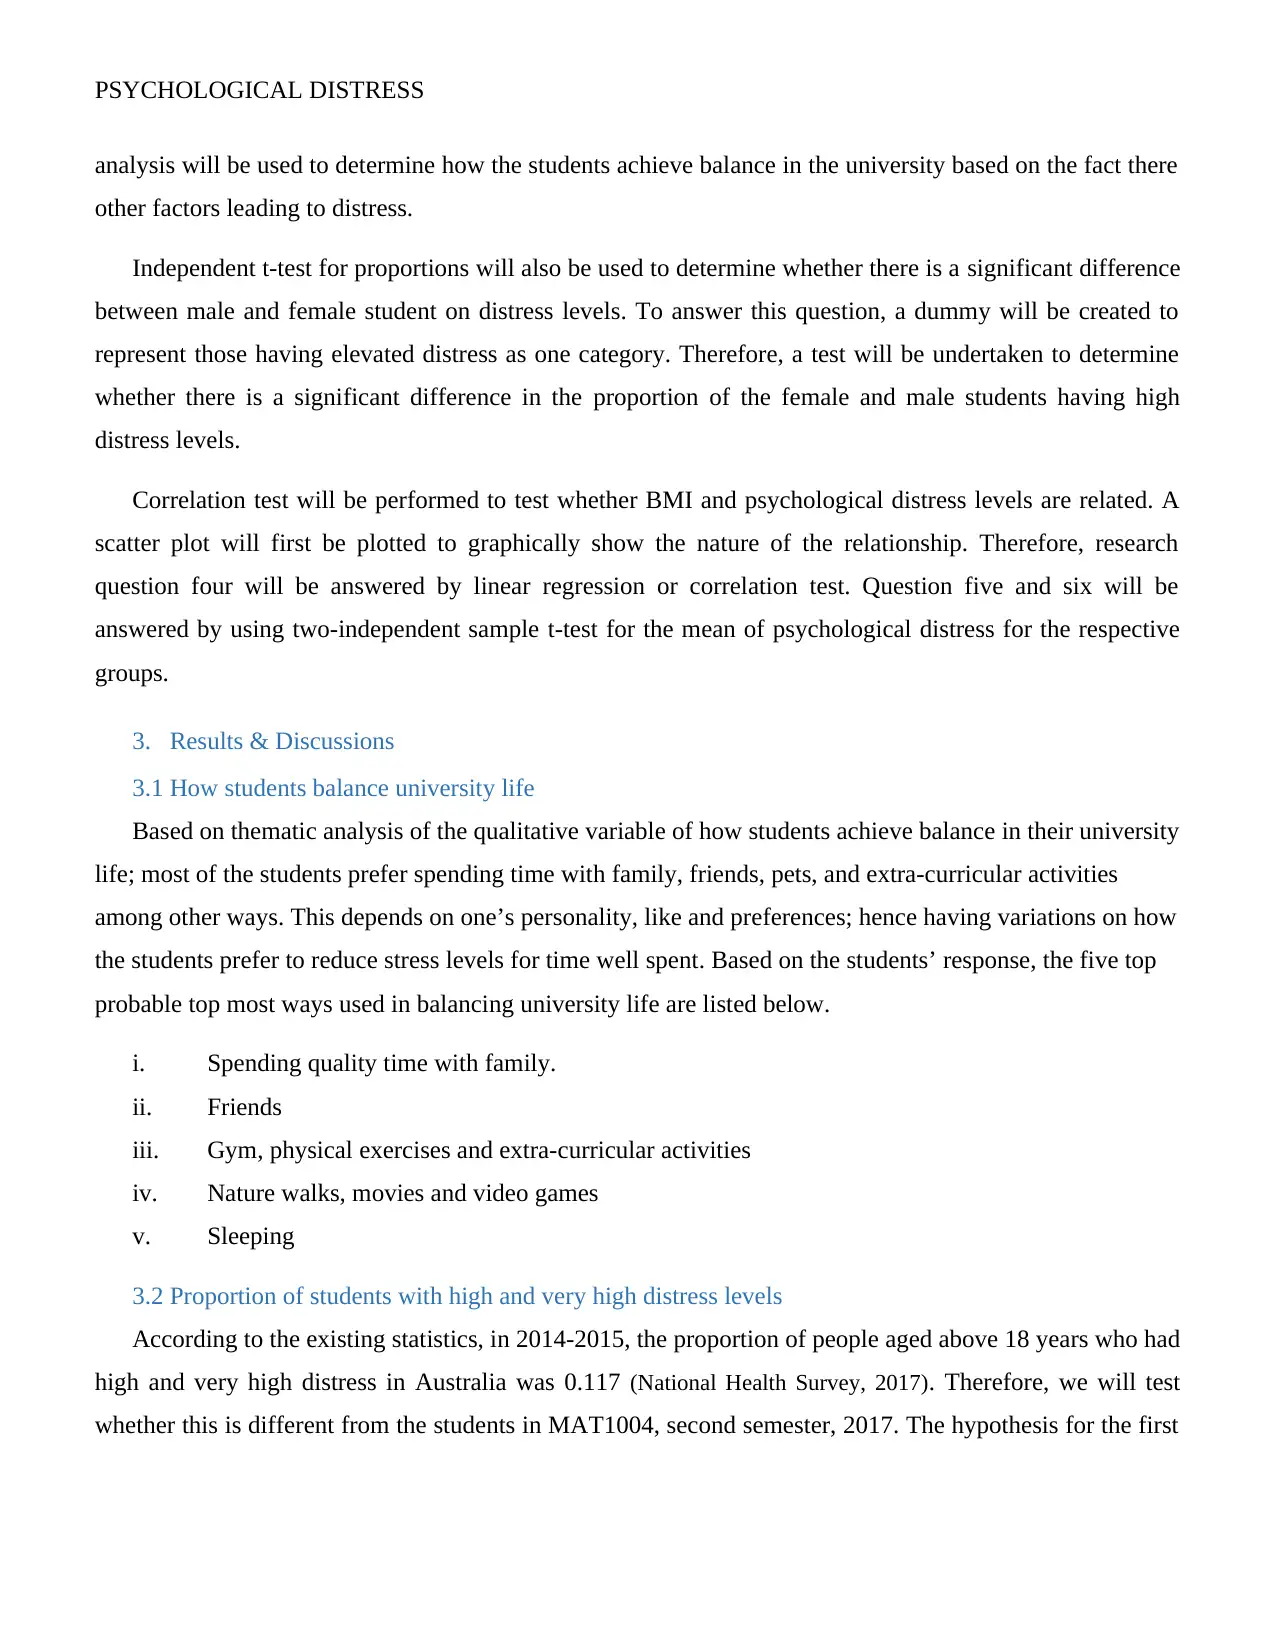
Figure 1: BMI by K10 total scatter plot
Table 5: Correlation table between BMI and K10 total
Correlations
BMI K10_Total
BMI Pearson Correlation 1 .130**
Sig. (2-tailed) .009
N 415 408
K10_Total Pearson Correlation .130** 1
Sig. (2-tailed) .009
N 408 415
**. Correlation is significant at the 0.01 level (2-tailed).
There is a weak correlation between BMI and psychological distress level. The p-value is less than 0.05,
hence rejecting the null hypothesis and concluding that there is a significant relationship between BMI and
K10 total.
ii. H0: There is no significant relationship between waist size and psychological distress
HA: There is a significant relationship between waist size and psychological distress
Figure 1: BMI by K10 total scatter plot
Table 5: Correlation table between BMI and K10 total
Correlations
BMI K10_Total
BMI Pearson Correlation 1 .130**
Sig. (2-tailed) .009
N 415 408
K10_Total Pearson Correlation .130** 1
Sig. (2-tailed) .009
N 408 415
**. Correlation is significant at the 0.01 level (2-tailed).
There is a weak correlation between BMI and psychological distress level. The p-value is less than 0.05,
hence rejecting the null hypothesis and concluding that there is a significant relationship between BMI and
K10 total.
ii. H0: There is no significant relationship between waist size and psychological distress
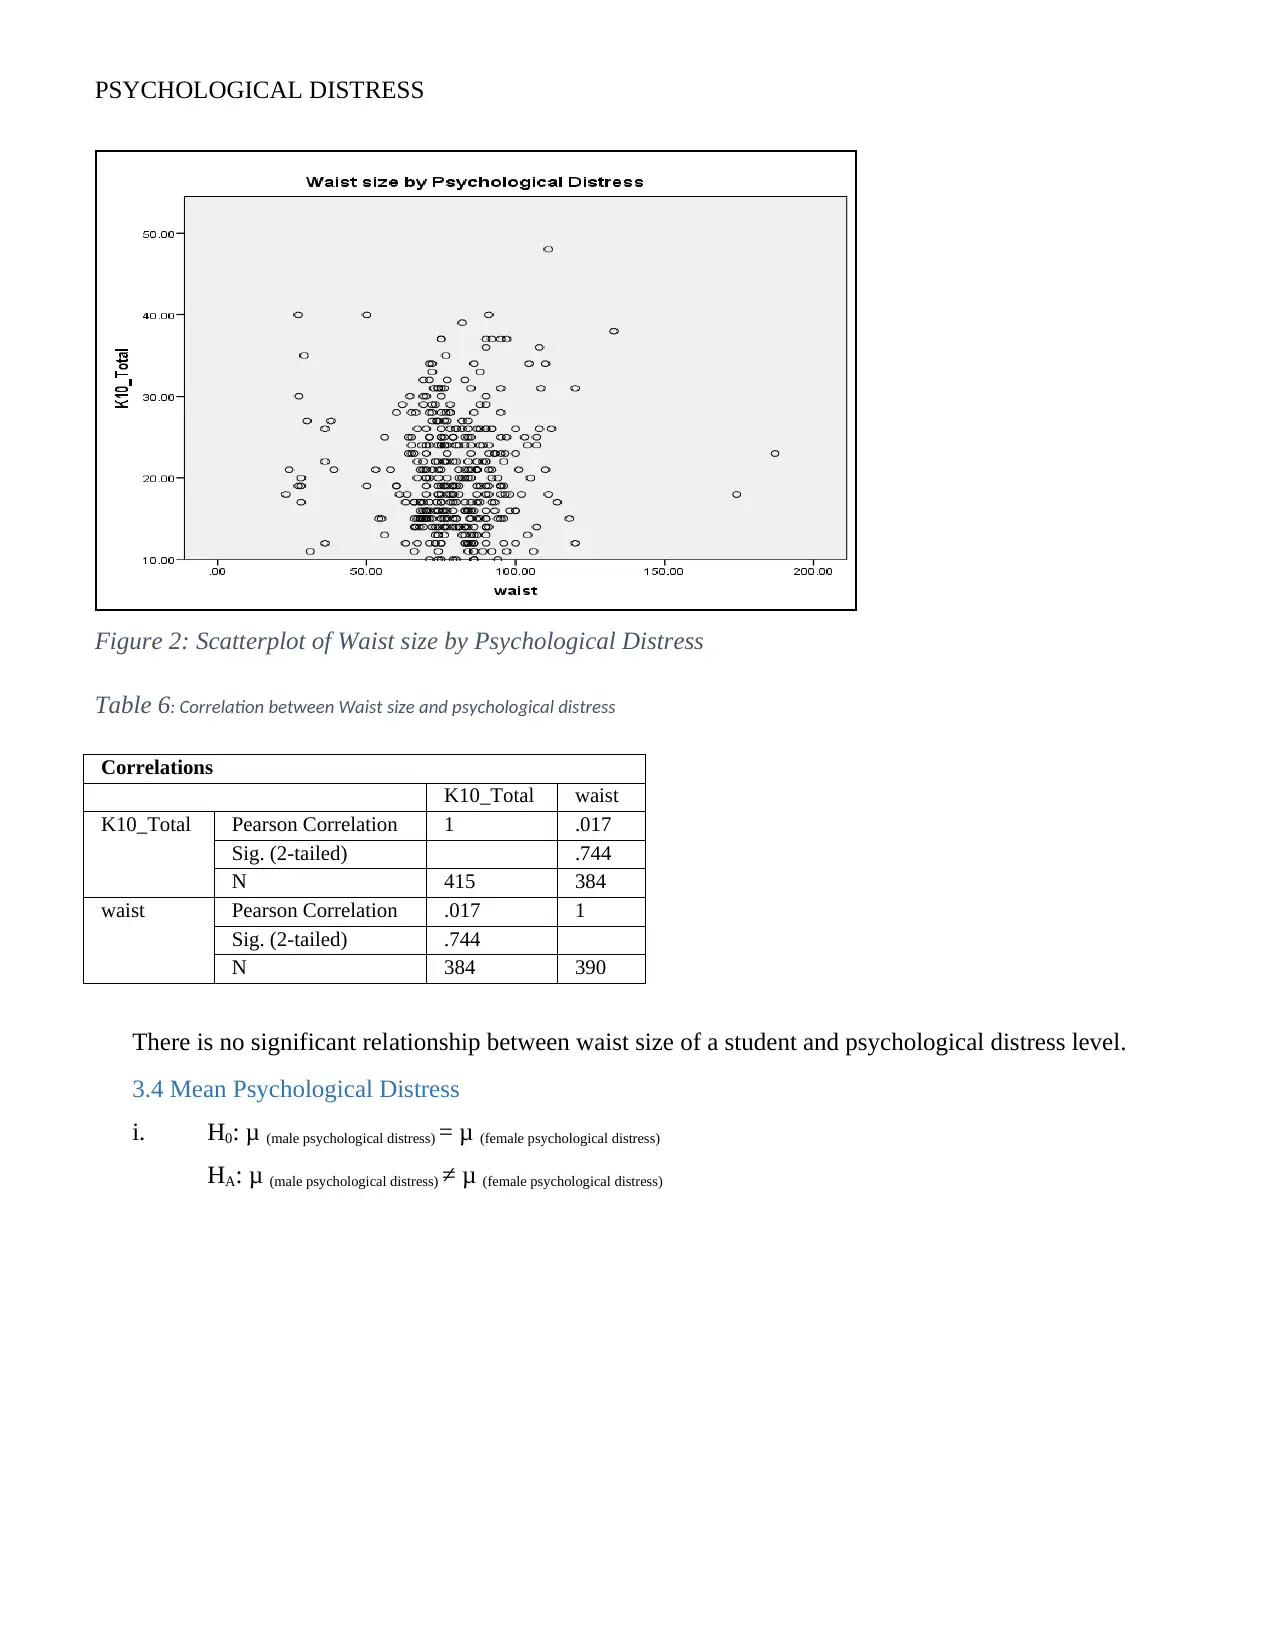
HA: There is a significant relationship between waist size and psychological distress
PSYCHOLOGICAL DISTRESS
Figure 2: Scatterplot of Waist size by Psychological Distress
Table 6: Correlation between Waist size and psychological distress
Correlations
K10_Total waist
K10_Total Pearson Correlation 1 .017
Sig. (2-tailed) .744
N 415 384
waist Pearson Correlation .017 1
Sig. (2-tailed) .744
N 384 390
There is no significant relationship between waist size of a student and psychological distress level.
3.4 Mean Psychological Distress
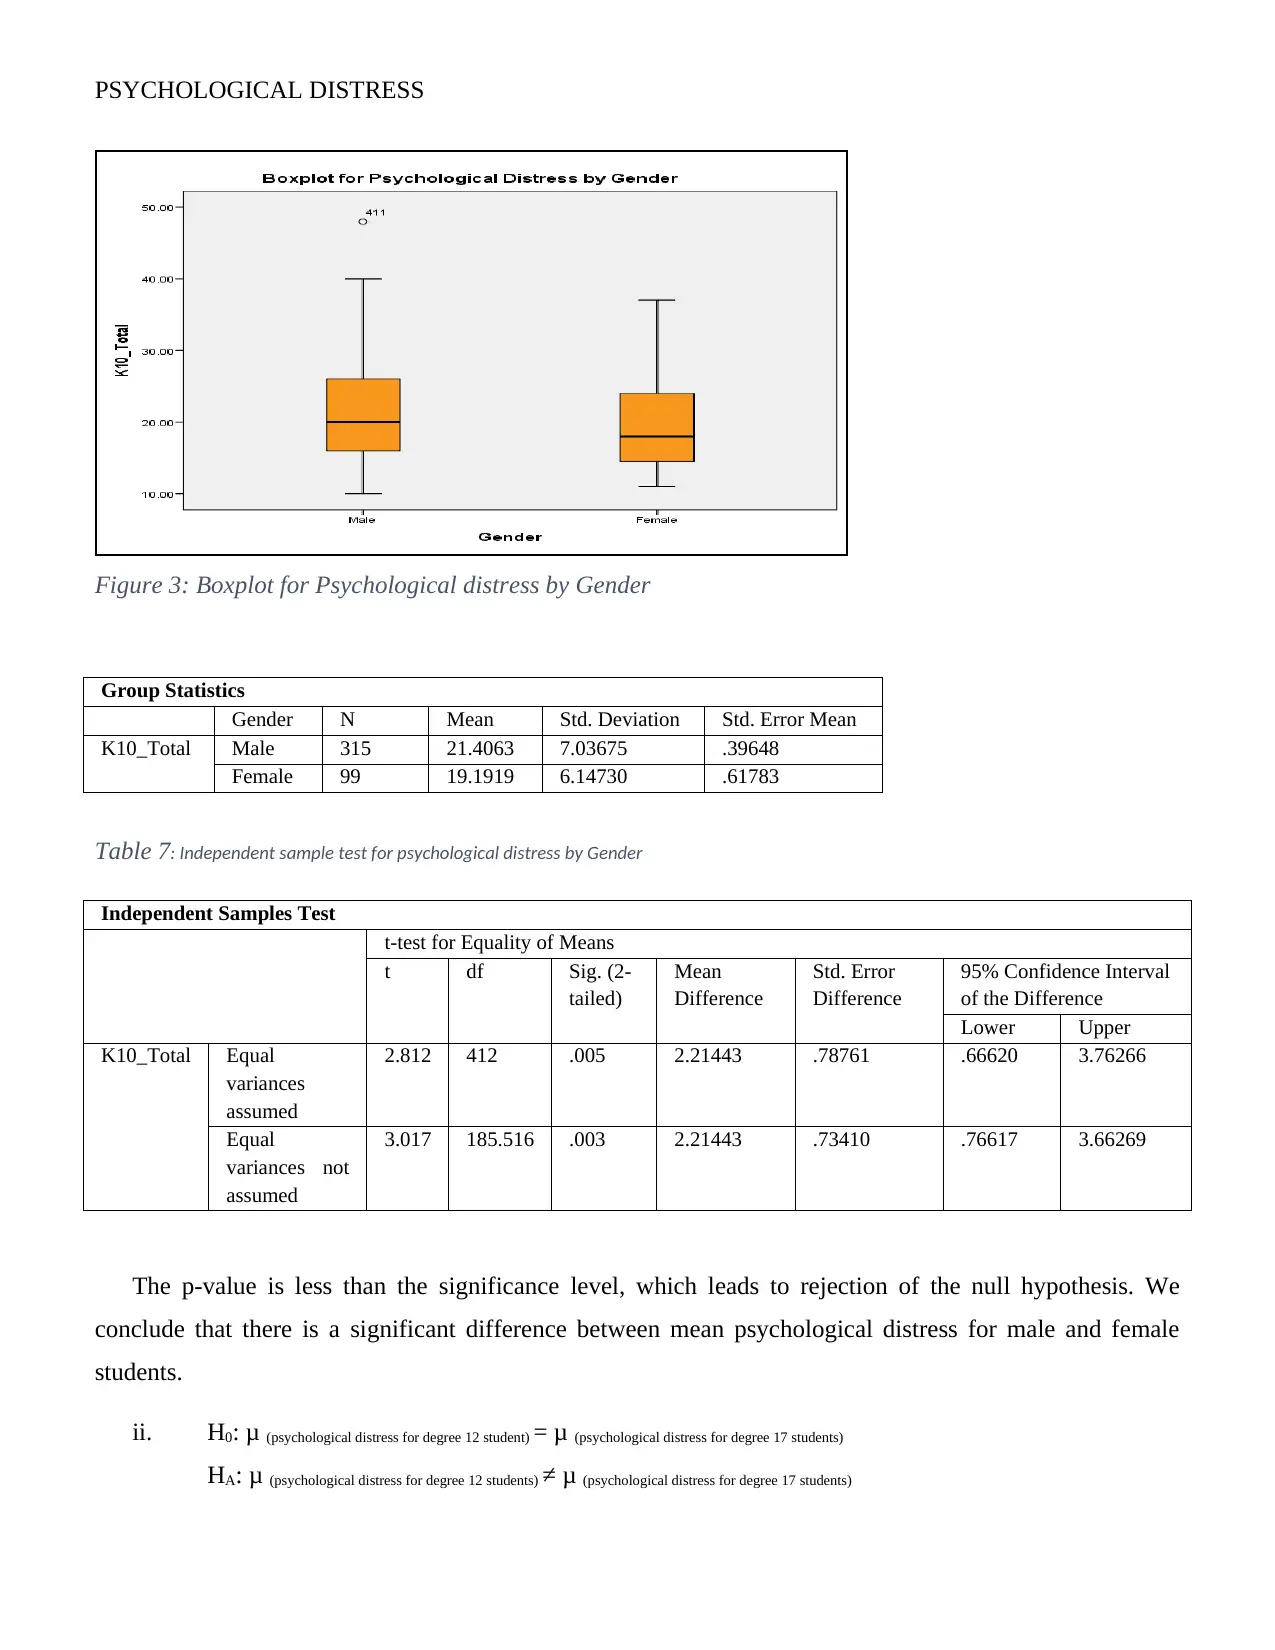
i. H0: μ (male psychological distress) = μ (female psychological distress)
HA: μ (male psychological distress) ≠ μ (female psychological distress)
Figure 2: Scatterplot of Waist size by Psychological Distress
Table 6: Correlation between Waist size and psychological distress
Correlations
K10_Total waist
K10_Total Pearson Correlation 1 .017
Sig. (2-tailed) .744
N 415 384
waist Pearson Correlation .017 1
Sig. (2-tailed) .744
N 384 390
There is no significant relationship between waist size of a student and psychological distress level.
3.4 Mean Psychological Distress
i. H0: μ (male psychological distress) = μ (female psychological distress)
HA: μ (male psychological distress) ≠ μ (female psychological distress)
⊘ This is a preview!⊘
Do you want full access?
Subscribe today to unlock all pages.
Trusted by 1+ million students worldwide
PSYCHOLOGICAL DISTRESS
Figure 3: Boxplot for Psychological distress by Gender
Group Statistics
Gender N Mean Std. Deviation Std. Error Mean
K10_Total Male 315 21.4063 7.03675 .39648
Female 99 19.1919 6.14730 .61783
Table 7: Independent sample test for psychological distress by Gender
Independent Samples Test
t-test for Equality of Means
t df Sig. (2-
tailed)
Mean
Difference
Std. Error
Difference
95% Confidence Interval
of the Difference
Lower Upper
K10_Total Equal
variances
assumed
2.812 412 .005 2.21443 .78761 .66620 3.76266
Equal
variances not
assumed
3.017 185.516 .003 2.21443 .73410 .76617 3.66269
The p-value is less than the significance level, which leads to rejection of the null hypothesis. We
conclude that there is a significant difference between mean psychological distress for male and female
students.
ii. H0: μ (psychological distress for degree 12 student) = μ (psychological distress for degree 17 students)
HA: μ (psychological distress for degree 12 students) ≠ μ (psychological distress for degree 17 students)
Paraphrase This Document
Need a fresh take? Get an instant paraphrase of this document with our AI Paraphraser
PSYCHOLOGICAL DISTRESS
Group Statistics
degre
e
N Mean Std. Deviation Std. Error Mean
K10_Total 12 40 21.8250 7.01240 1.10876
17 50 19.3200 6.67141 .94348
Table 8: Psychological distress levels by degree 12 and 17
Independent Samples Test
t-test for Equality of Means
t df Sig. (2-
tailed)
Mean
Difference
Std. Error
Difference
95% Confidence Interval
of the Difference
Lower Upper
K10_Total Equal
variances
assumed
1.730 88 .087 2.505 1.44772 -.37205 5.38205
Equal
variances not
assumed
1.721 81.794 .089 2.505 1.45585 -.39126 5.40126
There is no significant difference between the average psychological distress levels of students
undertaking degree 12 and 17 (Meyers, Gamst & Guarino, 2013).
4. Conclusion
The proportion of distress for the general population is generally different from the students’ based on
the tested hypothesis for research question number one. 42% of the students experience high and very high
distress levels. This is very high compared to the general population whose proportion of people with high
and very high distress was accounted at 11.7% by the Australian National Health Survey in 2014-15
(National Health Survey, 2017). It was also established that there is no significant relationship between
elevated distress level and gender of the students. Psychological distress is positively correlated with the
BMI of a student. However, the waist size of a student does not determine the stress levels of a student
based on the data. Female students have generally lower distress levels compared to their male counterparts.
Finally, it was found that there is no difference between average psychological distress levels of students
taking degree 12 and 17.
5. Recommendations
The university counsel should towards developing programs that aim at providing counselling to the
students. This will reduce the high levels of distress significant, hence helping the students to improve in
academic and social performance. The counsellors should highly focus on the male students because it has
PSYCHOLOGICAL DISTRESS
been observed that they experience higher psychological distress than the females. Finally, the students
should be encouraged to engage in physical extra-curricular activities that will help in managing their
weights for healthy BMI levels.
been observed that they experience higher psychological distress than the females. Finally, the students
should be encouraged to engage in physical extra-curricular activities that will help in managing their
weights for healthy BMI levels.
⊘ This is a preview!⊘
Do you want full access?
Subscribe today to unlock all pages.
Trusted by 1+ million students worldwide
1 out of 13
Related Documents


Your All-in-One AI-Powered Toolkit for Academic Success.
+13062052269
info@desklib.com
Available 24*7 on WhatsApp / Email
![[object Object]](/_next/static/media/star-bottom.7253800d.svg)
Unlock your academic potential
Copyright © 2020–2026 A2Z Services. All Rights Reserved. Developed and managed by ZUCOL.