Health Statistics: Factors Influencing Psychological Wellbeing Report
VerifiedAdded on 2020/05/04
|9
|2009
|138
Report
AI Summary
This report presents a statistical analysis of a dataset comprising 180 observations across 10 variables, investigating factors influencing psychological wellbeing, particularly among an aging population. The study examines the association between living arrangements and psychological scores before and after a flood event. The analysis utilizes Chi-square tests, regression analysis, and ANOVA to explore relationships between variables such as living alone, age, social support, family functioning, and the impact of floods on psychological wellbeing. Key findings indicate no significant association between living alone and low pre-flood psychological scores, while social support and family functioning were significant predictors. Furthermore, the report reveals a significant difference in post-flood psychological scores based on the level of flood impact, with those experiencing no or limited impact showing higher scores. The analysis also highlights a significant difference in the change in psychological scores between pre and post-flood surveys based on the level of flood impact.
Health Statistic Assessment
Analytical Report
Student Name:
Student Number:
Lecturer Name:
Date:
Analytical Report
Student Name:
Student Number:
Lecturer Name:
Date:
Paraphrase This Document
Need a fresh take? Get an instant paraphrase of this document with our AI Paraphraser
Introduction
Aging Populace creates a variety of social and wellbeing worries, among which are the
unique worries of the mental prosperity of elderly who live alone. Much research on the
relationship between living arrangements and subjective well-being of the elderly has yielded
conflicting results. Investigations of different more elderly populaces in Hong Kong, United
States and Japan have revealed that elderly living alone will probably be depressed (Cheng,
Fung, & Chan, 2009; Chou & Chi, Comparison between elderly Chinese living alone and
those living with others, 2000; Chou, Ho, & Chi, Living alone and depression in Chinese
older adults, 2006; Dean, Kolody, Wood, & Matt, 1992) and have poorer psychological
wellness status and personal satisfaction (Chou & Chi, Comparison between elderly Chinese
living alone and those living with others, 2000; Gee, 2000; Iwasa, Kawaai, Gondo, Inagaki,
& Suzuki, 2006) than their partners.
Nonetheless, a few authors revealed that living alone was not related with more elevated
amounts of depressive side effects and lower personal satisfaction (Chou, Ho, & Chi, Living
alone and depression in Chinese older adults, 2006; Mellor, Stokes, Firth, Hayashi, &
Cummins, 2008).
In this report, I present the analysis as well as answers to set of questions related to statistical
analysis. I was presented with a dataset that has 180 observations with 10 different variables.
The answers to the questions together with their interpretations are provided below each and
every question.
Results
The first question I sought to answer was whether there is an association between having a
low (below 15) pre-flood psychological score and living alone? If so, what this the nature of
the association?
Chi-Square Tests
Value df Asymp. Sig.
(2-sided)
Exact Sig.
(2-sided)
Exact Sig.
(1-sided)
Pearson Chi-Square .334a 1 .563
Continuity Correctionb .064 1 .801
Likelihood Ratio .337 1 .562
Fisher's Exact Test .747 .402
Linear-by-Linear
Association
.332 1 .564
N of Valid Cases 178
a. 1 cells (25.0%) have expected count less than 5. The minimum expected count is 4.89.
b. Computed only for a 2x2 table
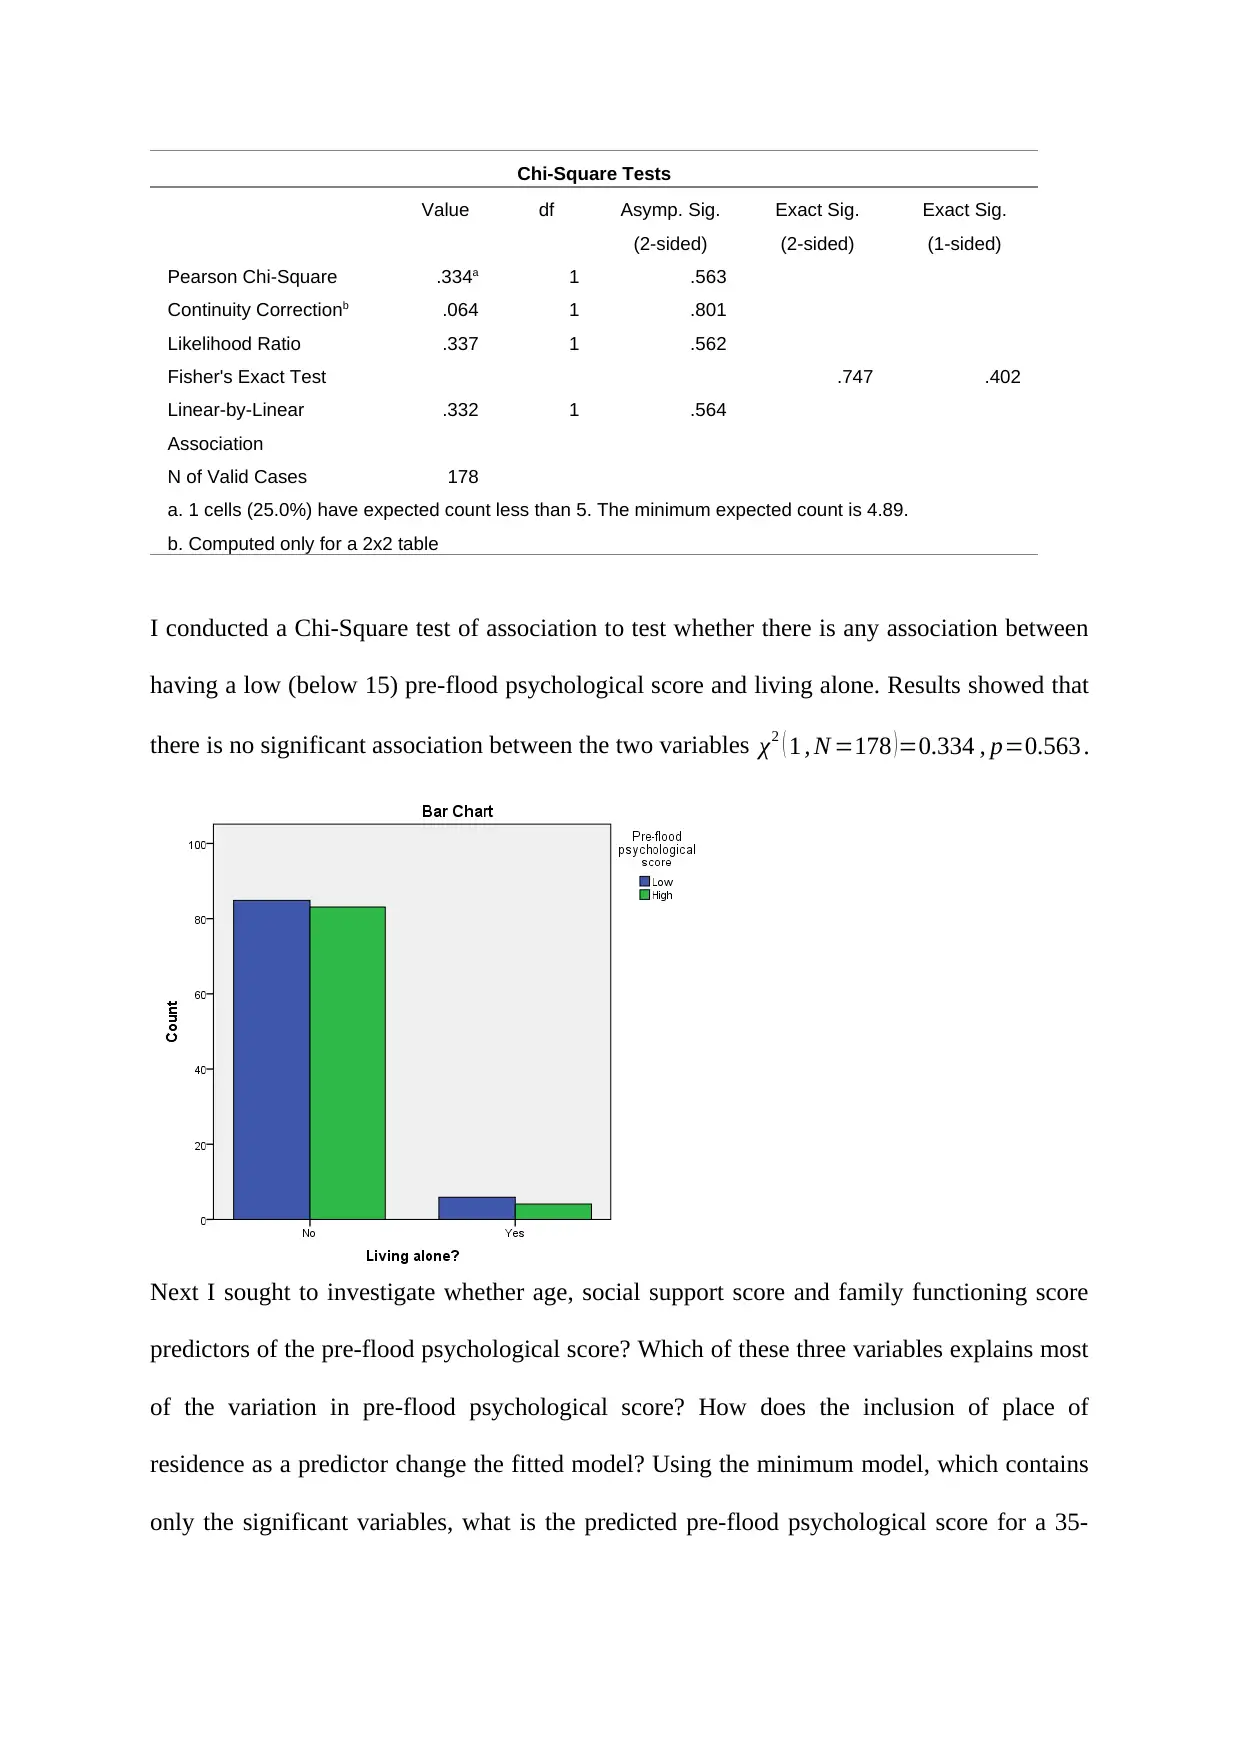
I conducted a Chi-Square test of association to test whether there is any association between
having a low (below 15) pre-flood psychological score and living alone. Results showed that
there is no significant association between the two variables χ2 ( 1 , N =178 )=0.334 , p=0.563 .
Next I sought to investigate whether age, social support score and family functioning score
predictors of the pre-flood psychological score? Which of these three variables explains most
of the variation in pre-flood psychological score? How does the inclusion of place of
residence as a predictor change the fitted model? Using the minimum model, which contains
only the significant variables, what is the predicted pre-flood psychological score for a 35-
Value df Asymp. Sig.
(2-sided)
Exact Sig.
(2-sided)
Exact Sig.
(1-sided)
Pearson Chi-Square .334a 1 .563
Continuity Correctionb .064 1 .801
Likelihood Ratio .337 1 .562
Fisher's Exact Test .747 .402
Linear-by-Linear
Association
.332 1 .564
N of Valid Cases 178
a. 1 cells (25.0%) have expected count less than 5. The minimum expected count is 4.89.
b. Computed only for a 2x2 table
I conducted a Chi-Square test of association to test whether there is any association between
having a low (below 15) pre-flood psychological score and living alone. Results showed that
there is no significant association between the two variables χ2 ( 1 , N =178 )=0.334 , p=0.563 .
Next I sought to investigate whether age, social support score and family functioning score
predictors of the pre-flood psychological score? Which of these three variables explains most
of the variation in pre-flood psychological score? How does the inclusion of place of
residence as a predictor change the fitted model? Using the minimum model, which contains
only the significant variables, what is the predicted pre-flood psychological score for a 35-
⊘ This is a preview!⊘
Do you want full access?
Subscribe today to unlock all pages.
Trusted by 1+ million students worldwide
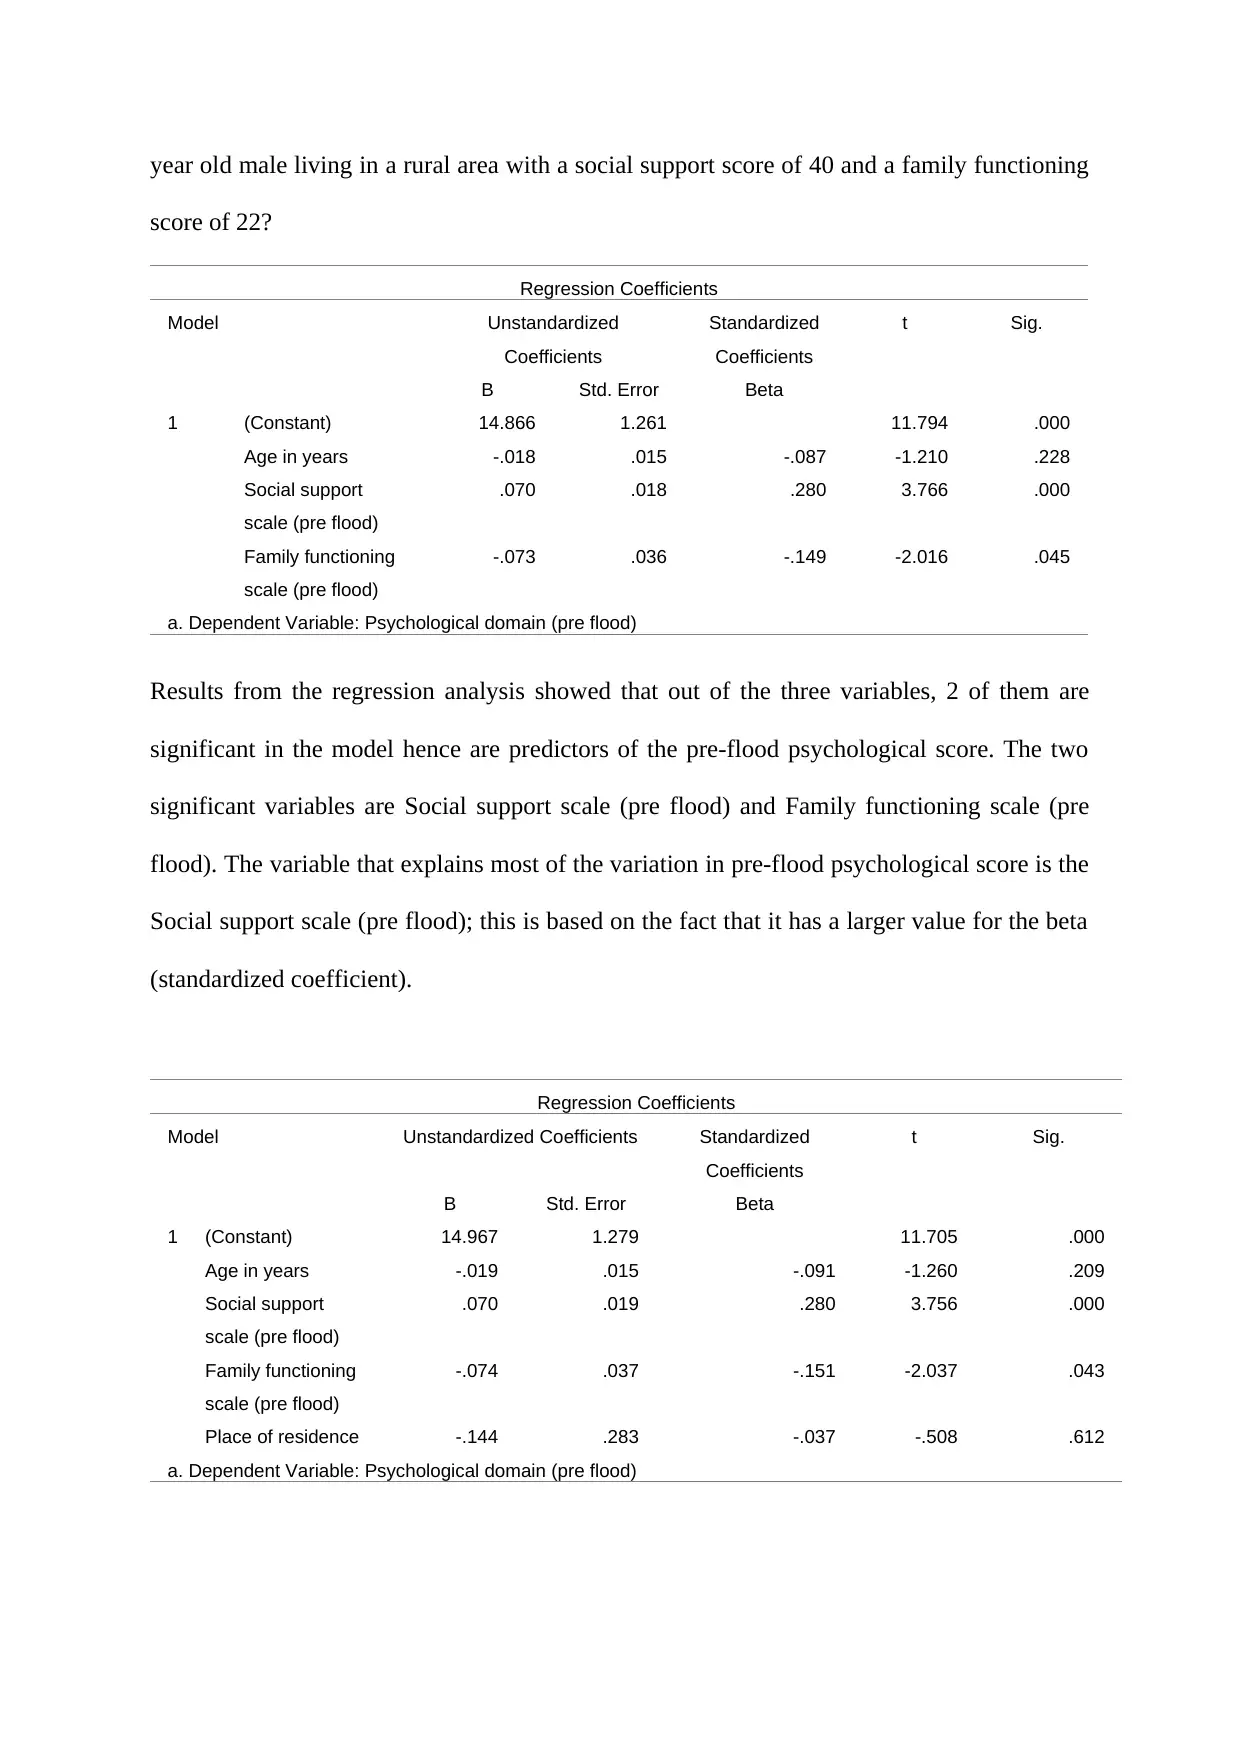
year old male living in a rural area with a social support score of 40 and a family functioning
score of 22?
Regression Coefficients
Model Unstandardized
Coefficients
Standardized
Coefficients
t Sig.
B Std. Error Beta
1 (Constant) 14.866 1.261 11.794 .000
Age in years -.018 .015 -.087 -1.210 .228
Social support
scale (pre flood)
.070 .018 .280 3.766 .000
Family functioning
scale (pre flood)
-.073 .036 -.149 -2.016 .045
a. Dependent Variable: Psychological domain (pre flood)
Results from the regression analysis showed that out of the three variables, 2 of them are
significant in the model hence are predictors of the pre-flood psychological score. The two
significant variables are Social support scale (pre flood) and Family functioning scale (pre
flood). The variable that explains most of the variation in pre-flood psychological score is the
Social support scale (pre flood); this is based on the fact that it has a larger value for the beta
(standardized coefficient).
Regression Coefficients
Model Unstandardized Coefficients Standardized
Coefficients
t Sig.
B Std. Error Beta
1 (Constant) 14.967 1.279 11.705 .000
Age in years -.019 .015 -.091 -1.260 .209
Social support
scale (pre flood)
.070 .019 .280 3.756 .000
Family functioning
scale (pre flood)
-.074 .037 -.151 -2.037 .043
Place of residence -.144 .283 -.037 -.508 .612
a. Dependent Variable: Psychological domain (pre flood)
Paraphrase This Document
Need a fresh take? Get an instant paraphrase of this document with our AI Paraphraser
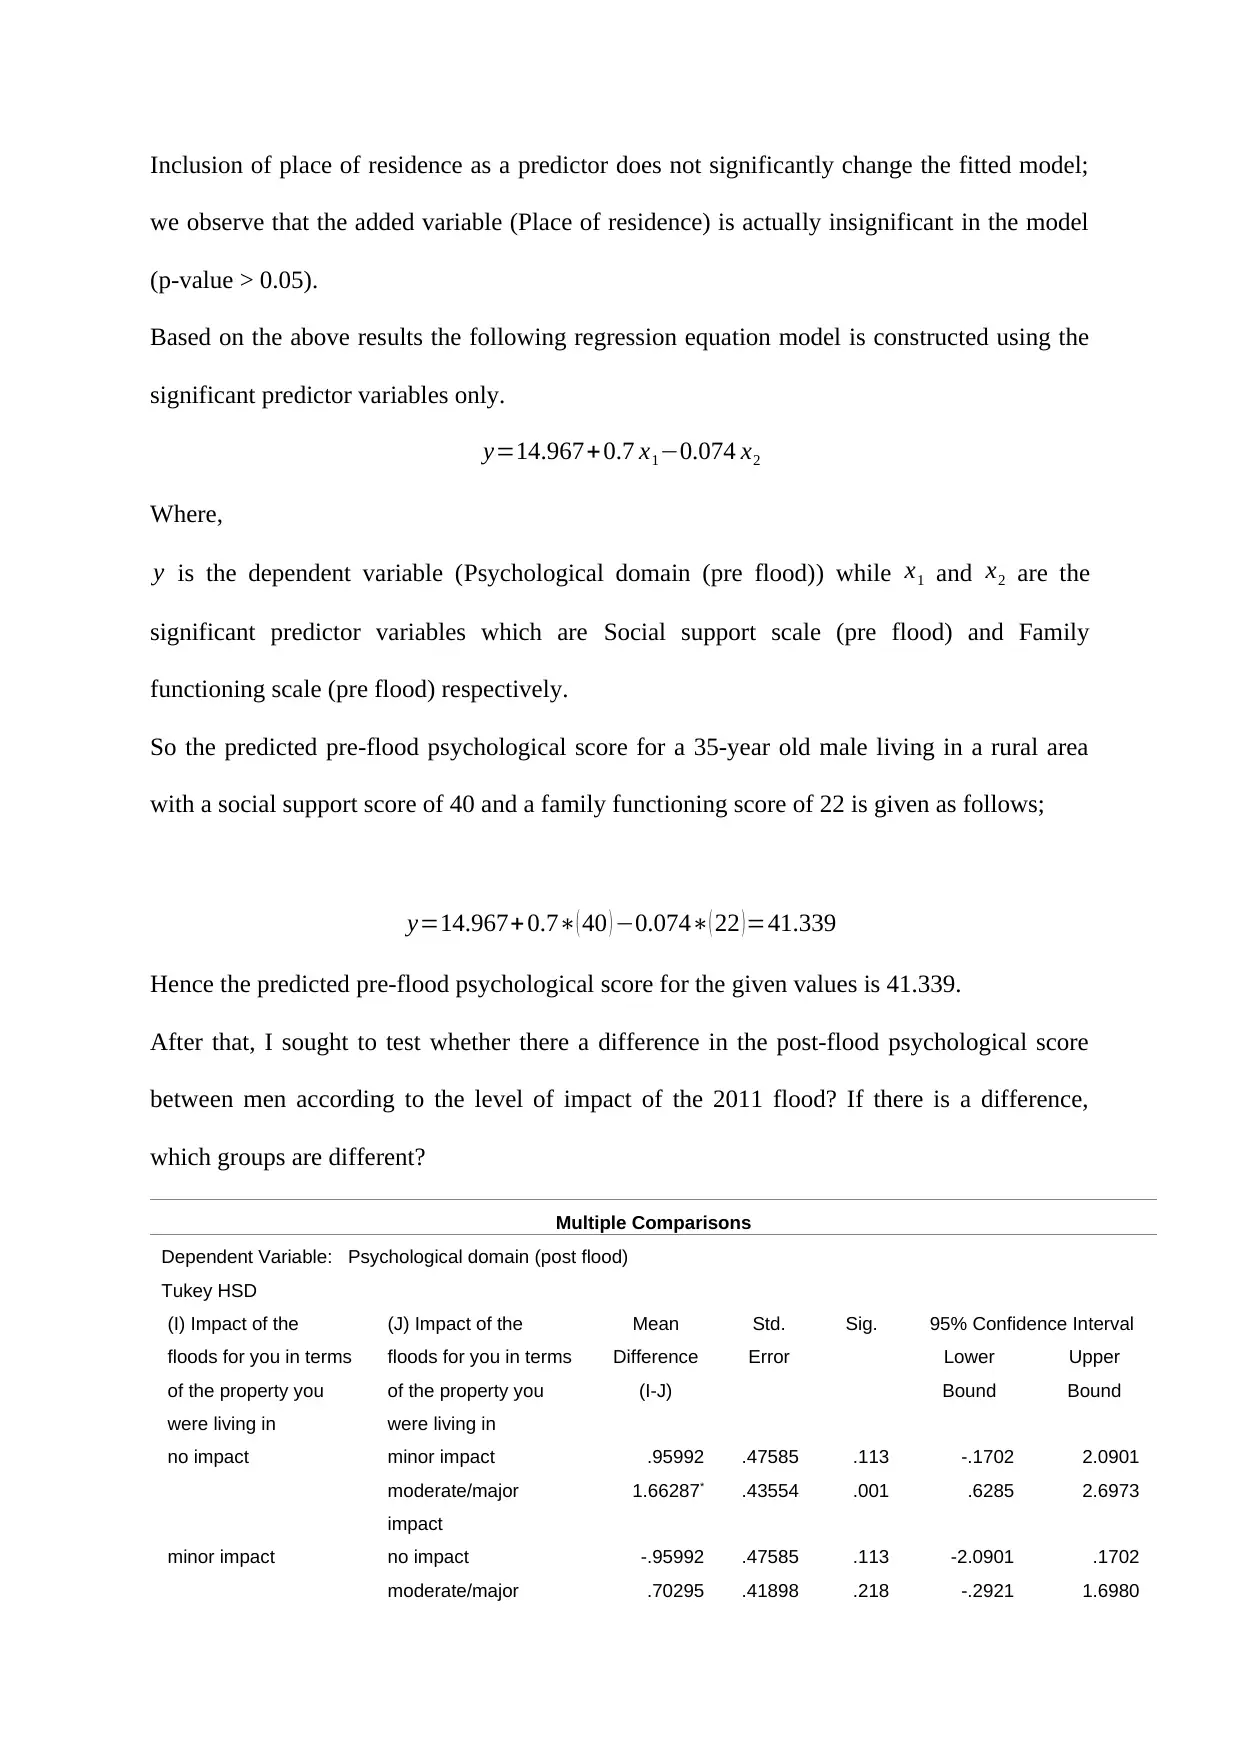
Inclusion of place of residence as a predictor does not significantly change the fitted model;
we observe that the added variable (Place of residence) is actually insignificant in the model
(p-value > 0.05).
Based on the above results the following regression equation model is constructed using the
significant predictor variables only.
y=14.967+0.7 x1−0.074 x2
Where,
y is the dependent variable (Psychological domain (pre flood)) while x1 and x2 are the
significant predictor variables which are Social support scale (pre flood) and Family
functioning scale (pre flood) respectively.
So the predicted pre-flood psychological score for a 35-year old male living in a rural area
with a social support score of 40 and a family functioning score of 22 is given as follows;
y=14.967+0.7∗( 40 ) −0.074∗( 22 )=41.339
Hence the predicted pre-flood psychological score for the given values is 41.339.
After that, I sought to test whether there a difference in the post-flood psychological score
between men according to the level of impact of the 2011 flood? If there is a difference,
which groups are different?
Multiple Comparisons
Dependent Variable: Psychological domain (post flood)
Tukey HSD
(I) Impact of the
floods for you in terms
of the property you
were living in
(J) Impact of the
floods for you in terms
of the property you
were living in
Mean
Difference
(I-J)
Std.
Error
Sig. 95% Confidence Interval
Lower
Bound
Upper
Bound
no impact minor impact .95992 .47585 .113 -.1702 2.0901
moderate/major
impact
1.66287* .43554 .001 .6285 2.6973
minor impact no impact -.95992 .47585 .113 -2.0901 .1702
moderate/major .70295 .41898 .218 -.2921 1.6980
impact
moderate/major
impact
no impact -1.66287* .43554 .001 -2.6973 -.6285
minor impact -.70295 .41898 .218 -1.6980 .2921
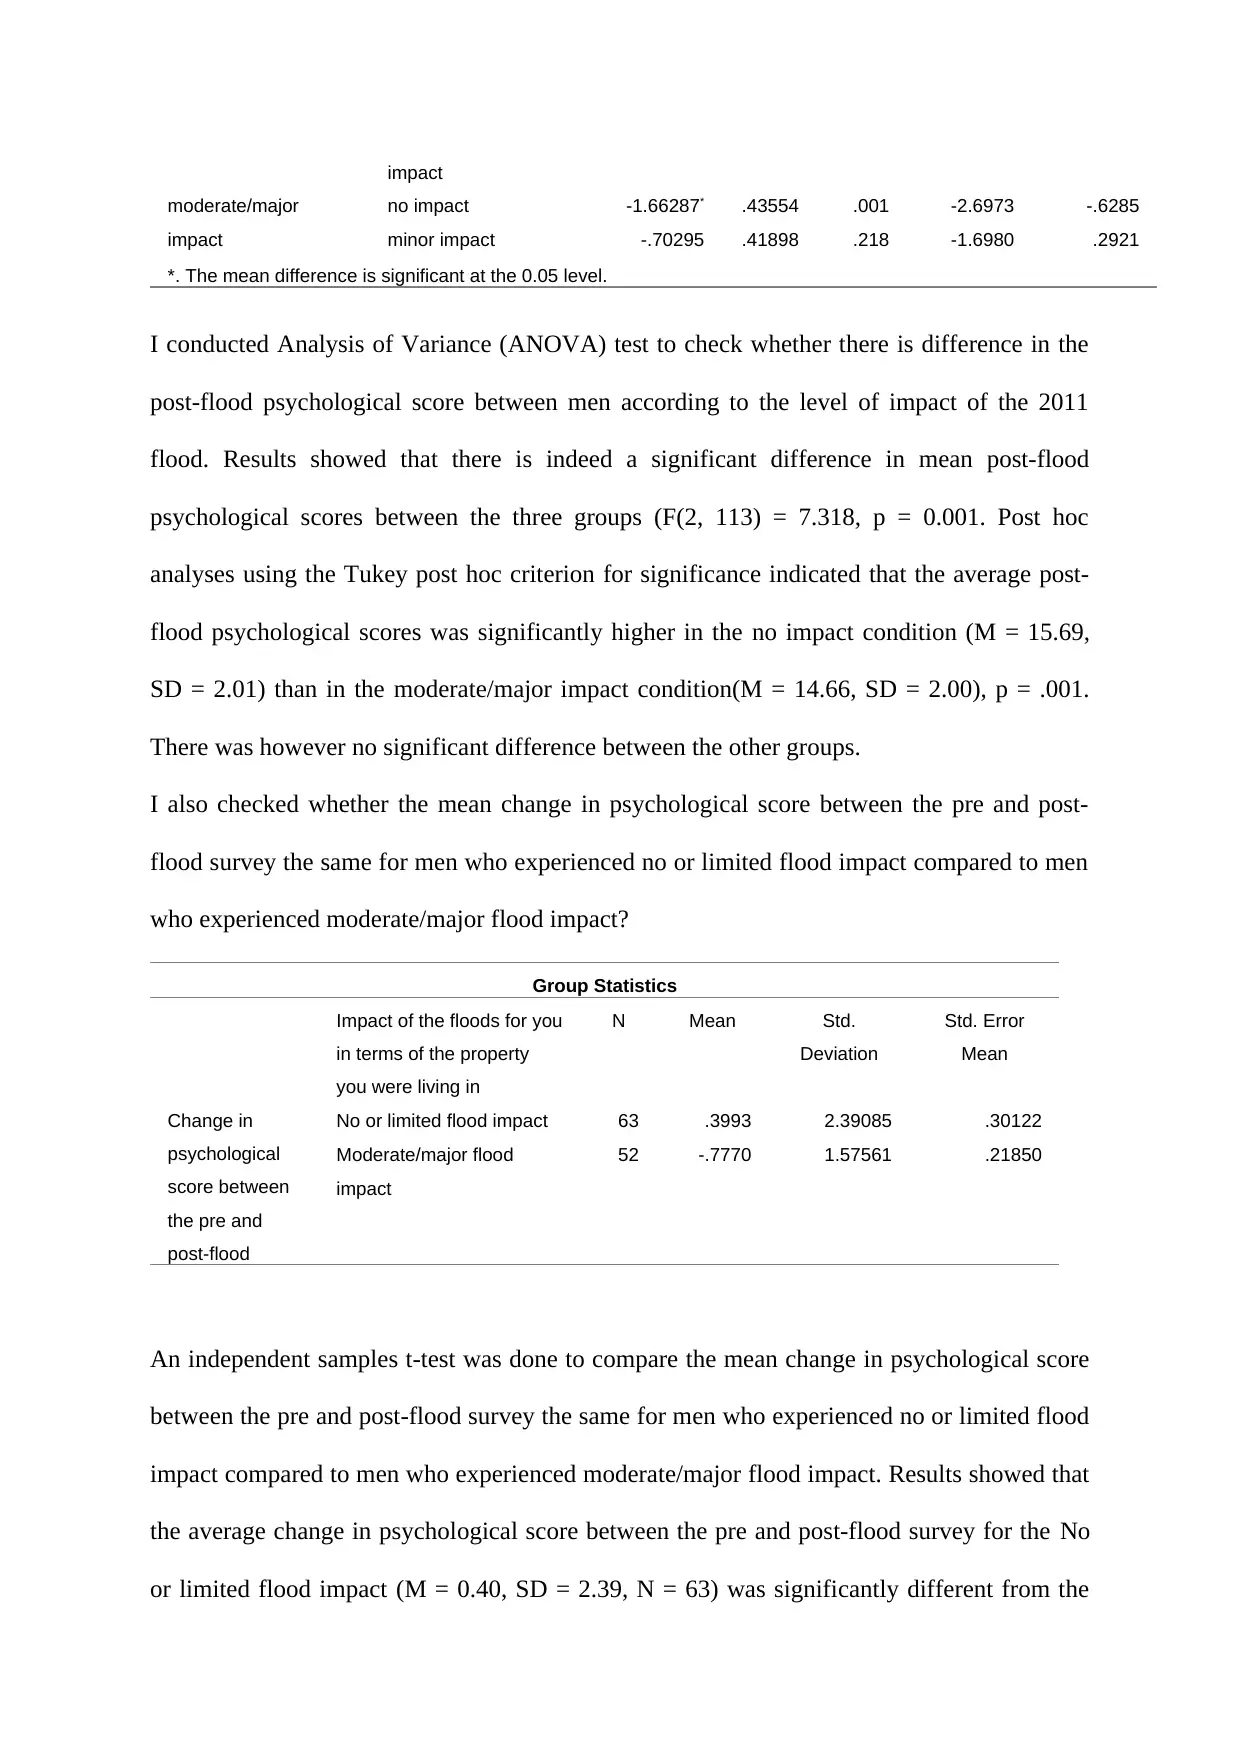
*. The mean difference is significant at the 0.05 level.
I conducted Analysis of Variance (ANOVA) test to check whether there is difference in the
post-flood psychological score between men according to the level of impact of the 2011
flood. Results showed that there is indeed a significant difference in mean post-flood
psychological scores between the three groups (F(2, 113) = 7.318, p = 0.001. Post hoc
analyses using the Tukey post hoc criterion for significance indicated that the average post-
flood psychological scores was significantly higher in the no impact condition (M = 15.69,
SD = 2.01) than in the moderate/major impact condition(M = 14.66, SD = 2.00), p = .001.
There was however no significant difference between the other groups.
I also checked whether the mean change in psychological score between the pre and post-
flood survey the same for men who experienced no or limited flood impact compared to men
who experienced moderate/major flood impact?
Group Statistics
Impact of the floods for you
in terms of the property
you were living in
N Mean Std.
Deviation
Std. Error
Mean
Change in
psychological
score between
the pre and
post-flood
No or limited flood impact 63 .3993 2.39085 .30122
Moderate/major flood
impact
52 -.7770 1.57561 .21850
An independent samples t-test was done to compare the mean change in psychological score
between the pre and post-flood survey the same for men who experienced no or limited flood
impact compared to men who experienced moderate/major flood impact. Results showed that
the average change in psychological score between the pre and post-flood survey for the No
or limited flood impact (M = 0.40, SD = 2.39, N = 63) was significantly different from the
moderate/major
impact
no impact -1.66287* .43554 .001 -2.6973 -.6285
minor impact -.70295 .41898 .218 -1.6980 .2921
*. The mean difference is significant at the 0.05 level.
I conducted Analysis of Variance (ANOVA) test to check whether there is difference in the
post-flood psychological score between men according to the level of impact of the 2011
flood. Results showed that there is indeed a significant difference in mean post-flood
psychological scores between the three groups (F(2, 113) = 7.318, p = 0.001. Post hoc
analyses using the Tukey post hoc criterion for significance indicated that the average post-
flood psychological scores was significantly higher in the no impact condition (M = 15.69,
SD = 2.01) than in the moderate/major impact condition(M = 14.66, SD = 2.00), p = .001.
There was however no significant difference between the other groups.
I also checked whether the mean change in psychological score between the pre and post-
flood survey the same for men who experienced no or limited flood impact compared to men
who experienced moderate/major flood impact?
Group Statistics
Impact of the floods for you
in terms of the property
you were living in
N Mean Std.
Deviation
Std. Error
Mean
Change in
psychological
score between
the pre and
post-flood
No or limited flood impact 63 .3993 2.39085 .30122
Moderate/major flood
impact
52 -.7770 1.57561 .21850
An independent samples t-test was done to compare the mean change in psychological score
between the pre and post-flood survey the same for men who experienced no or limited flood
impact compared to men who experienced moderate/major flood impact. Results showed that
the average change in psychological score between the pre and post-flood survey for the No
or limited flood impact (M = 0.40, SD = 2.39, N = 63) was significantly different from the
⊘ This is a preview!⊘
Do you want full access?
Subscribe today to unlock all pages.
Trusted by 1+ million students worldwide
Moderate/major flood impact (M = -0.78, SD = 1.58, N = 52), t (113) = 3.043, p < .05, two-
tailed. The difference of 1.18 showed a significant difference. Essentially results showed that
men who experienced no or limited flood impact had significantly higher mean change in
psychological score between the pre and post-flood compared to men who experienced
moderate/major flood impact.
Conclusion
The aim of this study was to understand the relationship that exists between different factors
with the psychological well-being of individuals. I first investigated whether there is any
association between living alone and having a low (below 15) pre-flood psychological score.
Results revealed to me that there is no association between the two variables (living alone and
having a low (below 15) pre-flood psychological score).
Social support scale (pre flood) and Family functioning scale (pre flood) factors were found to
significant predictors of the pre-flood psychological score.
References
Paraphrase This Document
Need a fresh take? Get an instant paraphrase of this document with our AI Paraphraser
Cheng, S. T., Fung, H. H., & Chan, A. M. (2009). Self-perception and psychological well-
being: the benefits of foreseeing a worse future. Psychology and Aging, 24(3), 623–
633.
Chou , K. L., & Chi, I. (2000). Comparison between elderly Chinese living alone and those
living with others. Journal of Gerontological Social Work, 33, 51–66.
Chou, K. L., Ho, A. H., & Chi, I. (2006). Living alone and depression in Chinese older
adults. Aging and Mental Health, 10(6), 583–591.
Cornwell, E. Y., & Waite, L. J. (2009). Social disconnectedness, perceived isolation, and
health among older adults. Journal of Health and Social Behavior, 50(1), 31-48.
Dean, A., Kolody, B., Wood, P., & Matt, G. E. (1992). The influence of living alone on
depression in elderly persons. Journal of Aging and Health, 4(1), 3–18.
Gee, E. M. (2000). Living arrangements and quality of life among Chinese Canadian elders.
Social Indicators Research, 51(3), 309–329.
Iwasa, H., Kawaai, C., Gondo, Y., Inagaki, H., & Suzuki, K. (2006). Subjective well-being as
a predictor of all-cause mortality among middle-aged and elderly people living in an
urban Japanese community: a seven-year prospective cohort study. Geriatrics &
Gerontology International, 6(3), 216–622.
Kawamoto, R., Yoshida, O., Oka, Y., & Kodama, A. (205). Influence of living alone on
emotional well-being in community-dwelling elderly persons. Geriatrics and
Gerontology International, 5, 152–158.
Mellor, D., Stokes, M., Firth, L., Hayashi, Y., & Cummins, R. (2008). Need for belonging,
relationship satisfaction, loneliness, and life satisfaction. Personality and Individual

Differences, 45(3), 213–218.
Yang, K., & Victor, C. R. (2008). The prevalence of and risk factors for loneliness among
older people in China. Ageing and Society, 28(3), 305–327.
Yang, K., & Victor, C. R. (2008). The prevalence of and risk factors for loneliness among
older people in China. Ageing and Society, 28(3), 305–327.
⊘ This is a preview!⊘
Do you want full access?
Subscribe today to unlock all pages.
Trusted by 1+ million students worldwide
1 out of 9

Your All-in-One AI-Powered Toolkit for Academic Success.
+13062052269
info@desklib.com
Available 24*7 on WhatsApp / Email
![[object Object]](/_next/static/media/star-bottom.7253800d.svg)
Unlock your academic potential
Copyright © 2020–2026 A2Z Services. All Rights Reserved. Developed and managed by ZUCOL.