Grand Canyon University PSY-380 Topic Six Homework Assignment
VerifiedAdded on 2022/08/13
|25
|6186
|378
Homework Assignment
AI Summary
This document presents a comprehensive solution to a PSY-380 Topic Six homework assignment, focusing on the application of Analysis of Variance (ANOVA) techniques. The assignment covers a wide range of concepts, including calculating degrees of freedom, interpreting F-tests, determining critical values, and making decisions based on significance levels. It includes problems involving one-way ANOVA, post hoc tests (Tukey's HSD), and the computation of effect sizes like omega-squared. The solutions demonstrate how to complete F-tables, identify significant factors, and differentiate between within-subjects and between-subjects designs. The assignment also explores the concepts of partial eta-squared and partial omega-squared, providing a thorough understanding of ANOVA principles and their practical application in psychological research scenarios, such as examining job satisfaction, memory recall, and classroom interventions. This homework covers various statistical concepts that are core to understanding and applying ANOVA in psychological research and data analysis.
3/3/2020 Topic Six Homework - PSY-380, section LS02/03/20, Spring 2020 | WebAssign
https://www.webassign.net/web/Student/Assignment-Responses/submit?dep=23286310&tags=autosave#question3961615_26 1/25
jjjtong23@gmail.com(
sign out)
PSY-380, section LS02/03/20, Spring 2020
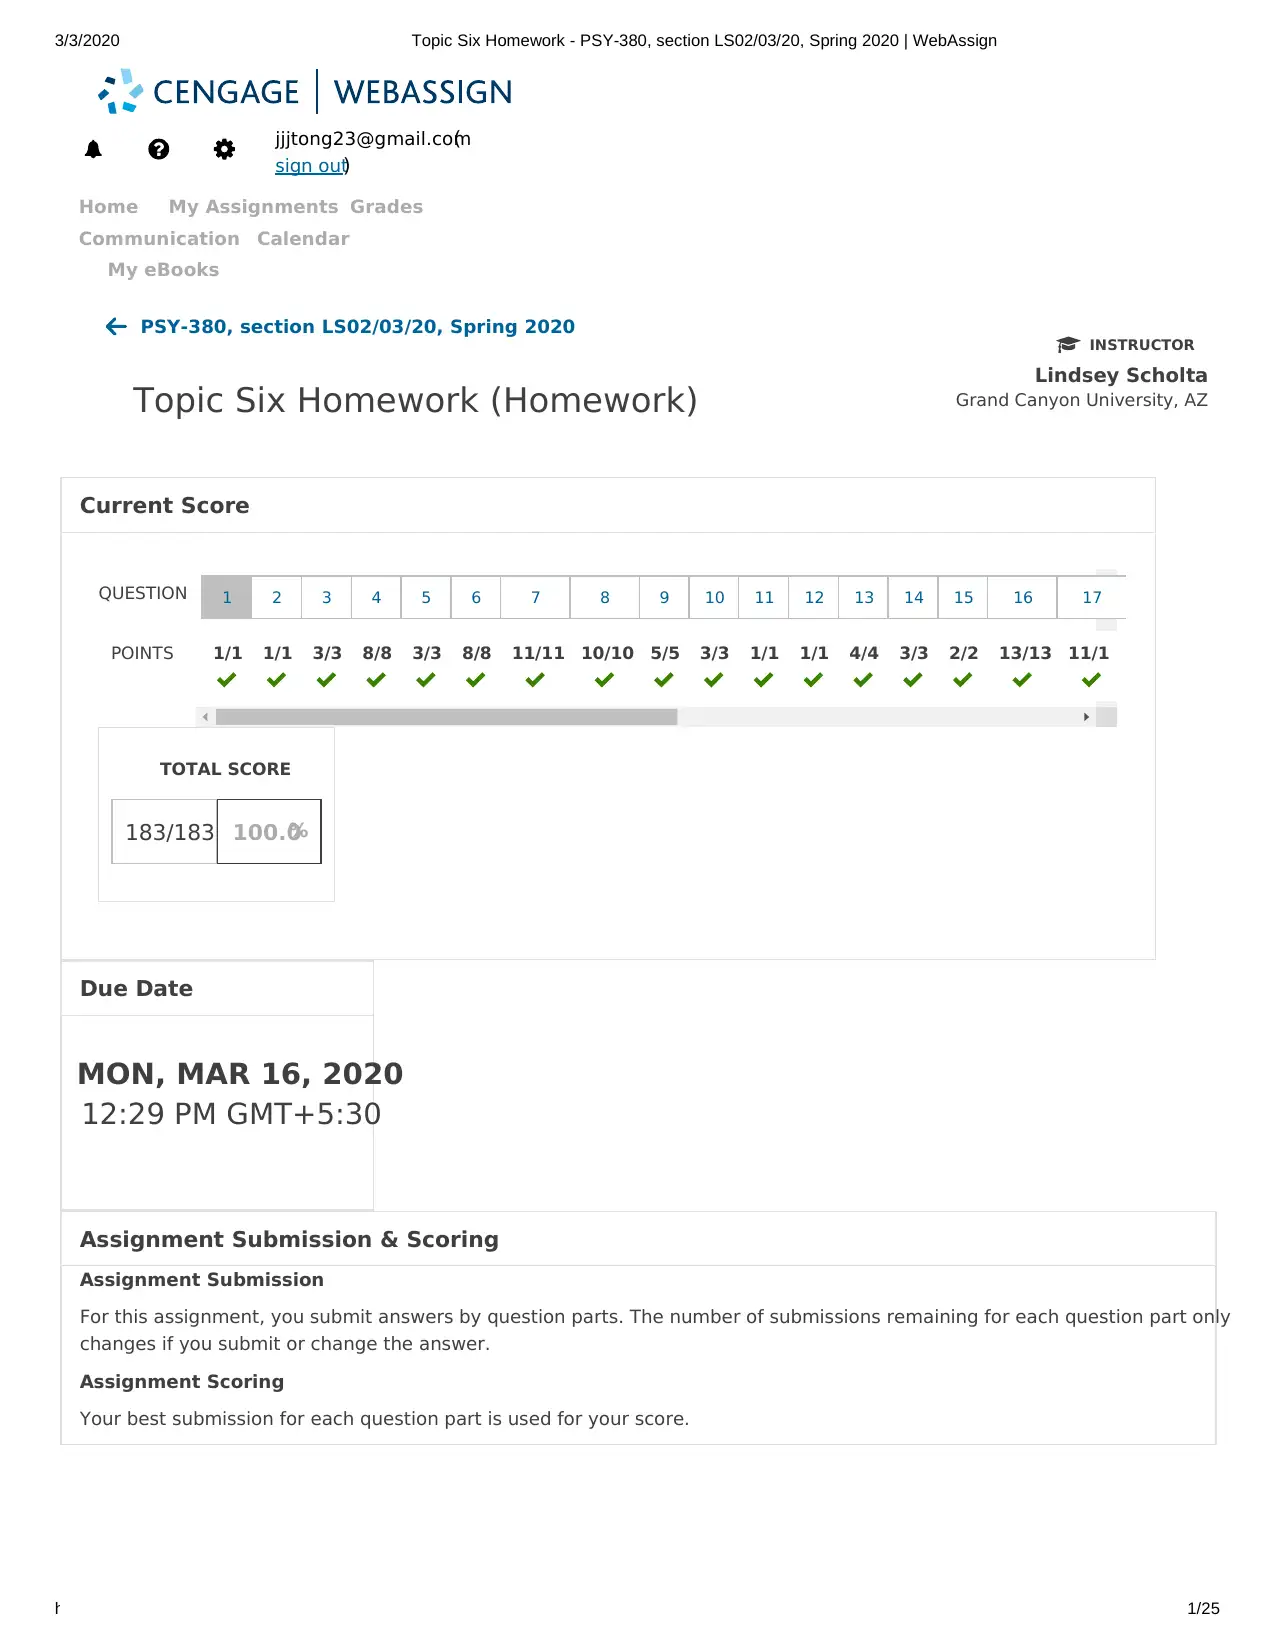
Topic Six Homework (Homework)
INSTRUCTOR
Lindsey Scholta
Grand Canyon University, AZ
Current Score
QUESTION
POINTS
TOTAL SCORE
183/183 100.0%
MON, MAR 16, 2020
12:29 PM GMT+5:30
Assignment Submission & Scoring
Assignment Submission
For this assignment, you submit answers by question parts. The number of submissions remaining for each question part only
changes if you submit or change the answer.
Assignment Scoring
Your best submission for each question part is used for your score.
1 2 3 4 5 6 7 8 9 10 11 12 13 14 15 16 17
Home My Assignments Grades
Communication Calendar
My eBooks
1/1 1/1 3/3 8/8 3/3 8/8 11/11 10/10 5/5 3/3 1/1 1/1 4/4 3/3 2/2 13/13 11/1
Due Date
https://www.webassign.net/web/Student/Assignment-Responses/submit?dep=23286310&tags=autosave#question3961615_26 1/25
jjjtong23@gmail.com(
sign out)
PSY-380, section LS02/03/20, Spring 2020
Topic Six Homework (Homework)
INSTRUCTOR
Lindsey Scholta
Grand Canyon University, AZ
Current Score
QUESTION
POINTS
TOTAL SCORE
183/183 100.0%
MON, MAR 16, 2020
12:29 PM GMT+5:30
Assignment Submission & Scoring
Assignment Submission
For this assignment, you submit answers by question parts. The number of submissions remaining for each question part only
changes if you submit or change the answer.
Assignment Scoring
Your best submission for each question part is used for your score.
1 2 3 4 5 6 7 8 9 10 11 12 13 14 15 16 17
Home My Assignments Grades
Communication Calendar
My eBooks
1/1 1/1 3/3 8/8 3/3 8/8 11/11 10/10 5/5 3/3 1/1 1/1 4/4 3/3 2/2 13/13 11/1
Due Date
Paraphrase This Document
Need a fresh take? Get an instant paraphrase of this document with our AI Paraphraser
3/3/2020 Topic Six Homework - PSY-380, section LS02/03/20, Spring 2020 | WebAssign
https://www.webassign.net/web/Student/Assignment-Responses/submit?dep=23286310&tags=autosave#question3961615_26 2/25
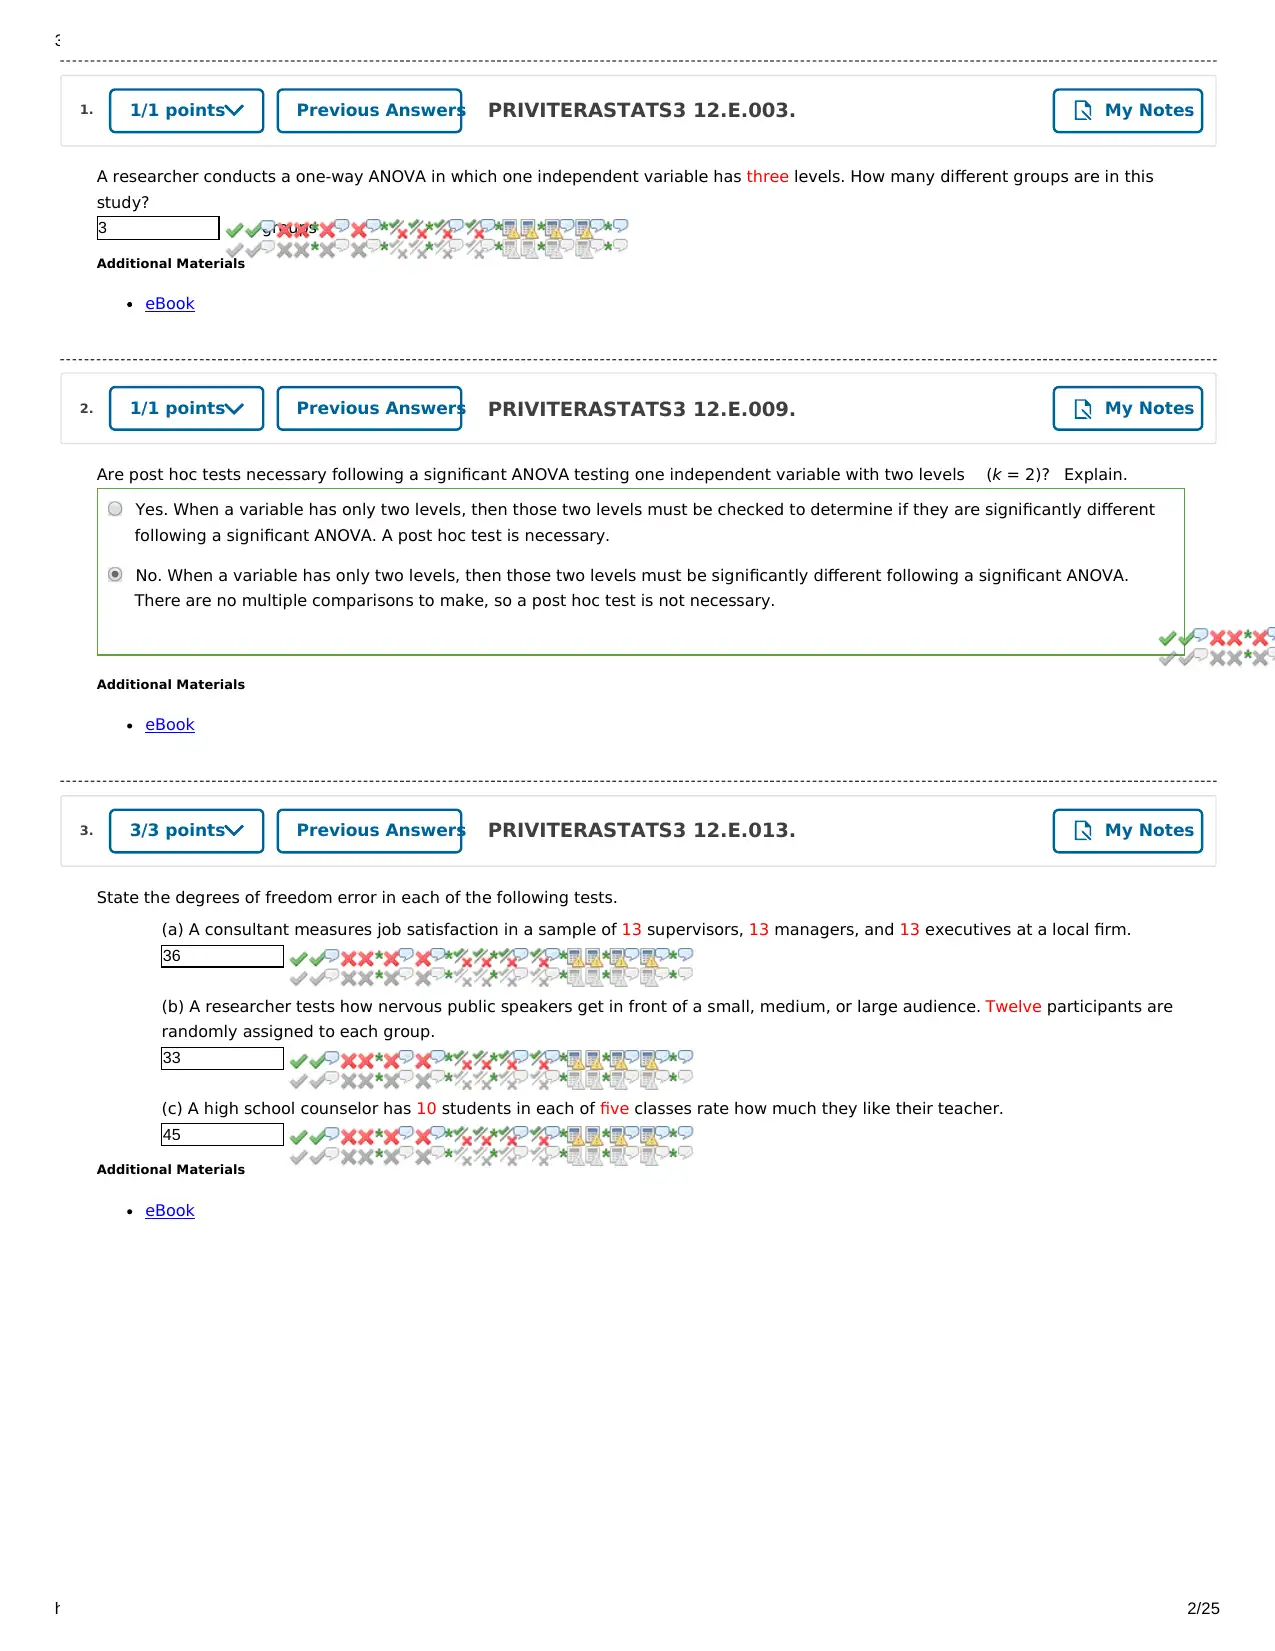
A researcher conducts a one-way ANOVA in which one independent variable has three levels. How many different groups are in this
study?
3 groups
Additional Materials
eBook
Are post hoc tests necessary following a significant ANOVA testing one independent variable with two levels Explain.
Additional Materials
eBook
State the degrees of freedom error in each of the following tests.
(a) A consultant measures job satisfaction in a sample of 13 supervisors, 13 managers, and 13 executives at a local firm.
36
(b) A researcher tests how nervous public speakers get in front of a small, medium, or large audience. Twelve participants are
randomly assigned to each group.
33
(c) A high school counselor has 10 students in each of five classes rate how much they like their teacher.
45
Additional Materials
eBook
(k = 2)?
Yes. When a variable has only two levels, then those two levels must be checked to determine if they are significantly different
following a significant ANOVA. A post hoc test is necessary.
No. When a variable has only two levels, then those two levels must be significantly different following a significant ANOVA.
There are no multiple comparisons to make, so a post hoc test is not necessary.
1. PRIVITERASTATS3 12.E.003.1/1 points Previous Answers My Notes
2. PRIVITERASTATS3 12.E.009.1/1 points Previous Answers My Notes
3. PRIVITERASTATS3 12.E.013.3/3 points Previous Answers My Notes
https://www.webassign.net/web/Student/Assignment-Responses/submit?dep=23286310&tags=autosave#question3961615_26 2/25
A researcher conducts a one-way ANOVA in which one independent variable has three levels. How many different groups are in this
study?
3 groups
Additional Materials
eBook
Are post hoc tests necessary following a significant ANOVA testing one independent variable with two levels Explain.
Additional Materials
eBook
State the degrees of freedom error in each of the following tests.
(a) A consultant measures job satisfaction in a sample of 13 supervisors, 13 managers, and 13 executives at a local firm.
36
(b) A researcher tests how nervous public speakers get in front of a small, medium, or large audience. Twelve participants are
randomly assigned to each group.
33
(c) A high school counselor has 10 students in each of five classes rate how much they like their teacher.
45
Additional Materials
eBook
(k = 2)?
Yes. When a variable has only two levels, then those two levels must be checked to determine if they are significantly different
following a significant ANOVA. A post hoc test is necessary.
No. When a variable has only two levels, then those two levels must be significantly different following a significant ANOVA.
There are no multiple comparisons to make, so a post hoc test is not necessary.
1. PRIVITERASTATS3 12.E.003.1/1 points Previous Answers My Notes
2. PRIVITERASTATS3 12.E.009.1/1 points Previous Answers My Notes
3. PRIVITERASTATS3 12.E.013.3/3 points Previous Answers My Notes
3/3/2020 Topic Six Homework - PSY-380, section LS02/03/20, Spring 2020 | WebAssign
https://www.webassign.net/web/Student/Assignment-Responses/submit?dep=23286310&tags=autosave#question3961615_26 3/25
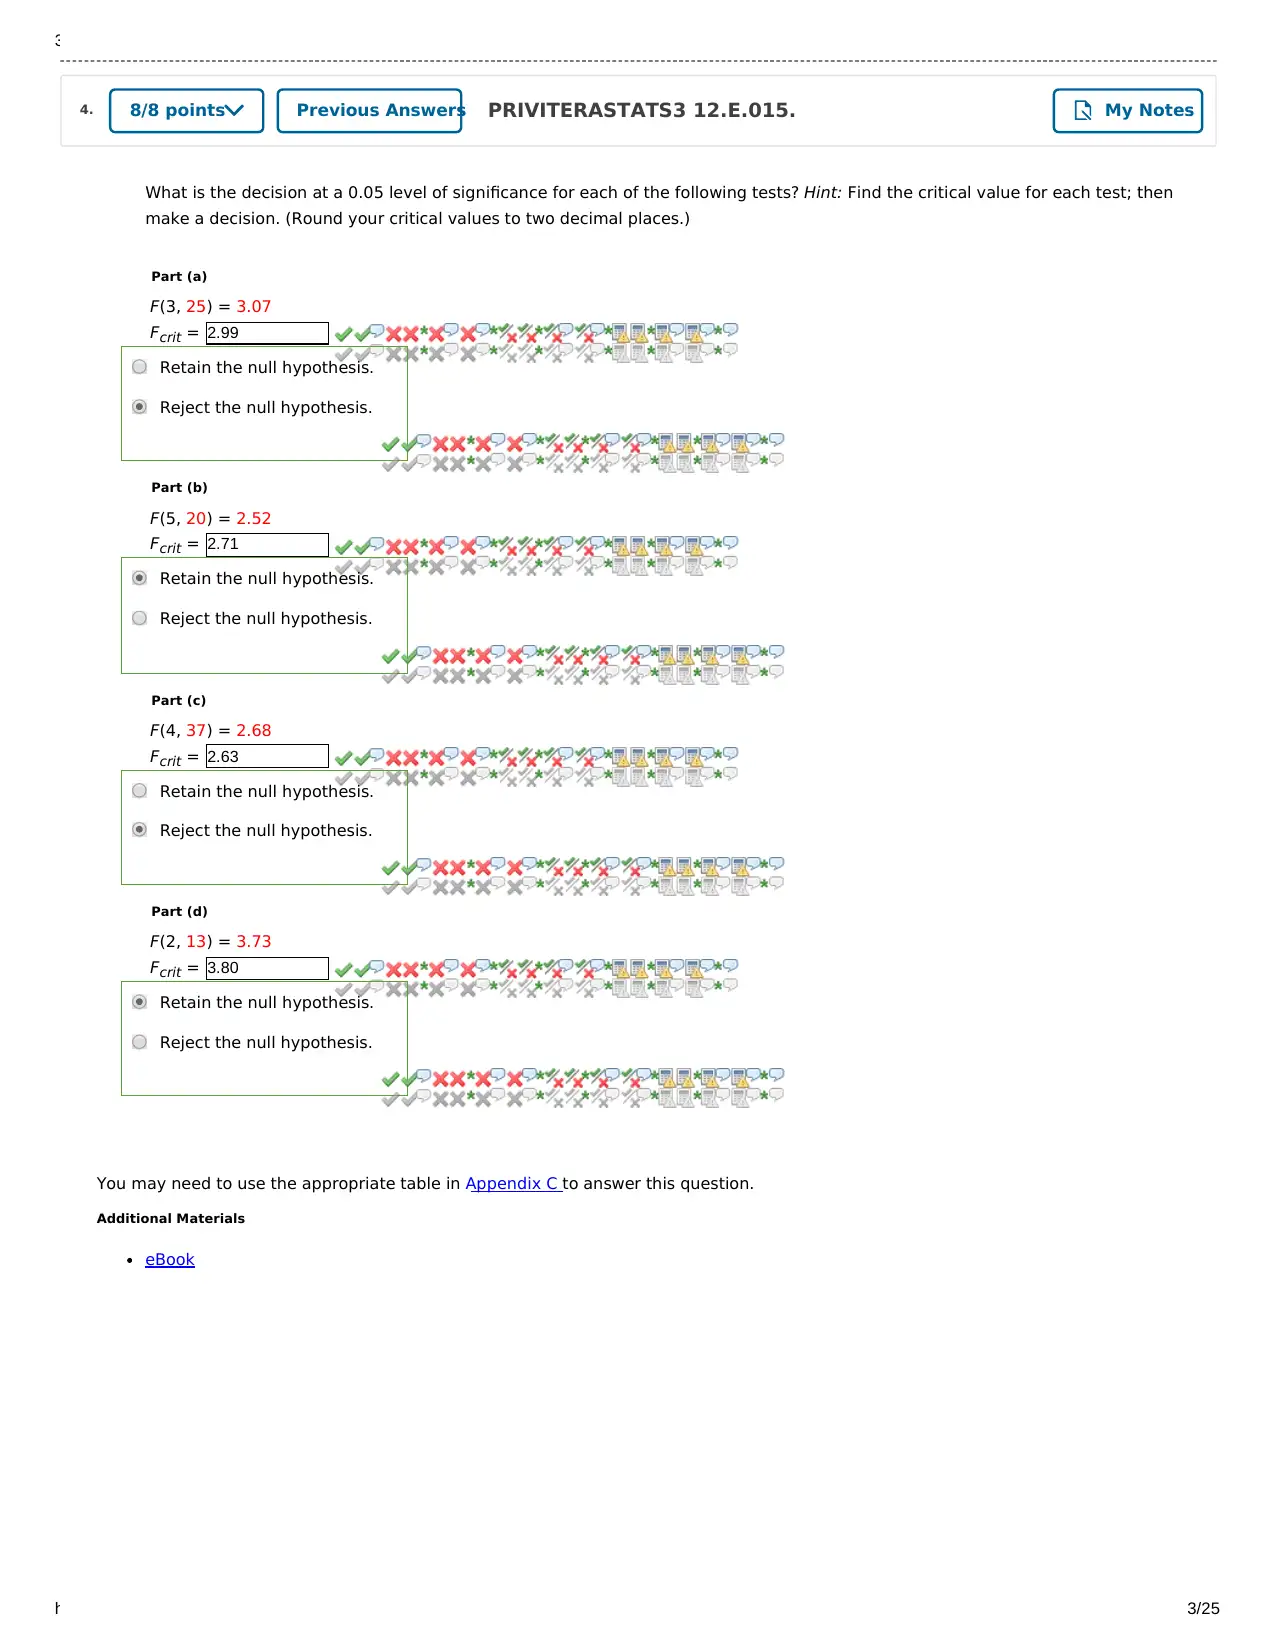
What is the decision at a 0.05 level of significance for each of the following tests? Hint: Find the critical value for each test; then
make a decision. (Round your critical values to two decimal places.)
Part (a)
Part (b)
Part (c)
Part (d)
You may need to use the appropriate table in Appendix C to answer this question.
Additional Materials
eBook
F(3, 25) = 3.07
Fcrit = 2.99
Retain the null hypothesis.
Reject the null hypothesis.
F(5, 20) = 2.52
Fcrit = 2.71
Retain the null hypothesis.
Reject the null hypothesis.
F(4, 37) = 2.68
Fcrit = 2.63
Retain the null hypothesis.
Reject the null hypothesis.
F(2, 13) = 3.73
Fcrit = 3.80
Retain the null hypothesis.
Reject the null hypothesis.
4. PRIVITERASTATS3 12.E.015.8/8 points Previous Answers My Notes
https://www.webassign.net/web/Student/Assignment-Responses/submit?dep=23286310&tags=autosave#question3961615_26 3/25
What is the decision at a 0.05 level of significance for each of the following tests? Hint: Find the critical value for each test; then
make a decision. (Round your critical values to two decimal places.)
Part (a)
Part (b)
Part (c)
Part (d)
You may need to use the appropriate table in Appendix C to answer this question.
Additional Materials
eBook
F(3, 25) = 3.07
Fcrit = 2.99
Retain the null hypothesis.
Reject the null hypothesis.
F(5, 20) = 2.52
Fcrit = 2.71
Retain the null hypothesis.
Reject the null hypothesis.
F(4, 37) = 2.68
Fcrit = 2.63
Retain the null hypothesis.
Reject the null hypothesis.
F(2, 13) = 3.73
Fcrit = 3.80
Retain the null hypothesis.
Reject the null hypothesis.
4. PRIVITERASTATS3 12.E.015.8/8 points Previous Answers My Notes
⊘ This is a preview!⊘
Do you want full access?
Subscribe today to unlock all pages.
Trusted by 1+ million students worldwide
3/3/2020 Topic Six Homework - PSY-380, section LS02/03/20, Spring 2020 | WebAssign
https://www.webassign.net/web/Student/Assignment-Responses/submit?dep=23286310&tags=autosave#question3961615_26 4/25
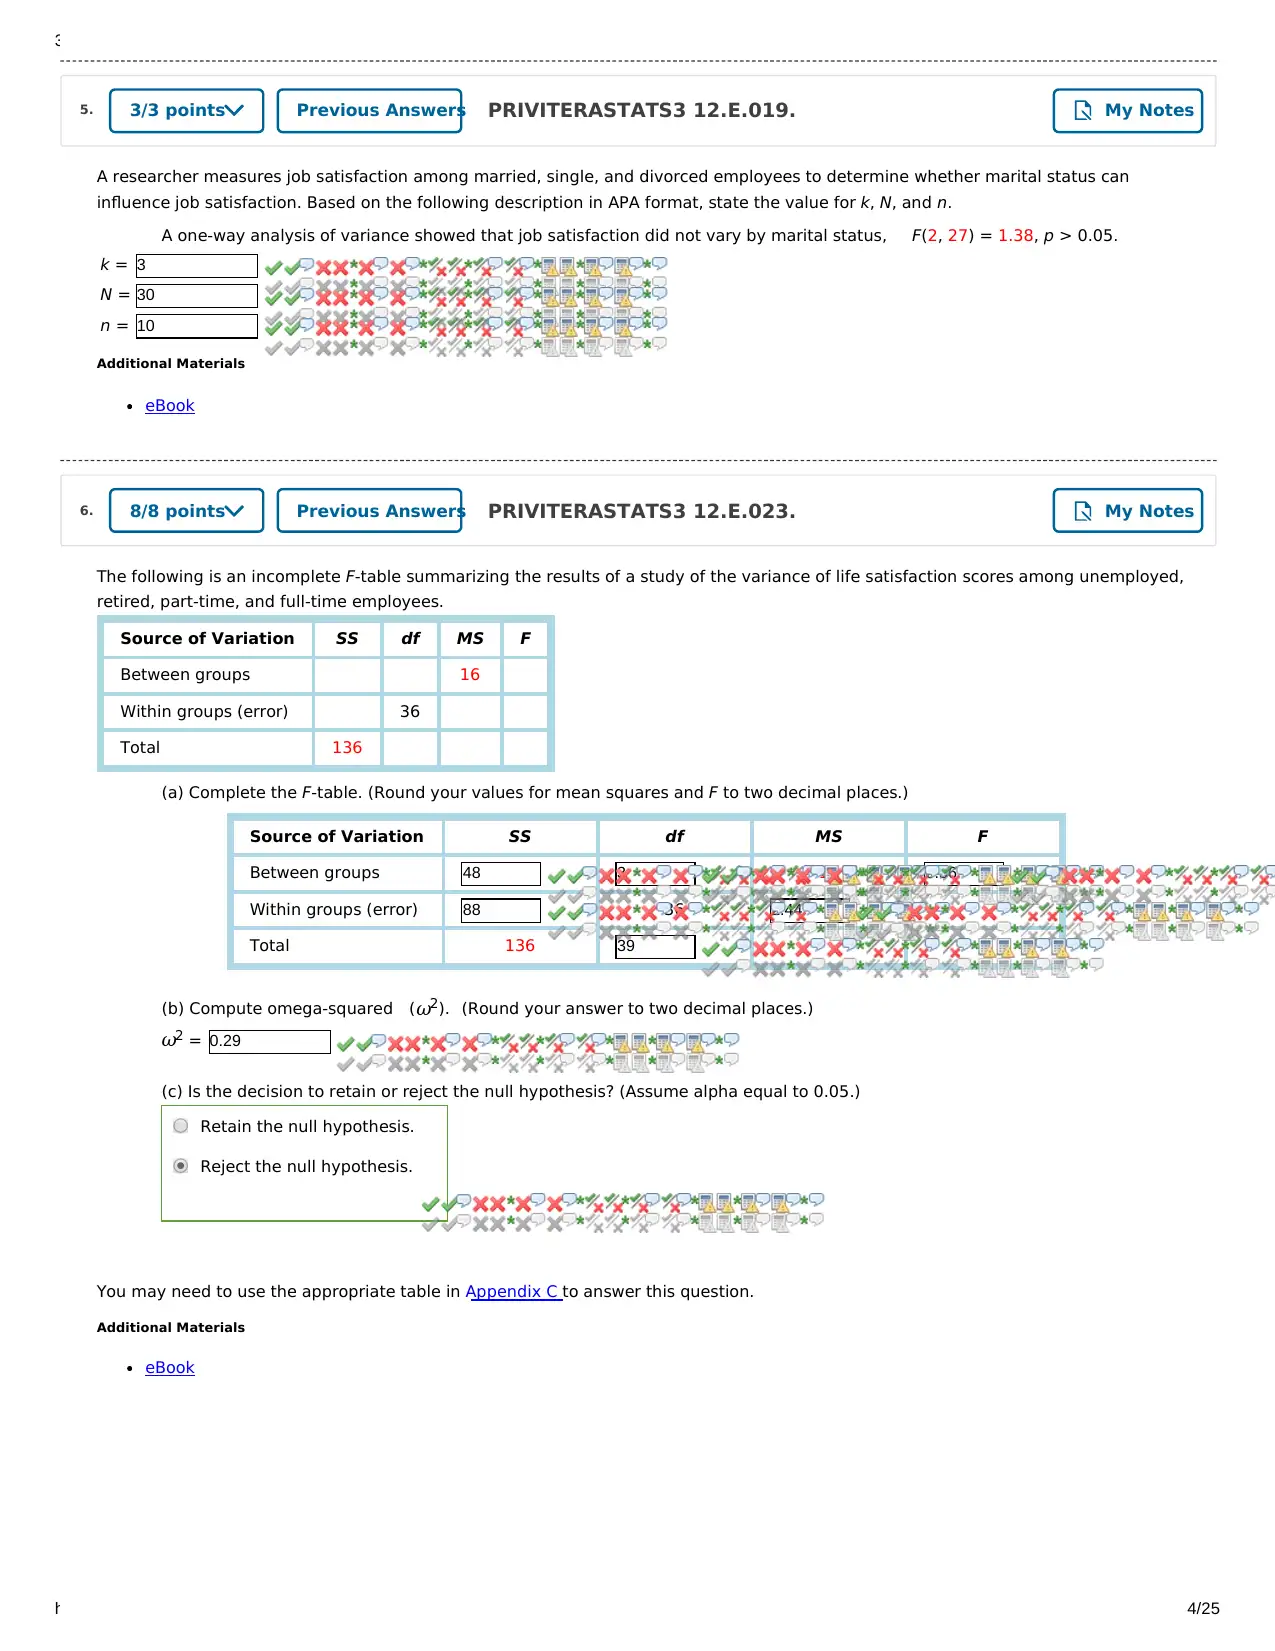
A researcher measures job satisfaction among married, single, and divorced employees to determine whether marital status can
influence job satisfaction. Based on the following description in APA format, state the value for k, N, and n.
A one-way analysis of variance showed that job satisfaction did not vary by marital status,
k = 3
N = 30
n = 10
Additional Materials
eBook
The following is an incomplete F-table summarizing the results of a study of the variance of life satisfaction scores among unemployed,
retired, part-time, and full-time employees.
Source of Variation SS df MS F
Between groups 16
Within groups (error) 36
Total 136
(a) Complete the F-table. (Round your values for mean squares and F to two decimal places.)
Source of Variation SS df MS F
Between groups 48 3 16 6.56
Within groups (error) 88 36 2.44
Total 136 39
(b) Compute omega-squared (Round your answer to two decimal places.)
ω2 = 0.29
(c) Is the decision to retain or reject the null hypothesis? (Assume alpha equal to 0.05.)
You may need to use the appropriate table in Appendix C to answer this question.
Additional Materials
eBook
F(2, 27) = 1.38, p > 0.05.
(ω2).
Retain the null hypothesis.
Reject the null hypothesis.
5. PRIVITERASTATS3 12.E.019.3/3 points Previous Answers My Notes
6. PRIVITERASTATS3 12.E.023.8/8 points Previous Answers My Notes
https://www.webassign.net/web/Student/Assignment-Responses/submit?dep=23286310&tags=autosave#question3961615_26 4/25
A researcher measures job satisfaction among married, single, and divorced employees to determine whether marital status can
influence job satisfaction. Based on the following description in APA format, state the value for k, N, and n.
A one-way analysis of variance showed that job satisfaction did not vary by marital status,
k = 3
N = 30
n = 10
Additional Materials
eBook
The following is an incomplete F-table summarizing the results of a study of the variance of life satisfaction scores among unemployed,
retired, part-time, and full-time employees.
Source of Variation SS df MS F
Between groups 16
Within groups (error) 36
Total 136
(a) Complete the F-table. (Round your values for mean squares and F to two decimal places.)
Source of Variation SS df MS F
Between groups 48 3 16 6.56
Within groups (error) 88 36 2.44
Total 136 39
(b) Compute omega-squared (Round your answer to two decimal places.)
ω2 = 0.29
(c) Is the decision to retain or reject the null hypothesis? (Assume alpha equal to 0.05.)
You may need to use the appropriate table in Appendix C to answer this question.
Additional Materials
eBook
F(2, 27) = 1.38, p > 0.05.
(ω2).
Retain the null hypothesis.
Reject the null hypothesis.
5. PRIVITERASTATS3 12.E.019.3/3 points Previous Answers My Notes
6. PRIVITERASTATS3 12.E.023.8/8 points Previous Answers My Notes
Paraphrase This Document
Need a fresh take? Get an instant paraphrase of this document with our AI Paraphraser
3/3/2020 Topic Six Homework - PSY-380, section LS02/03/20, Spring 2020 | WebAssign
https://www.webassign.net/web/Student/Assignment-Responses/submit?dep=23286310&tags=autosave#question3961615_26 5/25
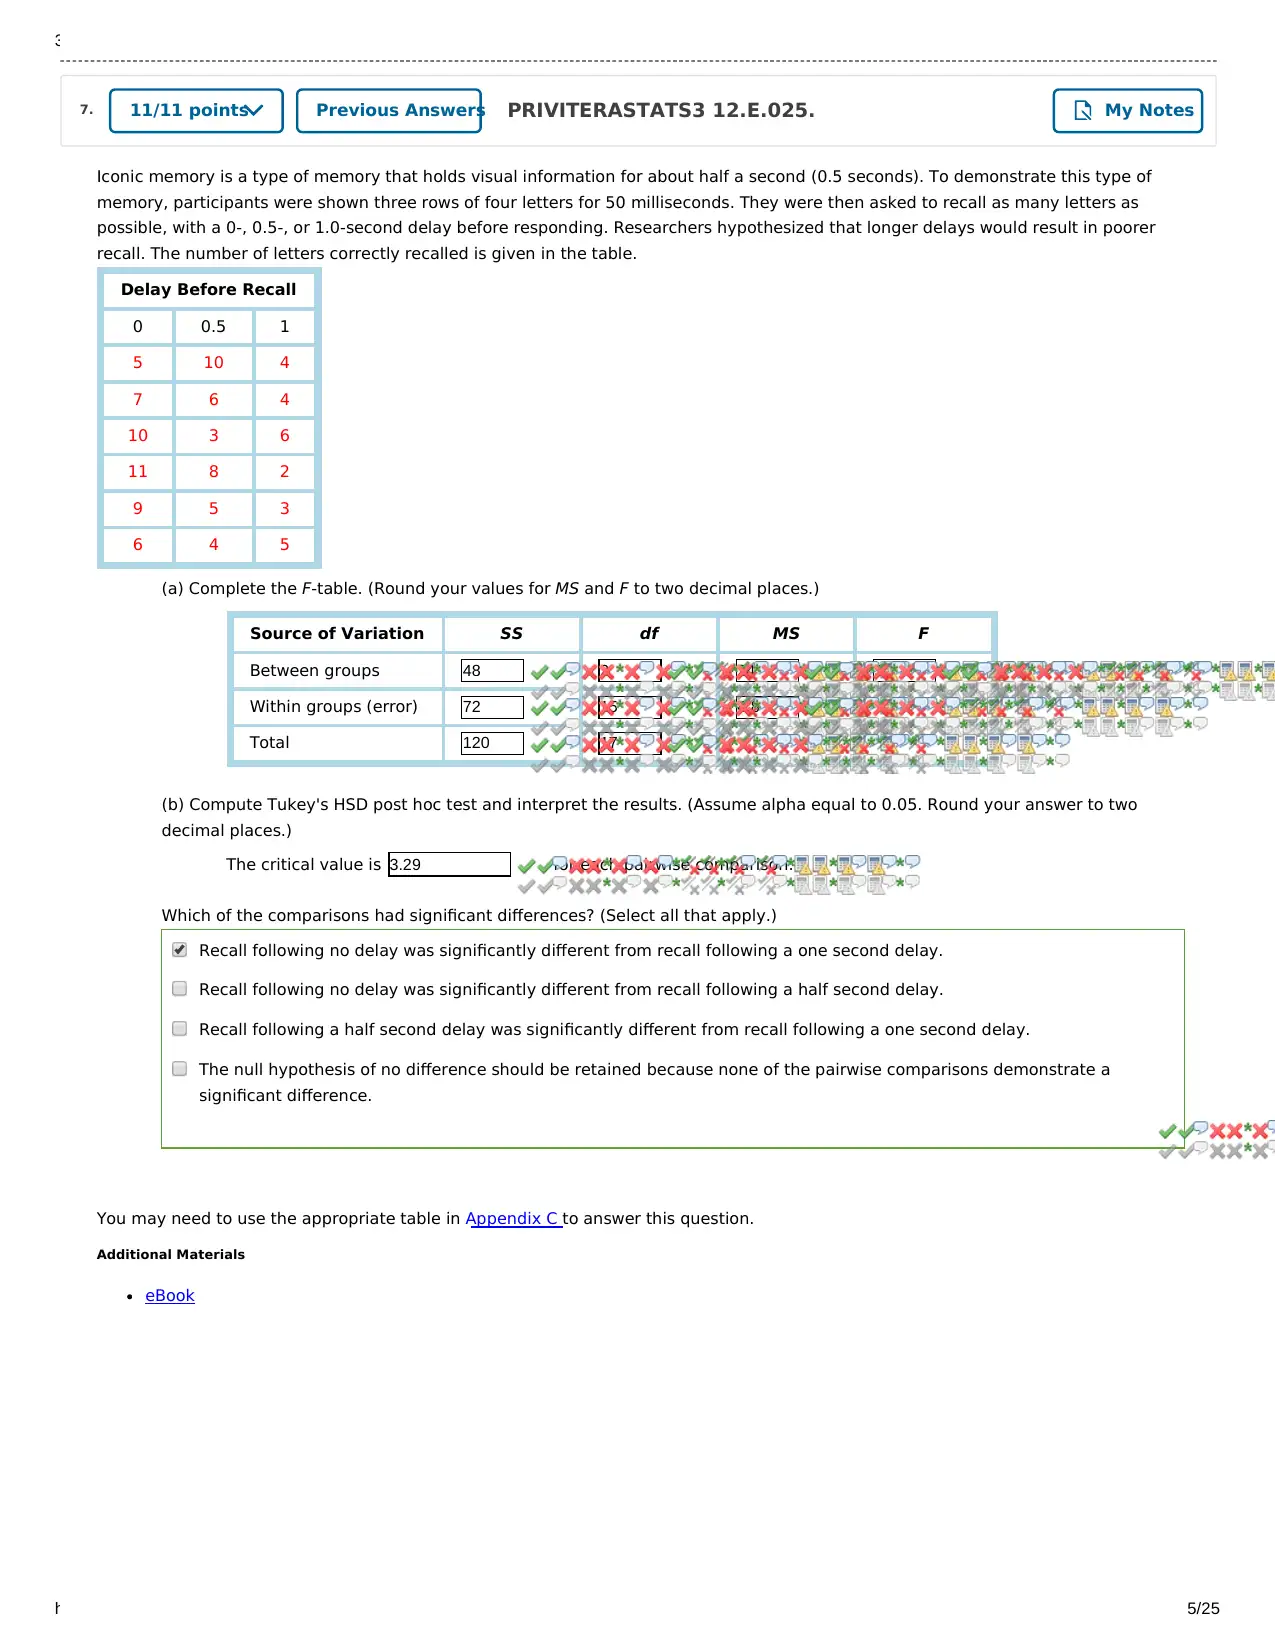
Iconic memory is a type of memory that holds visual information for about half a second (0.5 seconds). To demonstrate this type of
memory, participants were shown three rows of four letters for 50 milliseconds. They were then asked to recall as many letters as
possible, with a 0-, 0.5-, or 1.0-second delay before responding. Researchers hypothesized that longer delays would result in poorer
recall. The number of letters correctly recalled is given in the table.
Delay Before Recall
0 0.5 1
5 10 4
7 6 4
10 3 6
11 8 2
9 5 3
6 4 5
(a) Complete the F-table. (Round your values for MS and F to two decimal places.)
Source of Variation SS df MS F
Between groups 48 2 24 5
Within groups (error) 72 15 4.8
Total 120 17
(b) Compute Tukey's HSD post hoc test and interpret the results. (Assume alpha equal to 0.05. Round your answer to two
decimal places.)
The critical value is 3.29 for each pairwise comparison.
Which of the comparisons had significant differences? (Select all that apply.)
You may need to use the appropriate table in Appendix C to answer this question.
Additional Materials
eBook
Recall following no delay was significantly different from recall following a one second delay.
Recall following no delay was significantly different from recall following a half second delay.
Recall following a half second delay was significantly different from recall following a one second delay.
The null hypothesis of no difference should be retained because none of the pairwise comparisons demonstrate a
significant difference.
7. PRIVITERASTATS3 12.E.025.11/11 points Previous Answers My Notes
https://www.webassign.net/web/Student/Assignment-Responses/submit?dep=23286310&tags=autosave#question3961615_26 5/25
Iconic memory is a type of memory that holds visual information for about half a second (0.5 seconds). To demonstrate this type of
memory, participants were shown three rows of four letters for 50 milliseconds. They were then asked to recall as many letters as
possible, with a 0-, 0.5-, or 1.0-second delay before responding. Researchers hypothesized that longer delays would result in poorer
recall. The number of letters correctly recalled is given in the table.
Delay Before Recall
0 0.5 1
5 10 4
7 6 4
10 3 6
11 8 2
9 5 3
6 4 5
(a) Complete the F-table. (Round your values for MS and F to two decimal places.)
Source of Variation SS df MS F
Between groups 48 2 24 5
Within groups (error) 72 15 4.8
Total 120 17
(b) Compute Tukey's HSD post hoc test and interpret the results. (Assume alpha equal to 0.05. Round your answer to two
decimal places.)
The critical value is 3.29 for each pairwise comparison.
Which of the comparisons had significant differences? (Select all that apply.)
You may need to use the appropriate table in Appendix C to answer this question.
Additional Materials
eBook
Recall following no delay was significantly different from recall following a one second delay.
Recall following no delay was significantly different from recall following a half second delay.
Recall following a half second delay was significantly different from recall following a one second delay.
The null hypothesis of no difference should be retained because none of the pairwise comparisons demonstrate a
significant difference.
7. PRIVITERASTATS3 12.E.025.11/11 points Previous Answers My Notes
3/3/2020 Topic Six Homework - PSY-380, section LS02/03/20, Spring 2020 | WebAssign
https://www.webassign.net/web/Student/Assignment-Responses/submit?dep=23286310&tags=autosave#question3961615_26 6/25
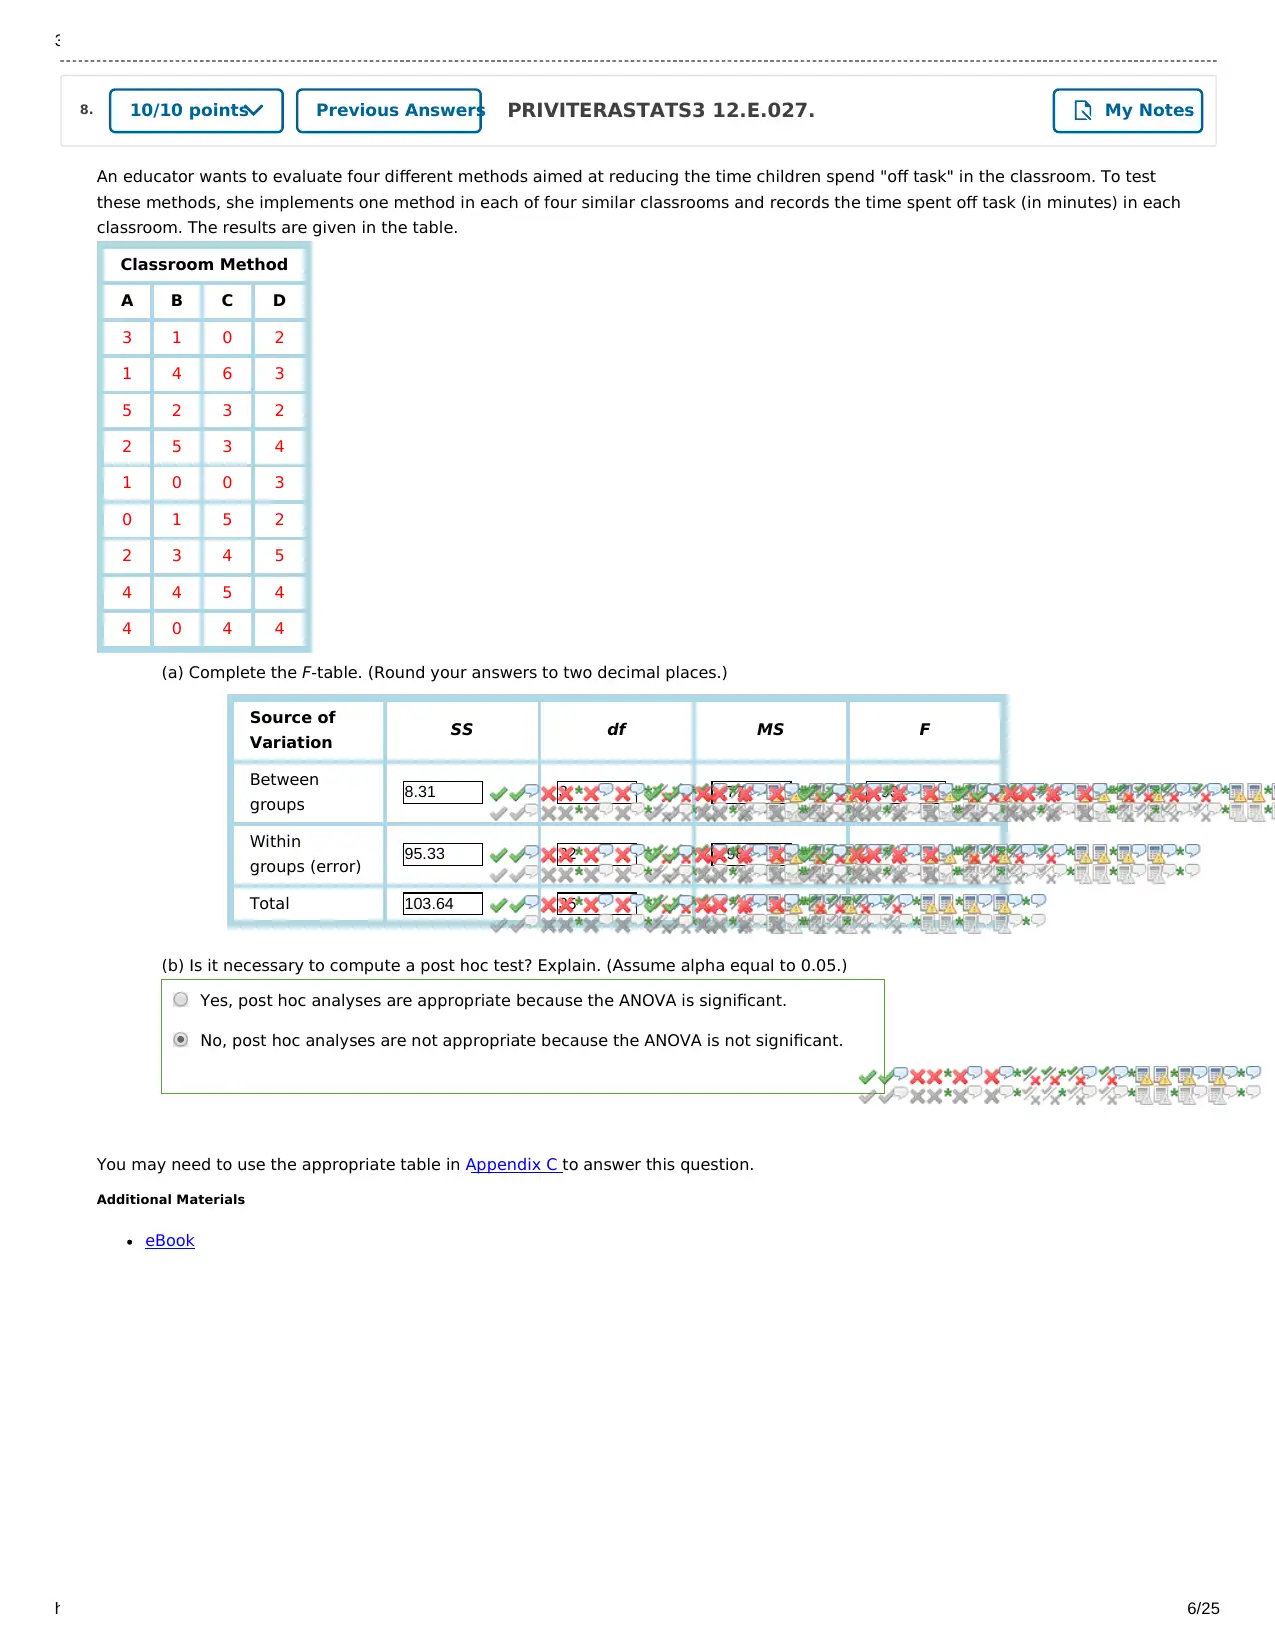
An educator wants to evaluate four different methods aimed at reducing the time children spend "off task" in the classroom. To test
these methods, she implements one method in each of four similar classrooms and records the time spent off task (in minutes) in each
classroom. The results are given in the table.
Classroom Method
A B C D
3 1 0 2
1 4 6 3
5 2 3 2
2 5 3 4
1 0 0 3
0 1 5 2
2 3 4 5
4 4 5 4
4 0 4 4
(a) Complete the F-table. (Round your answers to two decimal places.)
Source of
Variation SS df MS F
Between
groups 8.31 3 2.77 0.93
Within
groups (error) 95.33 32 2.98
Total 103.64 35
(b) Is it necessary to compute a post hoc test? Explain. (Assume alpha equal to 0.05.)
You may need to use the appropriate table in Appendix C to answer this question.
Additional Materials
eBook
Yes, post hoc analyses are appropriate because the ANOVA is significant.
No, post hoc analyses are not appropriate because the ANOVA is not significant.
8. PRIVITERASTATS3 12.E.027.10/10 points Previous Answers My Notes
https://www.webassign.net/web/Student/Assignment-Responses/submit?dep=23286310&tags=autosave#question3961615_26 6/25
An educator wants to evaluate four different methods aimed at reducing the time children spend "off task" in the classroom. To test
these methods, she implements one method in each of four similar classrooms and records the time spent off task (in minutes) in each
classroom. The results are given in the table.
Classroom Method
A B C D
3 1 0 2
1 4 6 3
5 2 3 2
2 5 3 4
1 0 0 3
0 1 5 2
2 3 4 5
4 4 5 4
4 0 4 4
(a) Complete the F-table. (Round your answers to two decimal places.)
Source of
Variation SS df MS F
Between
groups 8.31 3 2.77 0.93
Within
groups (error) 95.33 32 2.98
Total 103.64 35
(b) Is it necessary to compute a post hoc test? Explain. (Assume alpha equal to 0.05.)
You may need to use the appropriate table in Appendix C to answer this question.
Additional Materials
eBook
Yes, post hoc analyses are appropriate because the ANOVA is significant.
No, post hoc analyses are not appropriate because the ANOVA is not significant.
8. PRIVITERASTATS3 12.E.027.10/10 points Previous Answers My Notes
⊘ This is a preview!⊘
Do you want full access?
Subscribe today to unlock all pages.
Trusted by 1+ million students worldwide
3/3/2020 Topic Six Homework - PSY-380, section LS02/03/20, Spring 2020 | WebAssign
https://www.webassign.net/web/Student/Assignment-Responses/submit?dep=23286310&tags=autosave#question3961615_26 7/25
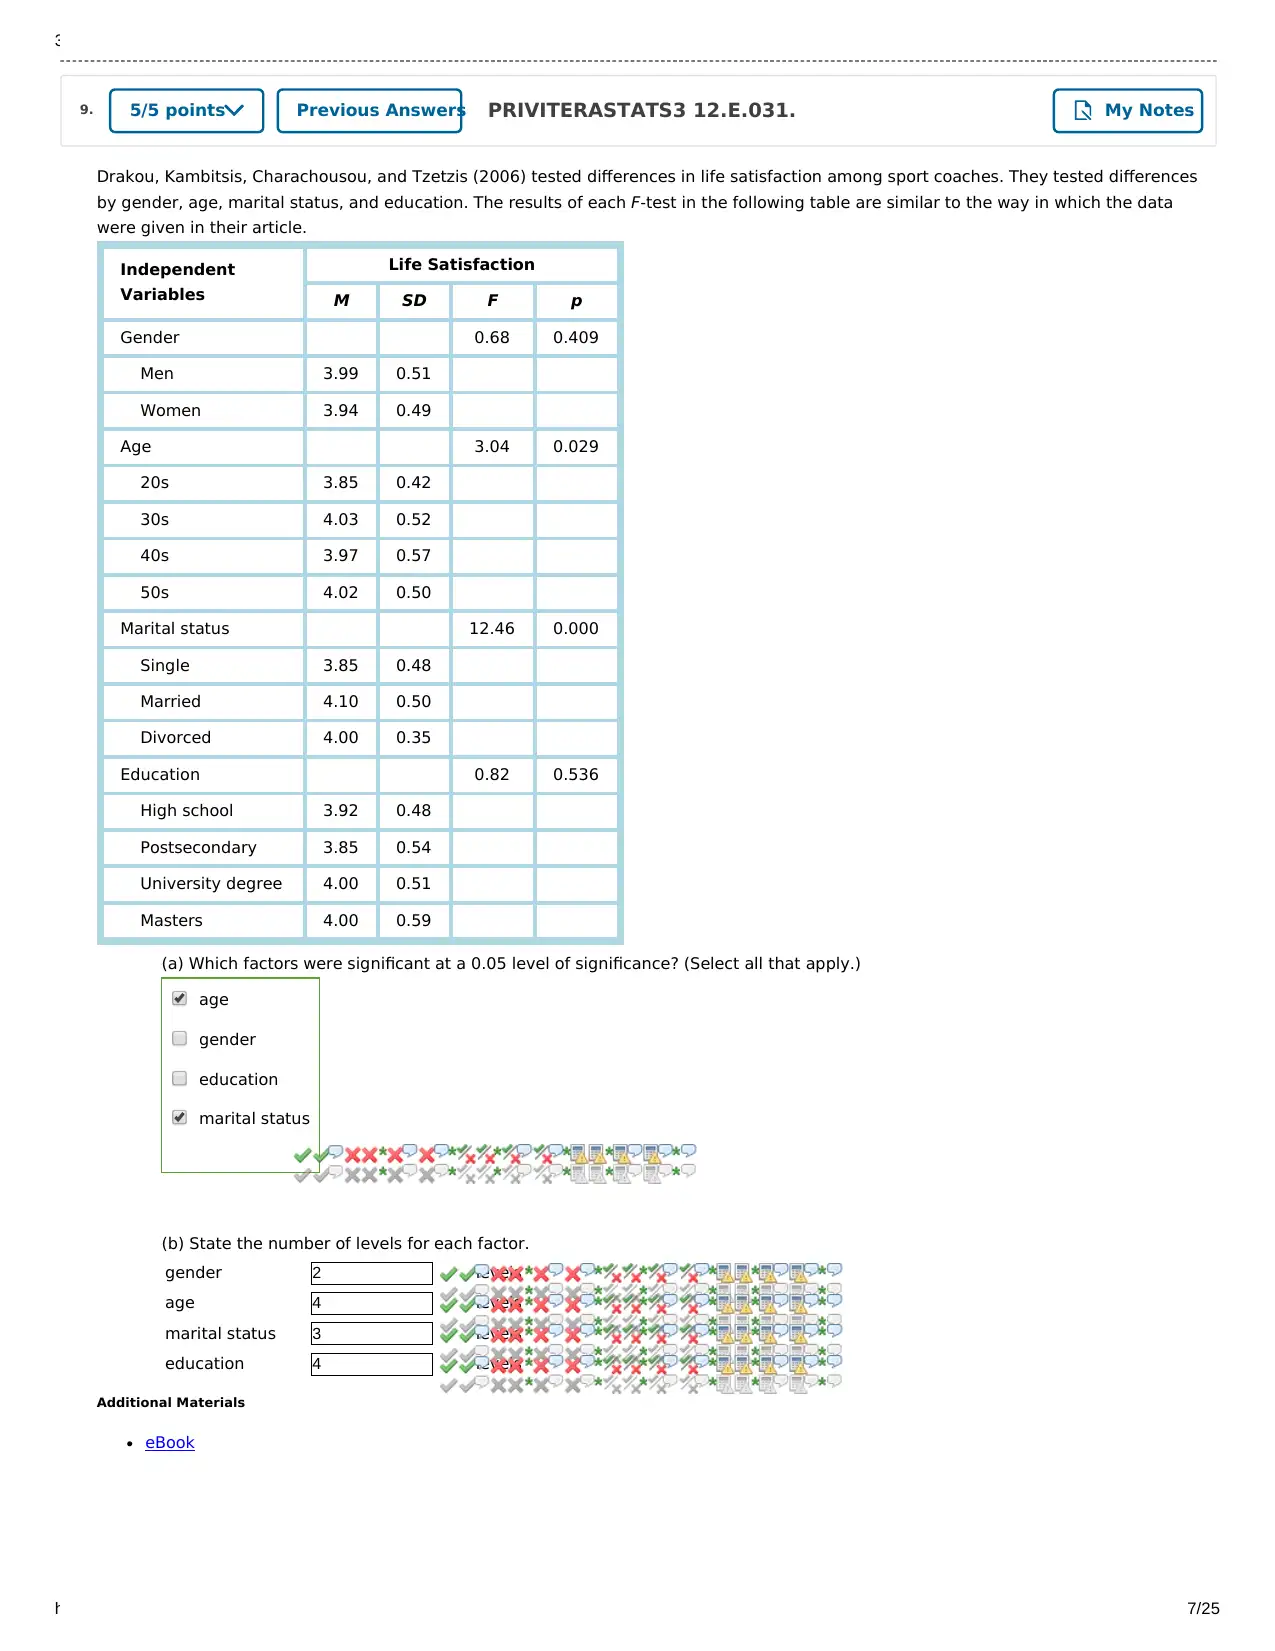
Drakou, Kambitsis, Charachousou, and Tzetzis (2006) tested differences in life satisfaction among sport coaches. They tested differences
by gender, age, marital status, and education. The results of each F-test in the following table are similar to the way in which the data
were given in their article.
Independent
Variables
Life Satisfaction
M SD F p
Gender 0.68 0.409
Men 3.99 0.51
Women 3.94 0.49
Age 3.04 0.029
20s 3.85 0.42
30s 4.03 0.52
40s 3.97 0.57
50s 4.02 0.50
Marital status 12.46 0.000
Single 3.85 0.48
Married 4.10 0.50
Divorced 4.00 0.35
Education 0.82 0.536
High school 3.92 0.48
Postsecondary 3.85 0.54
University degree 4.00 0.51
Masters 4.00 0.59
(a) Which factors were significant at a 0.05 level of significance? (Select all that apply.)
(b) State the number of levels for each factor.
gender 2 levels
age 4 levels
marital status 3 levels
education 4 levels
Additional Materials
eBook
age
gender
education
marital status
9. PRIVITERASTATS3 12.E.031.5/5 points Previous Answers My Notes
https://www.webassign.net/web/Student/Assignment-Responses/submit?dep=23286310&tags=autosave#question3961615_26 7/25
Drakou, Kambitsis, Charachousou, and Tzetzis (2006) tested differences in life satisfaction among sport coaches. They tested differences
by gender, age, marital status, and education. The results of each F-test in the following table are similar to the way in which the data
were given in their article.
Independent
Variables
Life Satisfaction
M SD F p
Gender 0.68 0.409
Men 3.99 0.51
Women 3.94 0.49
Age 3.04 0.029
20s 3.85 0.42
30s 4.03 0.52
40s 3.97 0.57
50s 4.02 0.50
Marital status 12.46 0.000
Single 3.85 0.48
Married 4.10 0.50
Divorced 4.00 0.35
Education 0.82 0.536
High school 3.92 0.48
Postsecondary 3.85 0.54
University degree 4.00 0.51
Masters 4.00 0.59
(a) Which factors were significant at a 0.05 level of significance? (Select all that apply.)
(b) State the number of levels for each factor.
gender 2 levels
age 4 levels
marital status 3 levels
education 4 levels
Additional Materials
eBook
age
gender
education
marital status
9. PRIVITERASTATS3 12.E.031.5/5 points Previous Answers My Notes
Paraphrase This Document
Need a fresh take? Get an instant paraphrase of this document with our AI Paraphraser
3/3/2020 Topic Six Homework - PSY-380, section LS02/03/20, Spring 2020 | WebAssign
https://www.webassign.net/web/Student/Assignment-Responses/submit?dep=23286310&tags=autosave#question3961615_26 8/25
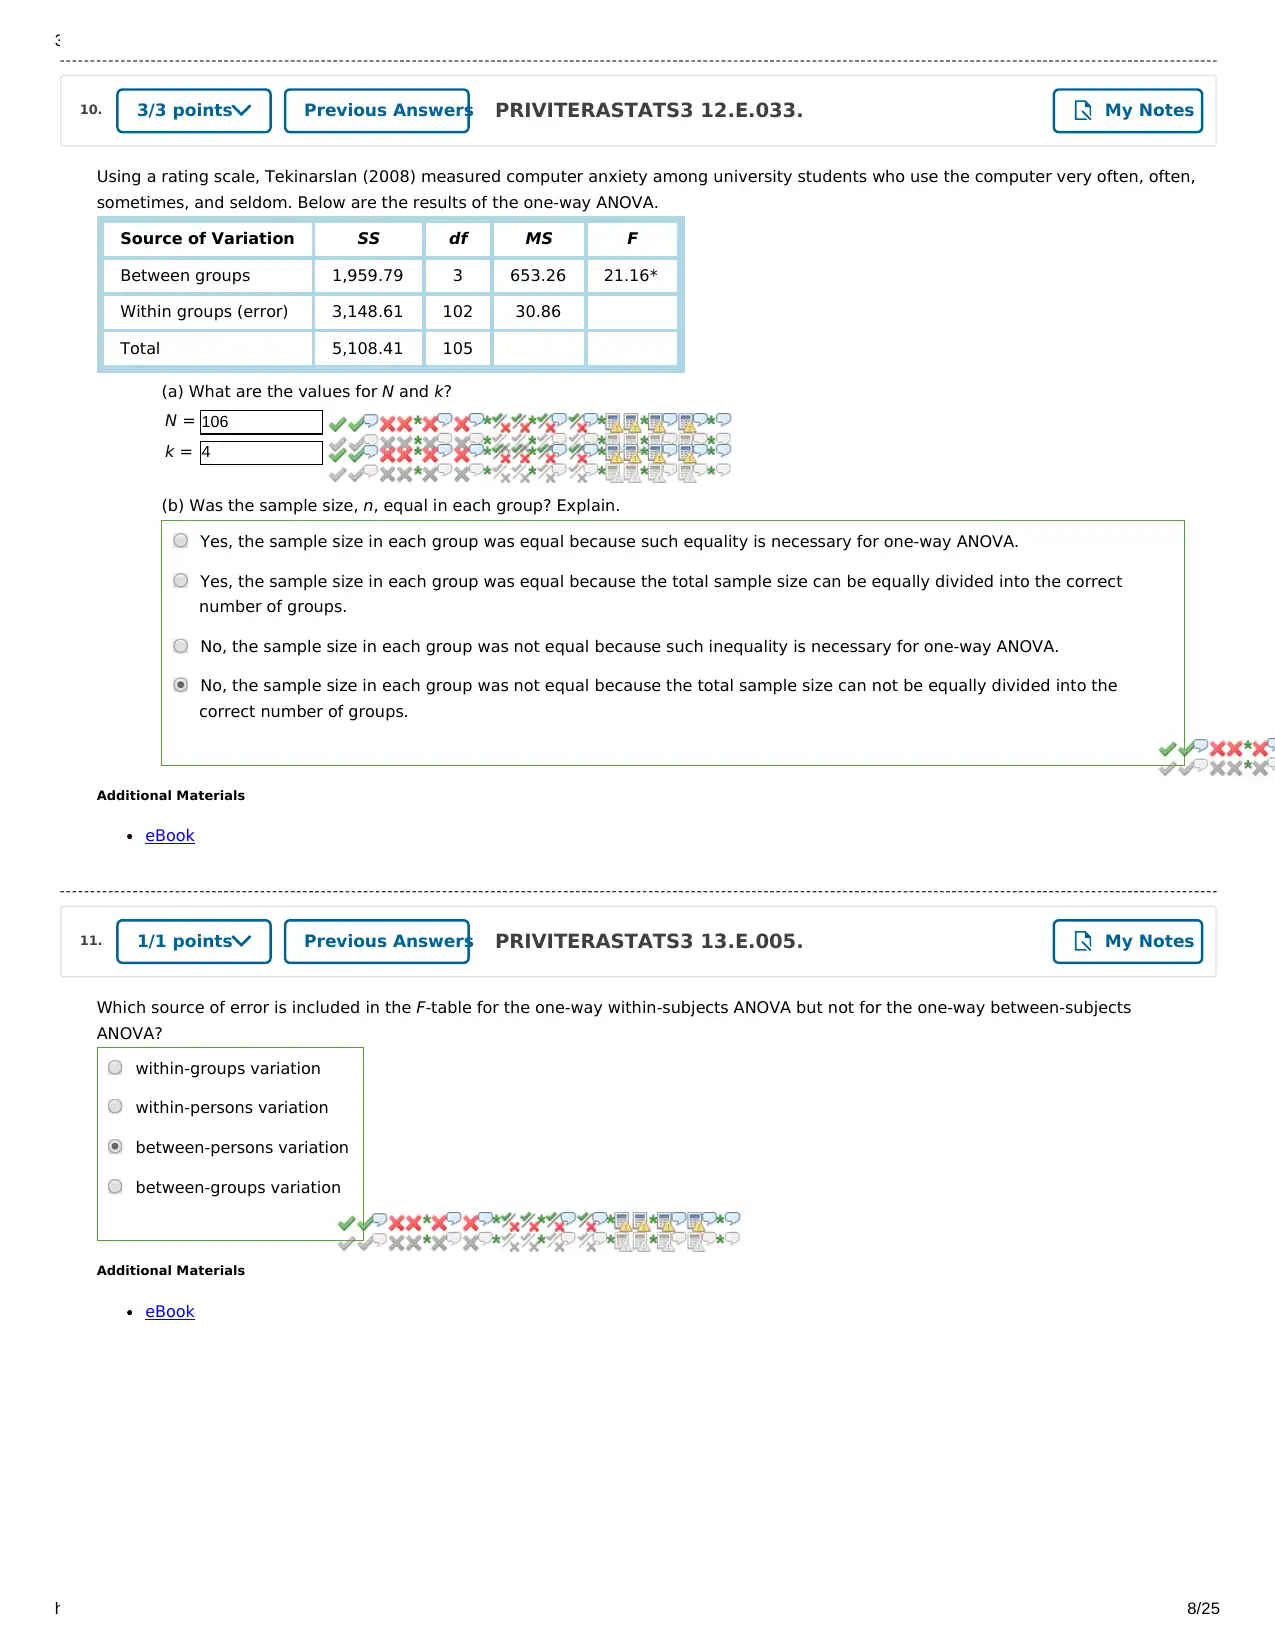
Using a rating scale, Tekinarslan (2008) measured computer anxiety among university students who use the computer very often, often,
sometimes, and seldom. Below are the results of the one-way ANOVA.
Source of Variation SS df MS F
Between groups 1,959.79 3 653.26 21.16*
Within groups (error) 3,148.61 102 30.86
Total 5,108.41 105
(a) What are the values for N and k?
N = 106
k = 4
(b) Was the sample size, n, equal in each group? Explain.
Additional Materials
eBook
Which source of error is included in the F-table for the one-way within-subjects ANOVA but not for the one-way between-subjects
ANOVA?
Additional Materials
eBook
Yes, the sample size in each group was equal because such equality is necessary for one-way ANOVA.
Yes, the sample size in each group was equal because the total sample size can be equally divided into the correct
number of groups.
No, the sample size in each group was not equal because such inequality is necessary for one-way ANOVA.
No, the sample size in each group was not equal because the total sample size can not be equally divided into the
correct number of groups.
within-groups variation
within-persons variation
between-persons variation
between-groups variation
10. PRIVITERASTATS3 12.E.033.3/3 points Previous Answers My Notes
11. PRIVITERASTATS3 13.E.005.1/1 points Previous Answers My Notes
https://www.webassign.net/web/Student/Assignment-Responses/submit?dep=23286310&tags=autosave#question3961615_26 8/25
Using a rating scale, Tekinarslan (2008) measured computer anxiety among university students who use the computer very often, often,
sometimes, and seldom. Below are the results of the one-way ANOVA.
Source of Variation SS df MS F
Between groups 1,959.79 3 653.26 21.16*
Within groups (error) 3,148.61 102 30.86
Total 5,108.41 105
(a) What are the values for N and k?
N = 106
k = 4
(b) Was the sample size, n, equal in each group? Explain.
Additional Materials
eBook
Which source of error is included in the F-table for the one-way within-subjects ANOVA but not for the one-way between-subjects
ANOVA?
Additional Materials
eBook
Yes, the sample size in each group was equal because such equality is necessary for one-way ANOVA.
Yes, the sample size in each group was equal because the total sample size can be equally divided into the correct
number of groups.
No, the sample size in each group was not equal because such inequality is necessary for one-way ANOVA.
No, the sample size in each group was not equal because the total sample size can not be equally divided into the
correct number of groups.
within-groups variation
within-persons variation
between-persons variation
between-groups variation
10. PRIVITERASTATS3 12.E.033.3/3 points Previous Answers My Notes
11. PRIVITERASTATS3 13.E.005.1/1 points Previous Answers My Notes
3/3/2020 Topic Six Homework - PSY-380, section LS02/03/20, Spring 2020 | WebAssign
https://www.webassign.net/web/Student/Assignment-Responses/submit?dep=23286310&tags=autosave#question3961615_26 9/25
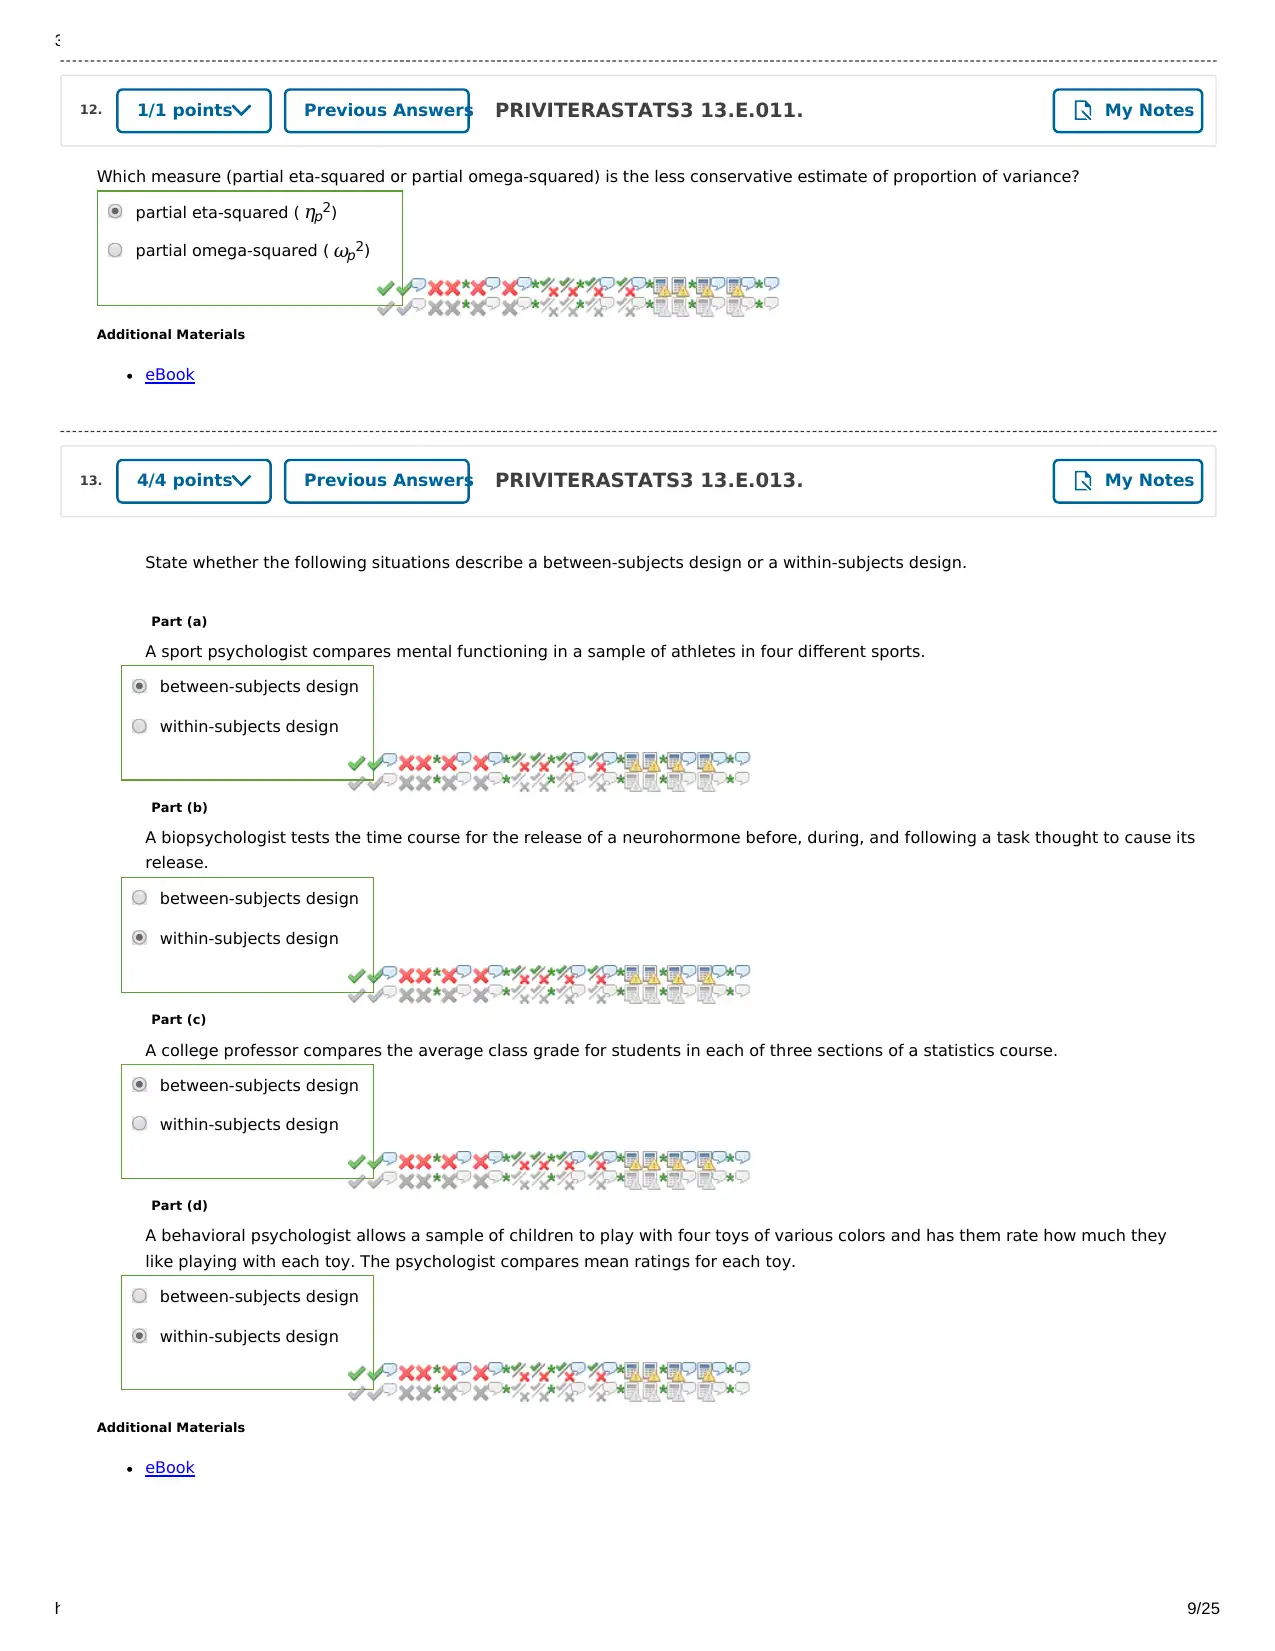
Which measure (partial eta-squared or partial omega-squared) is the less conservative estimate of proportion of variance?
Additional Materials
eBook
State whether the following situations describe a between-subjects design or a within-subjects design.
Part (a)
Part (b)
Part (c)
Part (d)
Additional Materials
eBook
partial eta-squared ( ηp2)
partial omega-squared ( ωp2)
A sport psychologist compares mental functioning in a sample of athletes in four different sports.
between-subjects design
within-subjects design
A biopsychologist tests the time course for the release of a neurohormone before, during, and following a task thought to cause its
release.
between-subjects design
within-subjects design
A college professor compares the average class grade for students in each of three sections of a statistics course.
between-subjects design
within-subjects design
A behavioral psychologist allows a sample of children to play with four toys of various colors and has them rate how much they
like playing with each toy. The psychologist compares mean ratings for each toy.
between-subjects design
within-subjects design
12. PRIVITERASTATS3 13.E.011.1/1 points Previous Answers My Notes
13. PRIVITERASTATS3 13.E.013.4/4 points Previous Answers My Notes
https://www.webassign.net/web/Student/Assignment-Responses/submit?dep=23286310&tags=autosave#question3961615_26 9/25
Which measure (partial eta-squared or partial omega-squared) is the less conservative estimate of proportion of variance?
Additional Materials
eBook
State whether the following situations describe a between-subjects design or a within-subjects design.
Part (a)
Part (b)
Part (c)
Part (d)
Additional Materials
eBook
partial eta-squared ( ηp2)
partial omega-squared ( ωp2)
A sport psychologist compares mental functioning in a sample of athletes in four different sports.
between-subjects design
within-subjects design
A biopsychologist tests the time course for the release of a neurohormone before, during, and following a task thought to cause its
release.
between-subjects design
within-subjects design
A college professor compares the average class grade for students in each of three sections of a statistics course.
between-subjects design
within-subjects design
A behavioral psychologist allows a sample of children to play with four toys of various colors and has them rate how much they
like playing with each toy. The psychologist compares mean ratings for each toy.
between-subjects design
within-subjects design
12. PRIVITERASTATS3 13.E.011.1/1 points Previous Answers My Notes
13. PRIVITERASTATS3 13.E.013.4/4 points Previous Answers My Notes
⊘ This is a preview!⊘
Do you want full access?
Subscribe today to unlock all pages.
Trusted by 1+ million students worldwide
3/3/2020 Topic Six Homework - PSY-380, section LS02/03/20, Spring 2020 | WebAssign
https://www.webassign.net/web/Student/Assignment-Responses/submit?dep=23286310&tags=autosave#question3961615_26 10/25
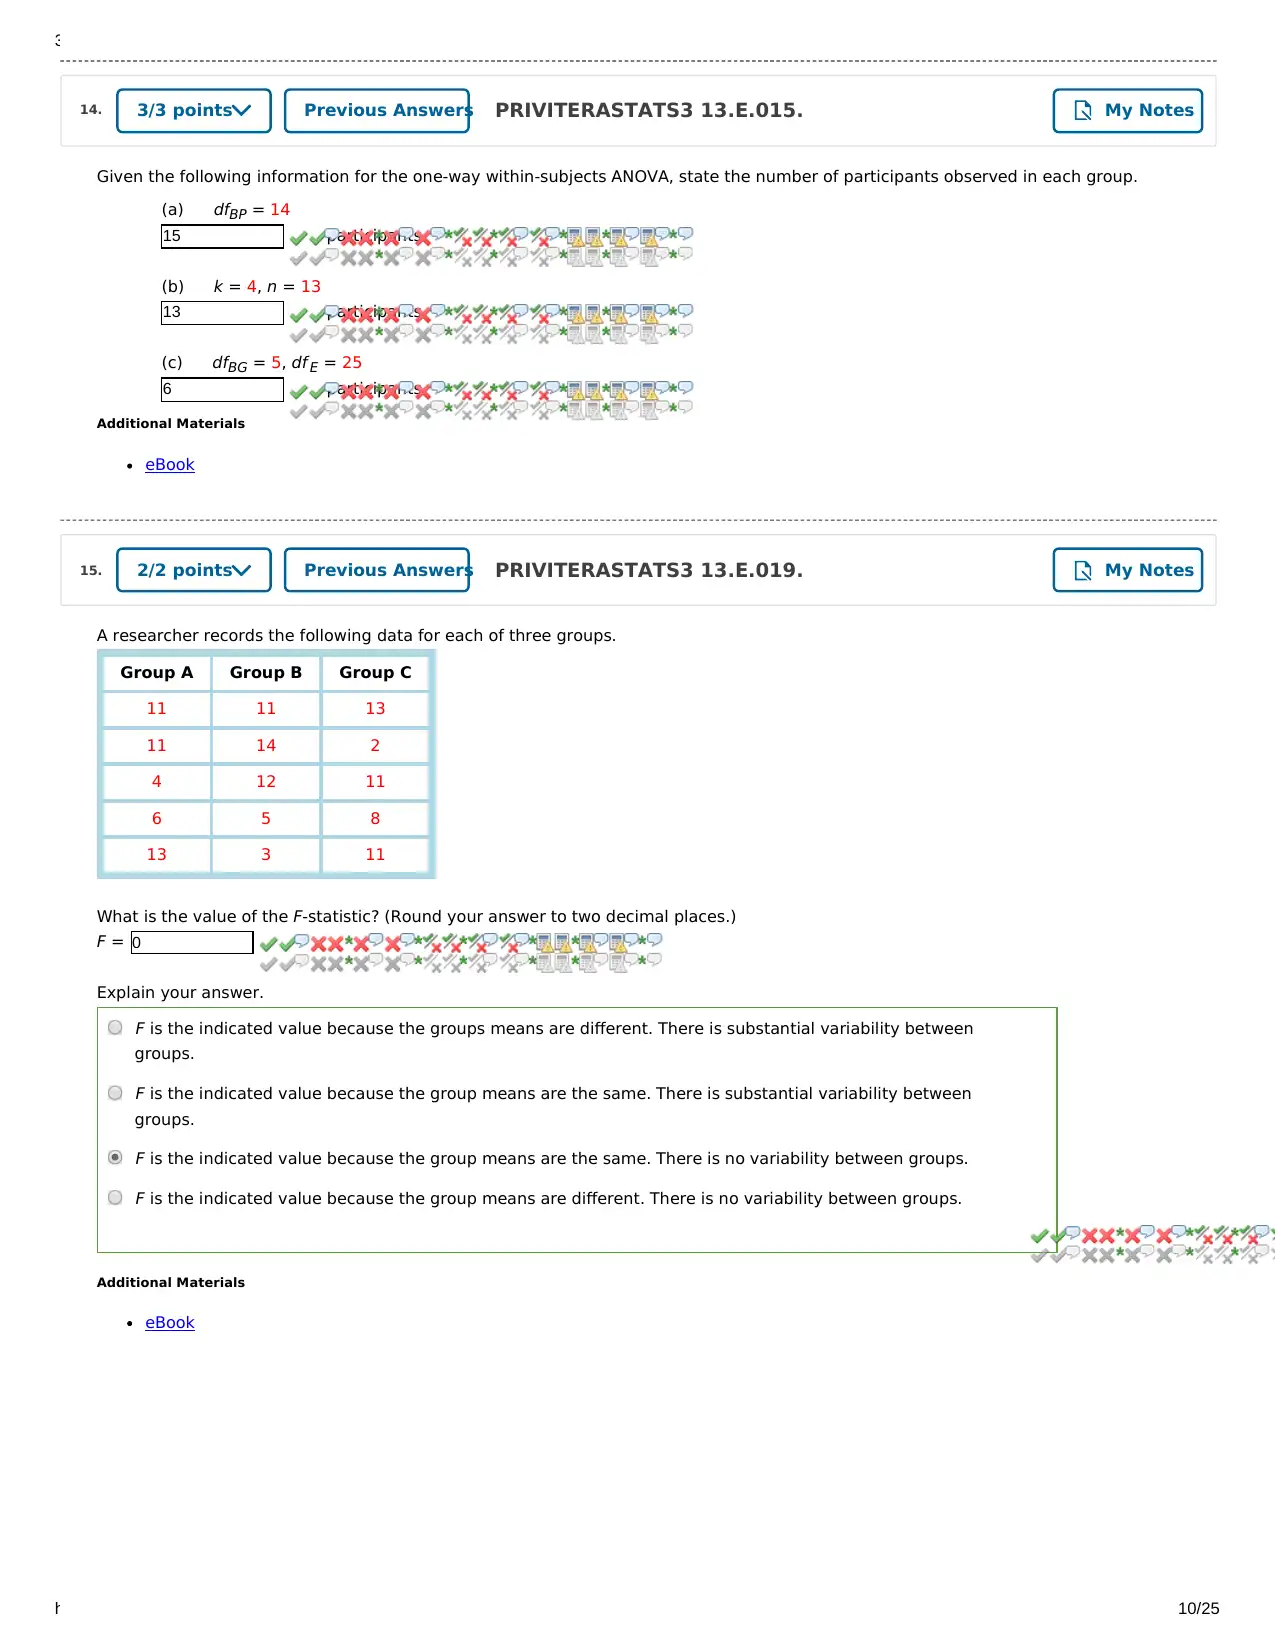
Given the following information for the one-way within-subjects ANOVA, state the number of participants observed in each group.
(a)
15 participants
(b)
13 participants
(c)
6 participants
Additional Materials
eBook
A researcher records the following data for each of three groups.
Group A Group B Group C
11 11 13
11 14 2
4 12 11
6 5 8
13 3 11
What is the value of the F-statistic? (Round your answer to two decimal places.)
F = 0
Explain your answer.
Additional Materials
eBook
dfBP = 14
k = 4, n = 13
dfBG = 5, df E = 25
F is the indicated value because the groups means are different. There is substantial variability between
groups.
F is the indicated value because the group means are the same. There is substantial variability between
groups.
F is the indicated value because the group means are the same. There is no variability between groups.
F is the indicated value because the group means are different. There is no variability between groups.
14. PRIVITERASTATS3 13.E.015.3/3 points Previous Answers My Notes
15. PRIVITERASTATS3 13.E.019.2/2 points Previous Answers My Notes
https://www.webassign.net/web/Student/Assignment-Responses/submit?dep=23286310&tags=autosave#question3961615_26 10/25
Given the following information for the one-way within-subjects ANOVA, state the number of participants observed in each group.
(a)
15 participants
(b)
13 participants
(c)
6 participants
Additional Materials
eBook
A researcher records the following data for each of three groups.
Group A Group B Group C
11 11 13
11 14 2
4 12 11
6 5 8
13 3 11
What is the value of the F-statistic? (Round your answer to two decimal places.)
F = 0
Explain your answer.
Additional Materials
eBook
dfBP = 14
k = 4, n = 13
dfBG = 5, df E = 25
F is the indicated value because the groups means are different. There is substantial variability between
groups.
F is the indicated value because the group means are the same. There is substantial variability between
groups.
F is the indicated value because the group means are the same. There is no variability between groups.
F is the indicated value because the group means are different. There is no variability between groups.
14. PRIVITERASTATS3 13.E.015.3/3 points Previous Answers My Notes
15. PRIVITERASTATS3 13.E.019.2/2 points Previous Answers My Notes
Paraphrase This Document
Need a fresh take? Get an instant paraphrase of this document with our AI Paraphraser
3/3/2020 Topic Six Homework - PSY-380, section LS02/03/20, Spring 2020 | WebAssign
https://www.webassign.net/web/Student/Assignment-Responses/submit?dep=23286310&tags=autosave#question3961615_26 11/25
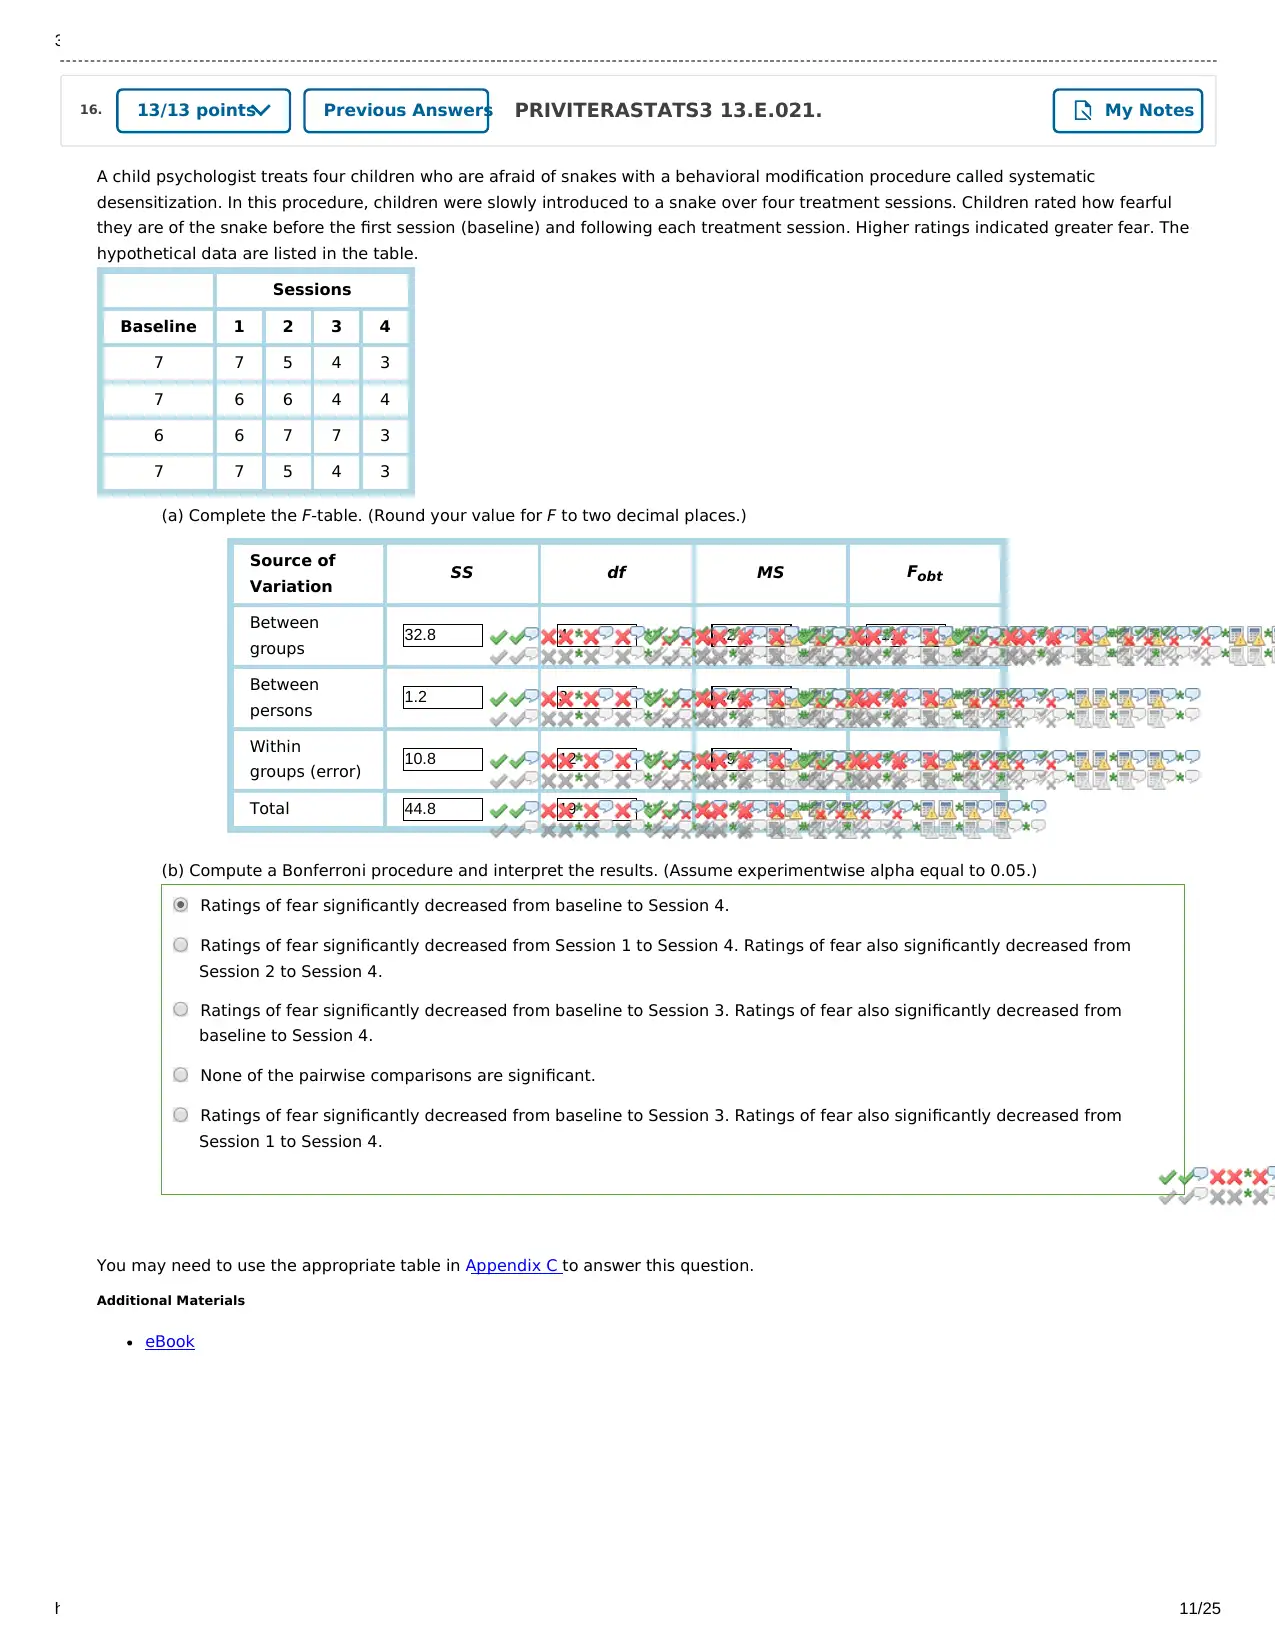
A child psychologist treats four children who are afraid of snakes with a behavioral modification procedure called systematic
desensitization. In this procedure, children were slowly introduced to a snake over four treatment sessions. Children rated how fearful
they are of the snake before the first session (baseline) and following each treatment session. Higher ratings indicated greater fear. The
hypothetical data are listed in the table.
Sessions
Baseline 1 2 3 4
7 7 5 4 3
7 6 6 4 4
6 6 7 7 3
7 7 5 4 3
(a) Complete the F-table. (Round your value for F to two decimal places.)
Source of
Variation SS df MS Fobt
Between
groups 32.8 4 8.2 9.11
Between
persons 1.2 3 0.4
Within
groups (error) 10.8 12 0.9
Total 44.8 19
(b) Compute a Bonferroni procedure and interpret the results. (Assume experimentwise alpha equal to 0.05.)
You may need to use the appropriate table in Appendix C to answer this question.
Additional Materials
eBook
Ratings of fear significantly decreased from baseline to Session 4.
Ratings of fear significantly decreased from Session 1 to Session 4. Ratings of fear also significantly decreased from
Session 2 to Session 4.
Ratings of fear significantly decreased from baseline to Session 3. Ratings of fear also significantly decreased from
baseline to Session 4.
None of the pairwise comparisons are significant.
Ratings of fear significantly decreased from baseline to Session 3. Ratings of fear also significantly decreased from
Session 1 to Session 4.
16. PRIVITERASTATS3 13.E.021.13/13 points Previous Answers My Notes
https://www.webassign.net/web/Student/Assignment-Responses/submit?dep=23286310&tags=autosave#question3961615_26 11/25
A child psychologist treats four children who are afraid of snakes with a behavioral modification procedure called systematic
desensitization. In this procedure, children were slowly introduced to a snake over four treatment sessions. Children rated how fearful
they are of the snake before the first session (baseline) and following each treatment session. Higher ratings indicated greater fear. The
hypothetical data are listed in the table.
Sessions
Baseline 1 2 3 4
7 7 5 4 3
7 6 6 4 4
6 6 7 7 3
7 7 5 4 3
(a) Complete the F-table. (Round your value for F to two decimal places.)
Source of
Variation SS df MS Fobt
Between
groups 32.8 4 8.2 9.11
Between
persons 1.2 3 0.4
Within
groups (error) 10.8 12 0.9
Total 44.8 19
(b) Compute a Bonferroni procedure and interpret the results. (Assume experimentwise alpha equal to 0.05.)
You may need to use the appropriate table in Appendix C to answer this question.
Additional Materials
eBook
Ratings of fear significantly decreased from baseline to Session 4.
Ratings of fear significantly decreased from Session 1 to Session 4. Ratings of fear also significantly decreased from
Session 2 to Session 4.
Ratings of fear significantly decreased from baseline to Session 3. Ratings of fear also significantly decreased from
baseline to Session 4.
None of the pairwise comparisons are significant.
Ratings of fear significantly decreased from baseline to Session 3. Ratings of fear also significantly decreased from
Session 1 to Session 4.
16. PRIVITERASTATS3 13.E.021.13/13 points Previous Answers My Notes
3/3/2020 Topic Six Homework - PSY-380, section LS02/03/20, Spring 2020 | WebAssign
https://www.webassign.net/web/Student/Assignment-Responses/submit?dep=23286310&tags=autosave#question3961615_26 12/25
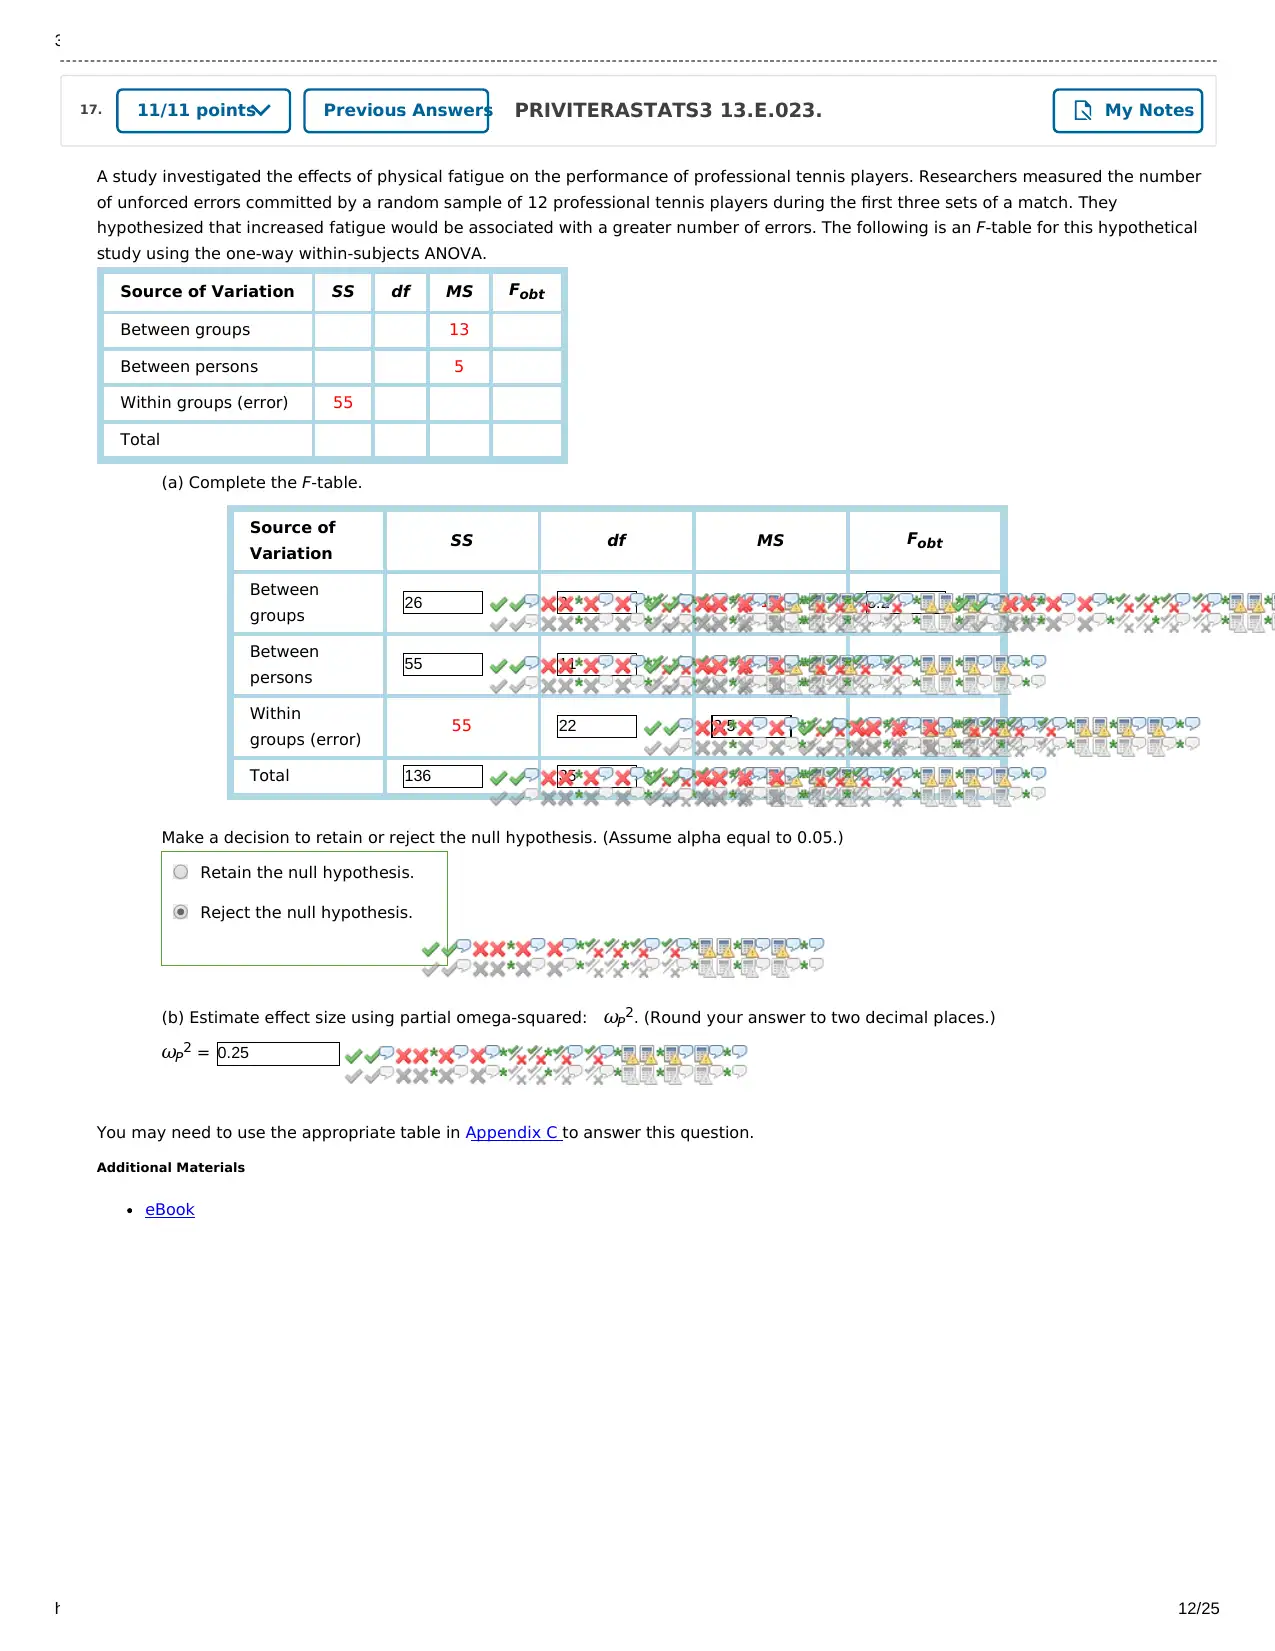
A study investigated the effects of physical fatigue on the performance of professional tennis players. Researchers measured the number
of unforced errors committed by a random sample of 12 professional tennis players during the first three sets of a match. They
hypothesized that increased fatigue would be associated with a greater number of errors. The following is an F-table for this hypothetical
study using the one-way within-subjects ANOVA.
Source of Variation SS df MS Fobt
Between groups 13
Between persons 5
Within groups (error) 55
Total
(a) Complete the F-table.
Source of
Variation SS df MS Fobt
Between
groups 26 2 13 5.2
Between
persons 55 11 5
Within
groups (error) 55 22 2.5
Total 136 35
Make a decision to retain or reject the null hypothesis. (Assume alpha equal to 0.05.)
(b) Estimate effect size using partial omega-squared: ωP2. (Round your answer to two decimal places.)
ωP2 = 0.25
You may need to use the appropriate table in Appendix C to answer this question.
Additional Materials
eBook
Retain the null hypothesis.
Reject the null hypothesis.
17. PRIVITERASTATS3 13.E.023.11/11 points Previous Answers My Notes
https://www.webassign.net/web/Student/Assignment-Responses/submit?dep=23286310&tags=autosave#question3961615_26 12/25
A study investigated the effects of physical fatigue on the performance of professional tennis players. Researchers measured the number
of unforced errors committed by a random sample of 12 professional tennis players during the first three sets of a match. They
hypothesized that increased fatigue would be associated with a greater number of errors. The following is an F-table for this hypothetical
study using the one-way within-subjects ANOVA.
Source of Variation SS df MS Fobt
Between groups 13
Between persons 5
Within groups (error) 55
Total
(a) Complete the F-table.
Source of
Variation SS df MS Fobt
Between
groups 26 2 13 5.2
Between
persons 55 11 5
Within
groups (error) 55 22 2.5
Total 136 35
Make a decision to retain or reject the null hypothesis. (Assume alpha equal to 0.05.)
(b) Estimate effect size using partial omega-squared: ωP2. (Round your answer to two decimal places.)
ωP2 = 0.25
You may need to use the appropriate table in Appendix C to answer this question.
Additional Materials
eBook
Retain the null hypothesis.
Reject the null hypothesis.
17. PRIVITERASTATS3 13.E.023.11/11 points Previous Answers My Notes
⊘ This is a preview!⊘
Do you want full access?
Subscribe today to unlock all pages.
Trusted by 1+ million students worldwide
1 out of 25


Your All-in-One AI-Powered Toolkit for Academic Success.
+13062052269
info@desklib.com
Available 24*7 on WhatsApp / Email
![[object Object]](/_next/static/media/star-bottom.7253800d.svg)
Unlock your academic potential
Copyright © 2020–2026 A2Z Services. All Rights Reserved. Developed and managed by ZUCOL.