Psychology Lab Report: Analysis of Attitude Change Research
VerifiedAdded on 2019/10/16
|7
|2619
|196
Report
AI Summary
This psychology lab report outlines the structure and requirements for a lab report on an attitude change study, detailing the necessary components including an abstract, introduction, method (design, participants, materials, procedure), results, and discussion. The introduction should progress from general to specific, justifying the research, and clearly stating hypotheses. The method section is divided into subsections, specifying the design, variables, participants, materials (including operationalization of IVs), and procedure. The results section requires reporting assumptions, descriptive statistics, and inferential statistics (t-tests, ANOVAs), adhering to APA guidelines for formatting tables and figures. The report emphasizes the importance of clarity, conciseness, and adherence to specific formatting guidelines, including the correct use of statistical notations and the inclusion of effect sizes. Students are advised to include all necessary details, references, and appendices to ensure a comprehensive and well-structured report.
Title
Make sure you give a title for the lab report. The title should be between 10 and 15
words
Include IVs and DV
Centered horizontally on upper half of page
Abstract
The Abstract should not contain any information that is not included in the actual
paper.
Moreover, information in the Abstract should be consistent with information that is
included in the body of the report.
Abstracts should be concise, specific, and self-explanatory
Between 120 and 250 words
Introduction
Do not start the introduction with a description of your study. Go from general to
specific.
The introduction should be approximately 500-600 words
Only include research and theories that are relevant to your own study.
There is no need to justify the importance of research on attitude change. Instead, justify the
importance of studying attitude change of your topic (e.g., healthy eating). Or justify the
research by identifying a gap in the literature
Include a greater depth of discussion of relevant theories and research (the IV’s, ELM) –
be evaluative rather than descriptive
Ensure that your hypotheses are clear. Your hypothesis could be in describing a main
effect (of the IVs – communicator expertise / message sidedness) OR predicting an
interaction between these variables – for example, that the expert message will have
more influence when presented in a two sided message.
When referring to your study, refer to it as the ‘present study’.
Please use paragraphs to write the introduction
Do not state the null hypothesis in the introduction. You can assume that the reader
knows what a null hypothesis is and is aware that you have one.
Sometimes information was presented in the Introduction but was not referenced
Do not use secondary references
Don’t include the title of books in the introduction
Paraphrase This Document
Need a fresh take? Get an instant paraphrase of this document with our AI Paraphraser
Method
Overall errors made in this section were:
Use the term ‘Method’ not ‘Methodology’
Place the content in the right place
o e.g., some students placed the type of the analysis in the Design- this goes in
the Results section;
o do not provide examples of items in the procedure section- this goes in the
Materials section;
o some students discussed the assumptions of the ANOVA in the Method
section- this goes in the Results section
Divide Method into its sub-sections:
Method
Design
Participants
Materials
Procedure
Design:
In this sub-section you need to state:
The type of design you used (between subjects)
The independent variables including the conditions you selected to represent different
levels of the IV: e.g., expertise (non-expert, expert) and message (one-sided, two-
sided). Do not call the IV’s, IV1 and IV2 in the lab report or in your SPSS files.
o All the meaningful names that other students have given them are fine, so for
example some have called the first IV professional/communicator type etc and
IV2 bias/message argument/message type etc.
The dependent variable including details of the units of measurement used. e.g.,
attitude towards healthy-eating, which was measured using a seven-point semantic
differential scale (SDS) or a seven point Likert scale. Please give a reference for the
scale used.
How many groups were there? (4: one-sided message from an expert, one-sided
message from a non-expert, two-sided message from an expert, two-sided message
from a non-expert)
Errors that people made in this subsection:
There were not 4 IVs
Do not mention ANOVA at all – this goes in the Results section
You do not need Tables for participants’ allocation to conditions
Ensure IVs are understood and labelled correctly (e.g. argument type, communicator
expertise).
Provide details of the response format for the dependent variable
Use more meaningful terms when describing groups and conditions. For example some
students have called them condition 1, condition 2 etc. This is vague.
Ensure to mention that participants were randomly assigned to groups (some
specified participants were allocated to condition according to the time that they
participated in the study)
A lot of people have spelt Likert incorrectly – proof read your work
This final point is not necessarily an error, it has more to do with style, but
you need to use this type of style : Half the participants were read the words
aloud, and half were presented with the words singly on a computer screen. Half
the participants in each modality group, were tested in the morning, and half
were tested in the evening. This was followed by a three minute distractor task,
after which all participants were given five minutes to freely recall as many of the
words as they could.’
If you can do not directly stated the IV and DV. Again this is not an error, but in order to get
top marks, you need to emulate published work.
Participants
Do not use too many words on the Participants sub-section
Only include demographic information such as age and gender if it was important to
your study or if you are going to mention it in the Discussion (one group that I have
spoken to were thinking of discussing age as a factor as to why their results were all
non-sig- however this is because their topic might have been specific to age factors).
Furthermore, do not say demographics were not collected, e.g., someone put’ The
participants’ demographics were not necessary and so were not collected.’
Briefly describe how participants were sampled (Note. Random sampling is different
from convenience sampling!). None of you used random sampling as you all used
students. Provide a reference for your sampling method.
⊘ This is a preview!⊘
Do you want full access?
Subscribe today to unlock all pages.
Trusted by 1+ million students worldwide
State where the participants were sampled from but don’t be specific about the
Universities name. Alternatively describe it as a university in the West Midlands.
Do not include anything about conditions here. A lot of people in this section said
‘there were 10 people in each condition’. This goes in the Design section.
Materials
Report an example of the items and scale (briefly and concisely – just one example of
part of it, not the whole message like some people have done). Follow the style used
in journal articles
Materials section needs to make reference to the vignette (this is your main material
and a lot of people overlooked this) – how was this constructed? I know a lot of you
based this on literature so you need to say so.
In the Design Section, some people have given a reference for the Scale used- this is
good. In the Materials section, you can go one step further and justify the number of
points in the scale if you used a Likert scale – why 7 points rather than 4 (odd
numbers give participants the option of being in the middle, whereas an even number
of points forces the participant to take sides – is this a good thing? Do a literature
search and provide one reference). If you used a semantic differential scale, why did
you use choose polar opposites such as ‘good-bad’, ‘useful-useless’. Provide a
reference for this. You could also use a reference for using a semantic differential
scale.
In the materials section, describe how both IVs were operationalised (e.g. the
variations in the message that was given to the participants according to expertise
and message sidedness). To do this provide a sentence on the nature of the one
sided (positive) and two sided message (draw backs)
What did the scale measure?
How many questions did you give to the participant?
Use the subheading ‘Materials’ not ‘Apparatus’ for this study
Procedure
Ensure that the order of events is clearly described in the Procedure section
You can say that ethical approval was granted by the Universities Psychology
Department ethics committee prior to the study.
Paraphrase This Document
Need a fresh take? Get an instant paraphrase of this document with our AI Paraphraser
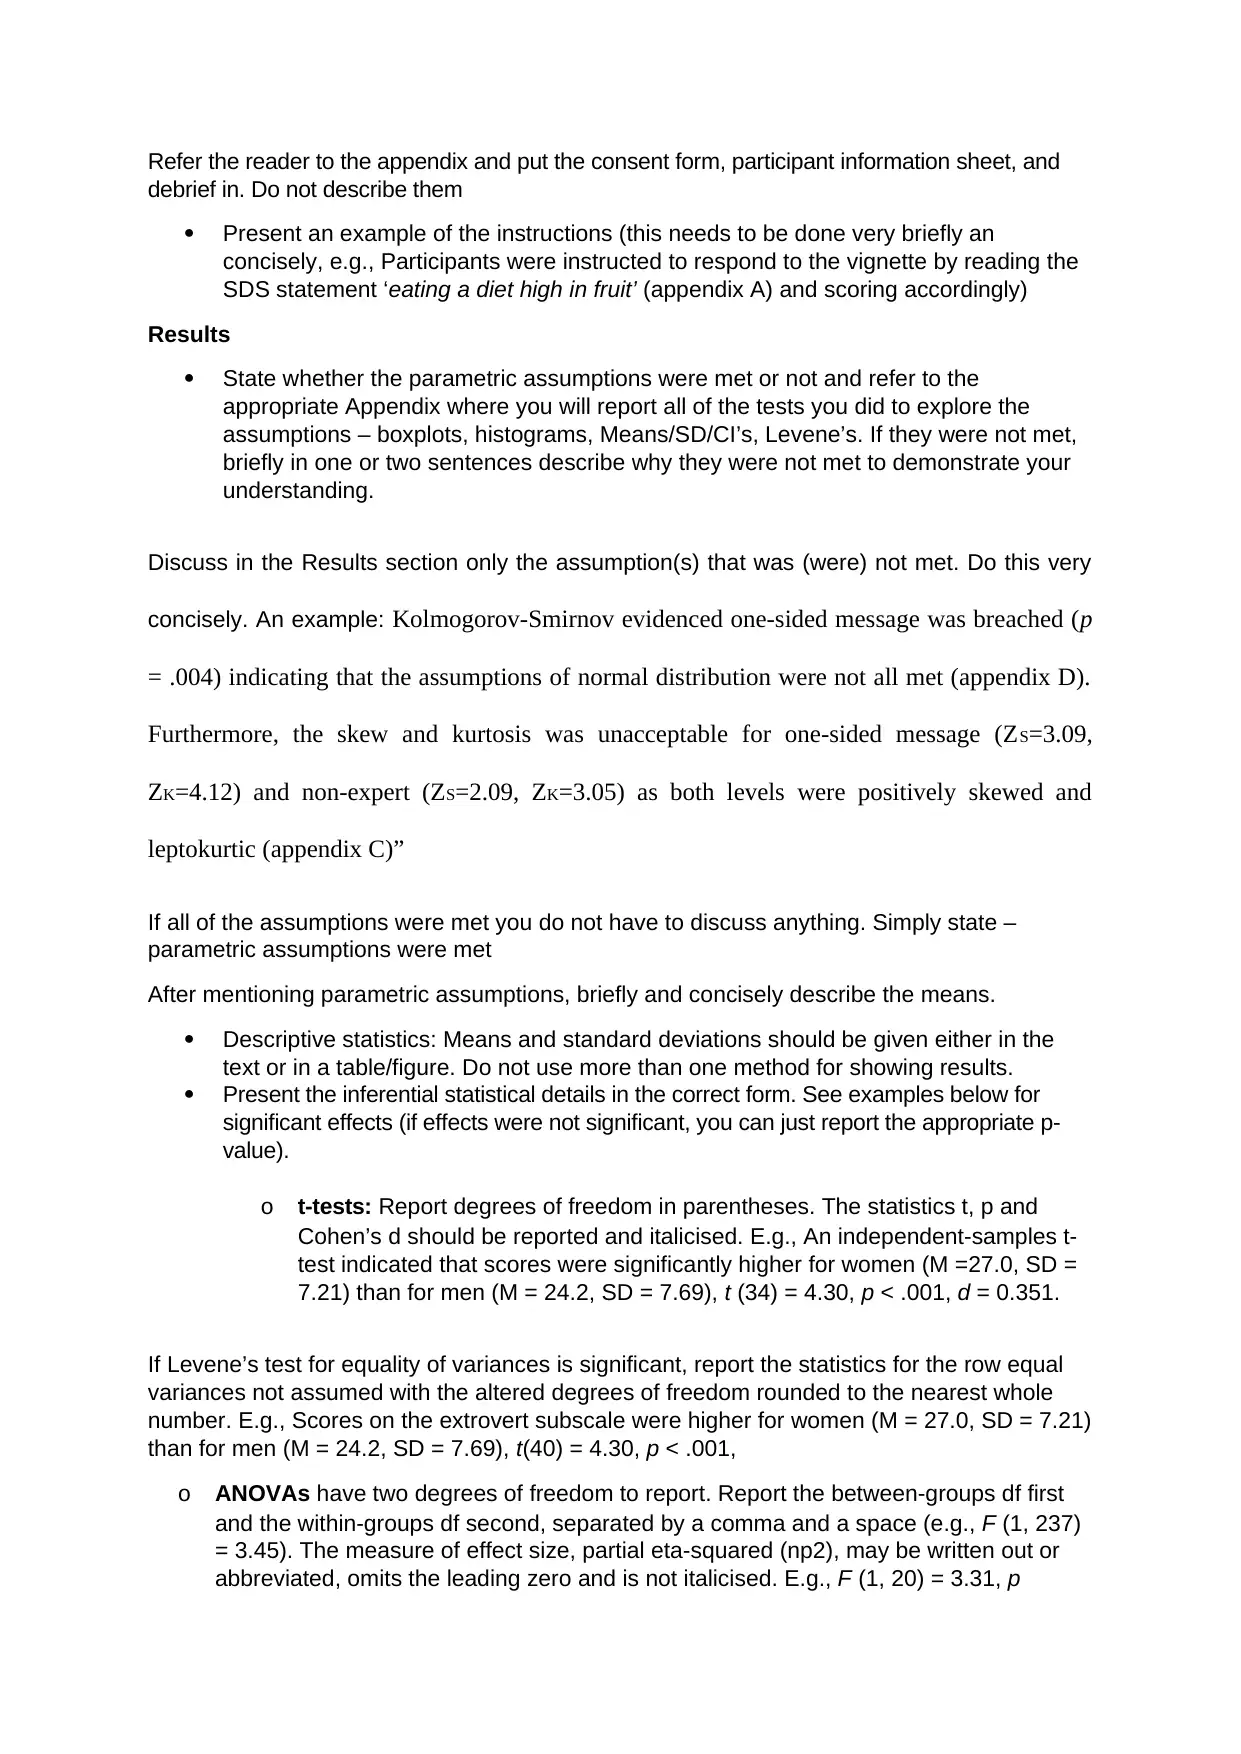
Refer the reader to the appendix and put the consent form, participant information sheet, and
debrief in. Do not describe them
Present an example of the instructions (this needs to be done very briefly an
concisely, e.g., Participants were instructed to respond to the vignette by reading the
SDS statement ‘eating a diet high in fruit’ (appendix A) and scoring accordingly)
Results
State whether the parametric assumptions were met or not and refer to the
appropriate Appendix where you will report all of the tests you did to explore the
assumptions – boxplots, histograms, Means/SD/CI’s, Levene’s. If they were not met,
briefly in one or two sentences describe why they were not met to demonstrate your
understanding.
Discuss in the Results section only the assumption(s) that was (were) not met. Do this very
concisely. An example: Kolmogorov-Smirnov evidenced one-sided message was breached (p
= .004) indicating that the assumptions of normal distribution were not all met (appendix D).
Furthermore, the skew and kurtosis was unacceptable for one-sided message (ZS=3.09,
ZK=4.12) and non-expert (ZS=2.09, ZK=3.05) as both levels were positively skewed and
leptokurtic (appendix C)”
If all of the assumptions were met you do not have to discuss anything. Simply state –
parametric assumptions were met
After mentioning parametric assumptions, briefly and concisely describe the means.
Descriptive statistics: Means and standard deviations should be given either in the
text or in a table/figure. Do not use more than one method for showing results.
Present the inferential statistical details in the correct form. See examples below for
significant effects (if effects were not significant, you can just report the appropriate p-
value).
o t-tests: Report degrees of freedom in parentheses. The statistics t, p and
Cohen’s d should be reported and italicised. E.g., An independent-samples t-
test indicated that scores were significantly higher for women (M =27.0, SD =
7.21) than for men (M = 24.2, SD = 7.69), t (34) = 4.30, p < .001, d = 0.351.
If Levene’s test for equality of variances is significant, report the statistics for the row equal
variances not assumed with the altered degrees of freedom rounded to the nearest whole
number. E.g., Scores on the extrovert subscale were higher for women (M = 27.0, SD = 7.21)
than for men (M = 24.2, SD = 7.69), t(40) = 4.30, p < .001,
o ANOVAs have two degrees of freedom to report. Report the between-groups df first
and the within-groups df second, separated by a comma and a space (e.g., F (1, 237)
= 3.45). The measure of effect size, partial eta-squared (np2), may be written out or
abbreviated, omits the leading zero and is not italicised. E.g., F (1, 20) = 3.31, p
= .084, np2 = .142. (remember to describe the variance e.g., 14% of the variance in
attitudes towards healthy eating can be accounted for by communicator expertise” see
lecture slides for further clarification on where to report this)
o Report p-values accurately, for example p = .014 is not the same as p = .14
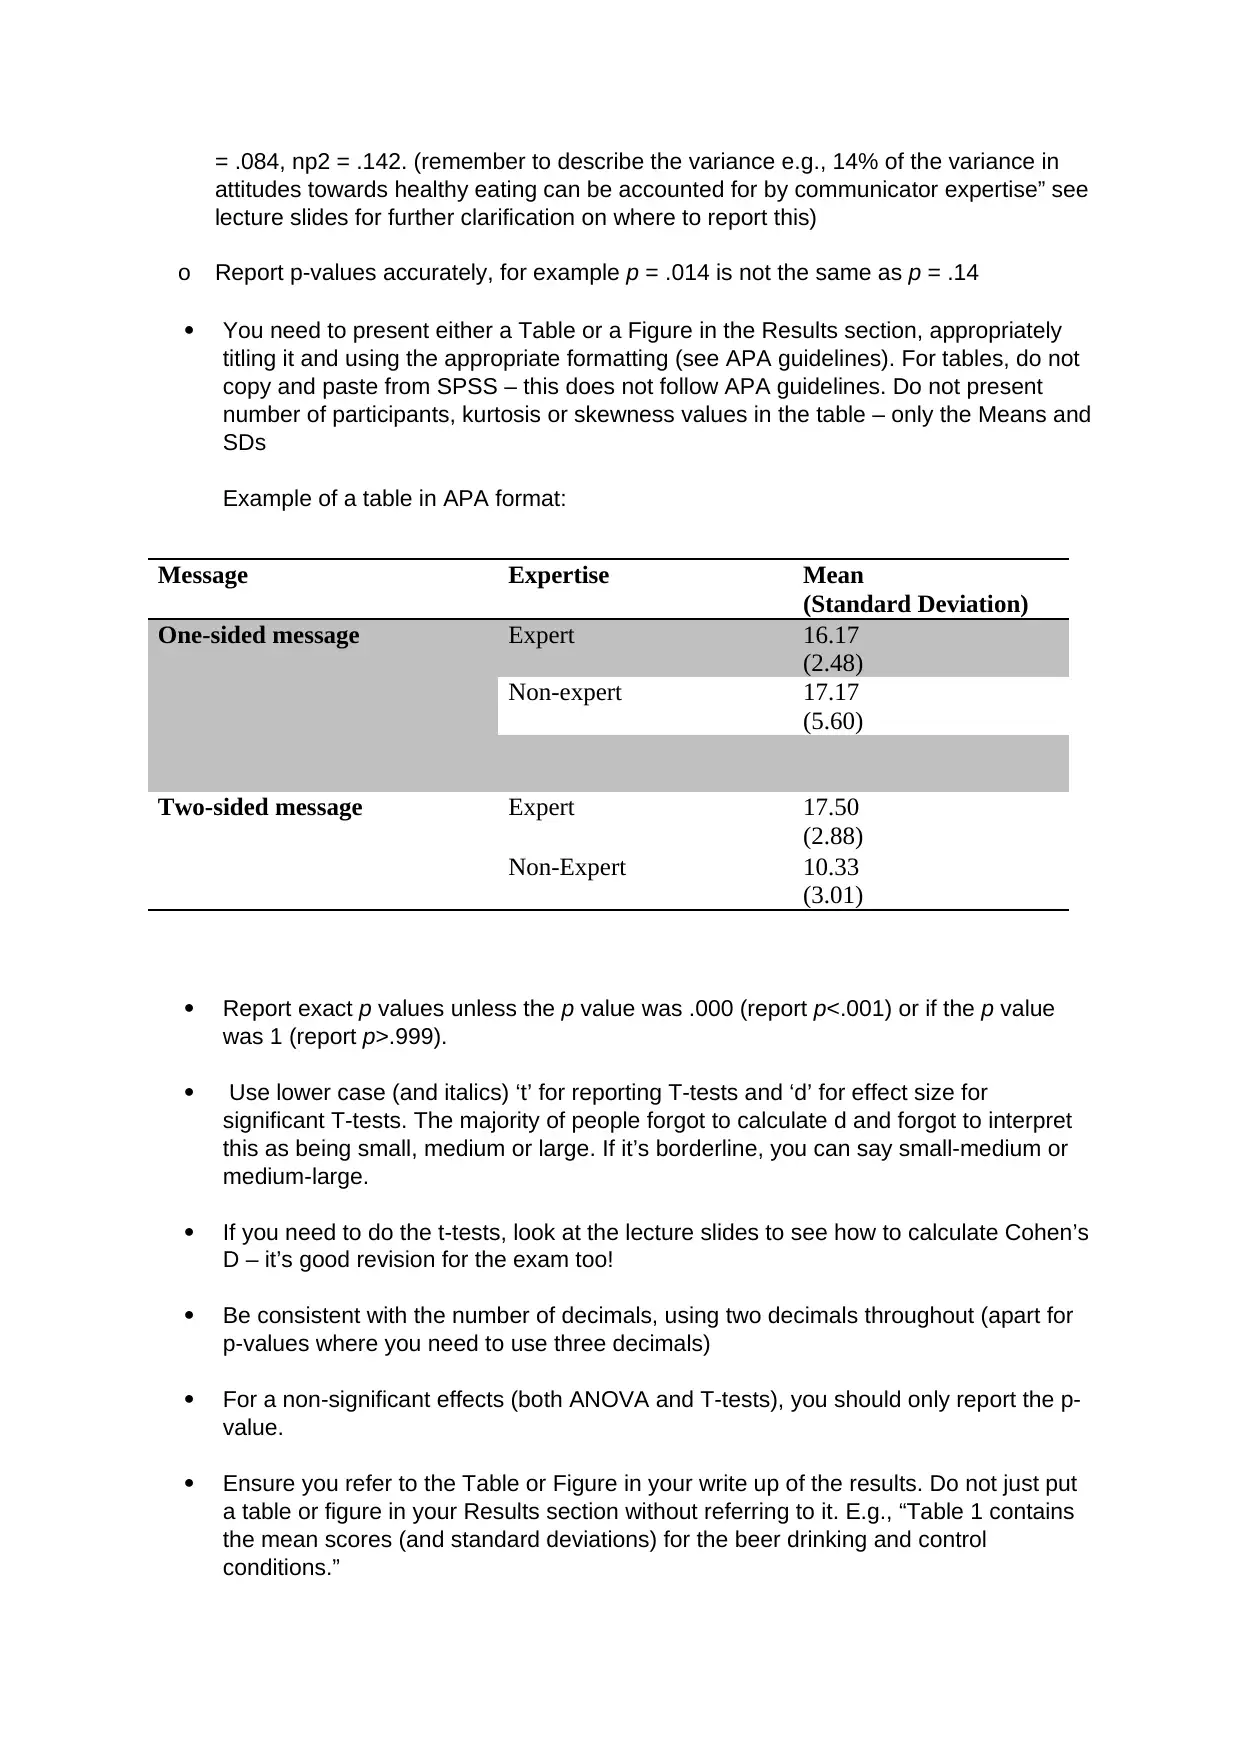
You need to present either a Table or a Figure in the Results section, appropriately
titling it and using the appropriate formatting (see APA guidelines). For tables, do not
copy and paste from SPSS – this does not follow APA guidelines. Do not present
number of participants, kurtosis or skewness values in the table – only the Means and
SDs
Example of a table in APA format:
Message Expertise Mean
(Standard Deviation)
One-sided message Expert 16.17
(2.48)
Non-expert 17.17
(5.60)
Two-sided message Expert 17.50
(2.88)
Non-Expert 10.33
(3.01)
Report exact p values unless the p value was .000 (report p<.001) or if the p value
was 1 (report p>.999).
Use lower case (and italics) ‘t’ for reporting T-tests and ‘d’ for effect size for
significant T-tests. The majority of people forgot to calculate d and forgot to interpret
this as being small, medium or large. If it’s borderline, you can say small-medium or
medium-large.
If you need to do the t-tests, look at the lecture slides to see how to calculate Cohen’s
D – it’s good revision for the exam too!
Be consistent with the number of decimals, using two decimals throughout (apart for
p-values where you need to use three decimals)
For a non-significant effects (both ANOVA and T-tests), you should only report the p-
value.
Ensure you refer to the Table or Figure in your write up of the results. Do not just put
a table or figure in your Results section without referring to it. E.g., “Table 1 contains
the mean scores (and standard deviations) for the beer drinking and control
conditions.”
attitudes towards healthy eating can be accounted for by communicator expertise” see
lecture slides for further clarification on where to report this)
o Report p-values accurately, for example p = .014 is not the same as p = .14
You need to present either a Table or a Figure in the Results section, appropriately
titling it and using the appropriate formatting (see APA guidelines). For tables, do not
copy and paste from SPSS – this does not follow APA guidelines. Do not present
number of participants, kurtosis or skewness values in the table – only the Means and
SDs
Example of a table in APA format:
Message Expertise Mean
(Standard Deviation)
One-sided message Expert 16.17
(2.48)
Non-expert 17.17
(5.60)
Two-sided message Expert 17.50
(2.88)
Non-Expert 10.33
(3.01)
Report exact p values unless the p value was .000 (report p<.001) or if the p value
was 1 (report p>.999).
Use lower case (and italics) ‘t’ for reporting T-tests and ‘d’ for effect size for
significant T-tests. The majority of people forgot to calculate d and forgot to interpret
this as being small, medium or large. If it’s borderline, you can say small-medium or
medium-large.
If you need to do the t-tests, look at the lecture slides to see how to calculate Cohen’s
D – it’s good revision for the exam too!
Be consistent with the number of decimals, using two decimals throughout (apart for
p-values where you need to use three decimals)
For a non-significant effects (both ANOVA and T-tests), you should only report the p-
value.
Ensure you refer to the Table or Figure in your write up of the results. Do not just put
a table or figure in your Results section without referring to it. E.g., “Table 1 contains
the mean scores (and standard deviations) for the beer drinking and control
conditions.”
⊘ This is a preview!⊘
Do you want full access?
Subscribe today to unlock all pages.
Trusted by 1+ million students worldwide
As well as a sentence to introduce them, all tables must have a title above the table
that includes the units of measurement (use the correct APA-style terminology for
graphs or diagrams). For example: “Table 1. Mean scores (number of puts) for
subjects drinking two pints of beer
Remember that the results of statistical tests which assess differences (e.g., t-tests,
ANOVAs) do not tell the reader anything about the direction of these differences (i.e.,
which condition has the higher mean value), so you will always need to say which
direction your results went. E.g. non-experts influenced attitudes more when
presenting a one-sided message compared to a two-sided message.
If the interaction between communicator expertise and message argument is not
significant, you do not need to carry out the t-tests.
Although you may be tempted to describe results associated with very low
probabilities (e.g., p < .001) as highly significant, this should be avoided (an effect is
either statistically significant or not). However, if you want to point out that a result
almost reached the statistical criterion (e.g., p < .06), you may refer to it as near-
significant (to be used VERY sparingly!).
Do not include SPSS output in the lab report, please put it in the appendix. Please
construct tables and figures using excel.
1 out of 7
Related Documents


Your All-in-One AI-Powered Toolkit for Academic Success.
+13062052269
info@desklib.com
Available 24*7 on WhatsApp / Email
![[object Object]](/_next/static/media/star-bottom.7253800d.svg)
Unlock your academic potential
Copyright © 2020–2026 A2Z Services. All Rights Reserved. Developed and managed by ZUCOL.