University Psychology Report: Mindfulness Training Impact and Results
VerifiedAdded on 2023/01/09
|17
|3008
|58
Report
AI Summary
This report presents the findings and analysis of a mindfulness training program. The study investigated the impact of a 6-week mindfulness course on participants, examining its effects on mental wellbeing, socio-economic status (SES), and personality traits. Statistical methods, including ANOVA and t-tests, were employed to analyze the data. The results indicated that the training did not significantly improve mindfulness awareness compared to the control group. However, the study revealed that individuals with lower SES may benefit more from such training due to higher levels of stress and depression. Furthermore, the analysis found no significant association between the effectiveness of the training and the participants' personality traits. The report includes detailed interpretations of the statistical results, discussing the implications for mental health interventions and the importance of tailoring programs to specific populations. The discussion highlights the importance of proper training delivery and individual differences in response to mindfulness practices.

Mindfulness
1
1
Paraphrase This Document
Need a fresh take? Get an instant paraphrase of this document with our AI Paraphraser
Table of Contents
FINDINGS AND RESULTS 2000..................................................................................................3
DISCUSSION AND ANALYSIS 3000........................................................................................13
CONCLUSION 1000.....................................................................................................................16
REFERENCES..............................................................................................................................17
2
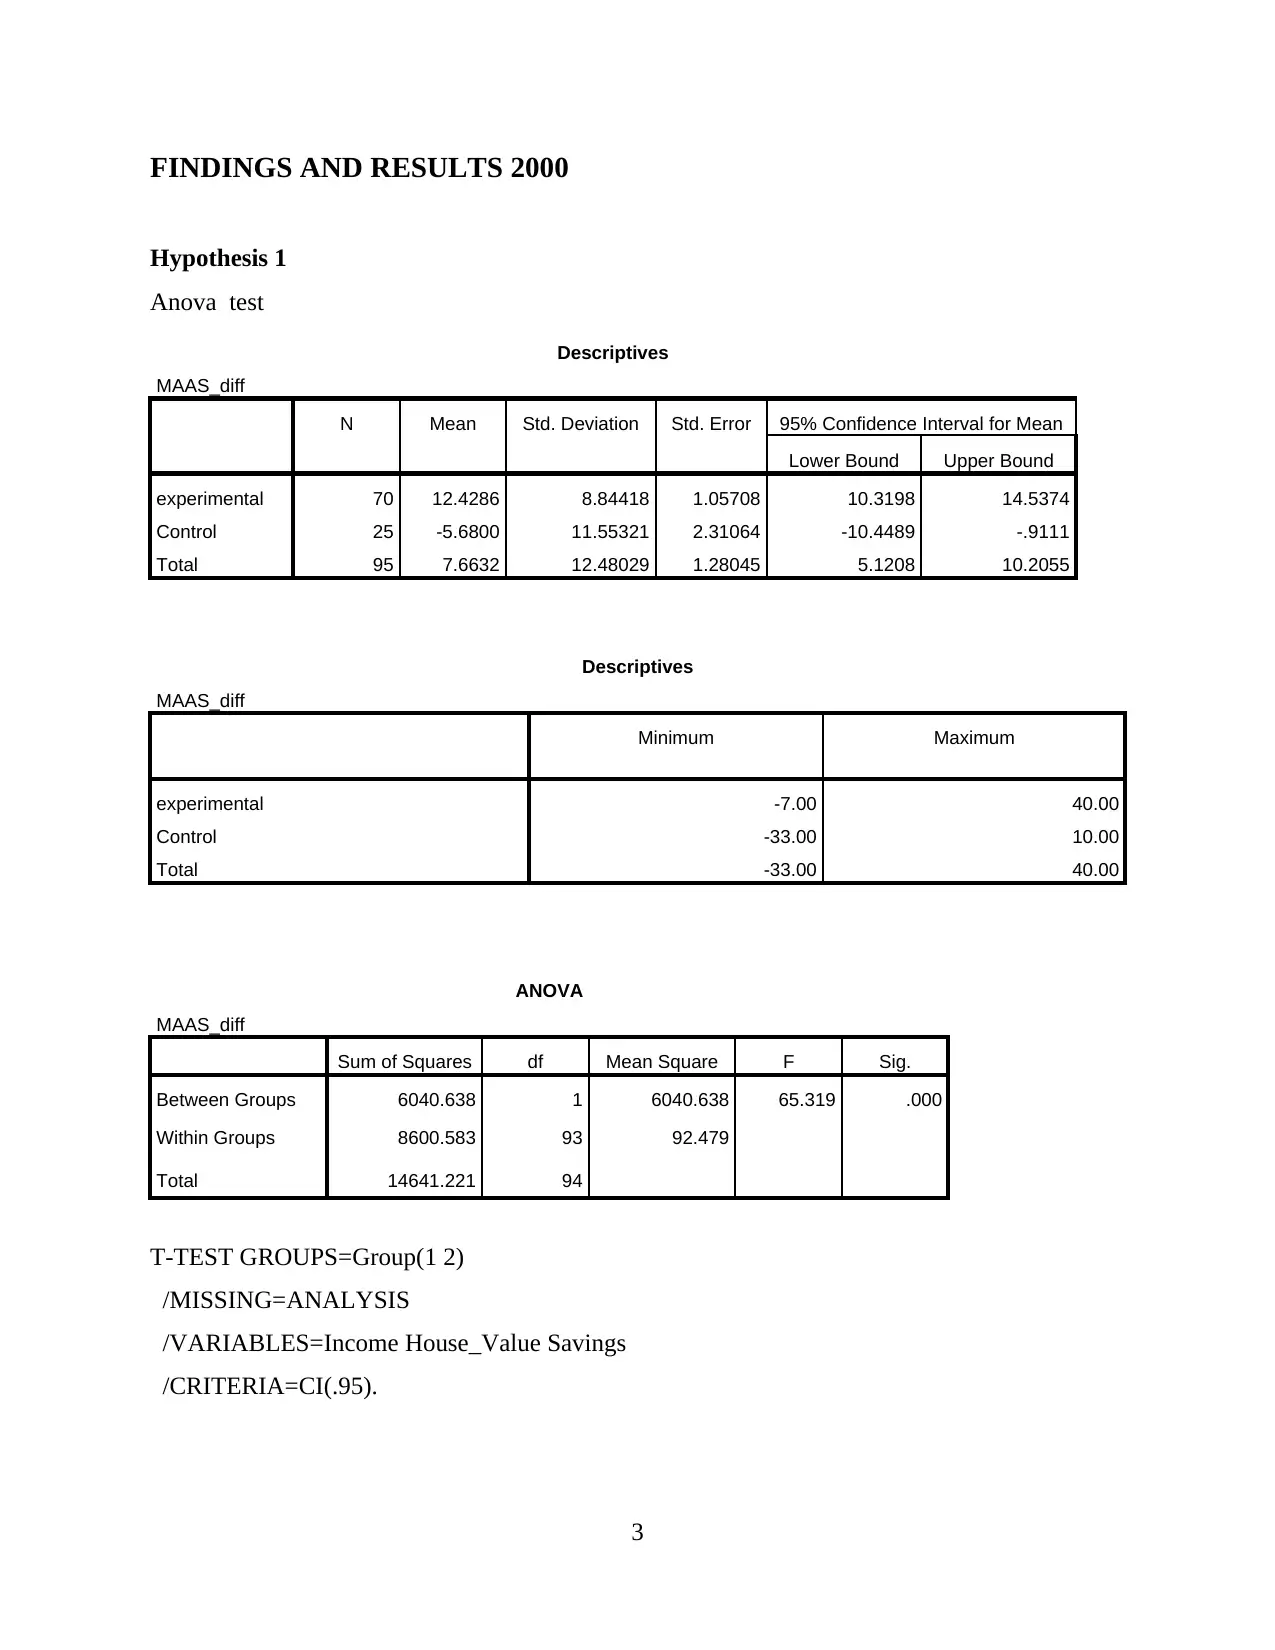
FINDINGS AND RESULTS 2000
Hypothesis 1
Anova test
Descriptives
MAAS_diff
N Mean Std. Deviation Std. Error 95% Confidence Interval for Mean
Lower Bound Upper Bound
experimental 70 12.4286 8.84418 1.05708 10.3198 14.5374
Control 25 -5.6800 11.55321 2.31064 -10.4489 -.9111
Total 95 7.6632 12.48029 1.28045 5.1208 10.2055
Descriptives
MAAS_diff
Minimum Maximum
experimental -7.00 40.00
Control -33.00 10.00
Total -33.00 40.00
ANOVA
MAAS_diff
Sum of Squares df Mean Square F Sig.
Between Groups 6040.638 1 6040.638 65.319 .000
Within Groups 8600.583 93 92.479
Total 14641.221 94
T-TEST GROUPS=Group(1 2)
/MISSING=ANALYSIS
/VARIABLES=Income House_Value Savings
/CRITERIA=CI(.95).
3
⊘ This is a preview!⊘
Do you want full access?
Subscribe today to unlock all pages.
Trusted by 1+ million students worldwide
Interpretation – from above analysis of table it is found that significance value obtained is
P= .000 which is less than P= 0.05. thus, null hypothesis is rejected. It means that there will be
no improvement in mindfulness awareness during 6 week training course compared with
control group. As there are two groups in it that is experimental and control groups. So, it is
evaluated that there is no changes done in course in control groups. Besides that, value
obtained is P= .000 which significant. So, even if training course in increased then also there
will be no improvement in mindfulness of control group people. in this group it included
children, parents, etc who attended training course such as dance class, cycling group, etc. so,
it was found that there is no change in outcomes after 6 weeks training done. The score
obtained by control group was same.
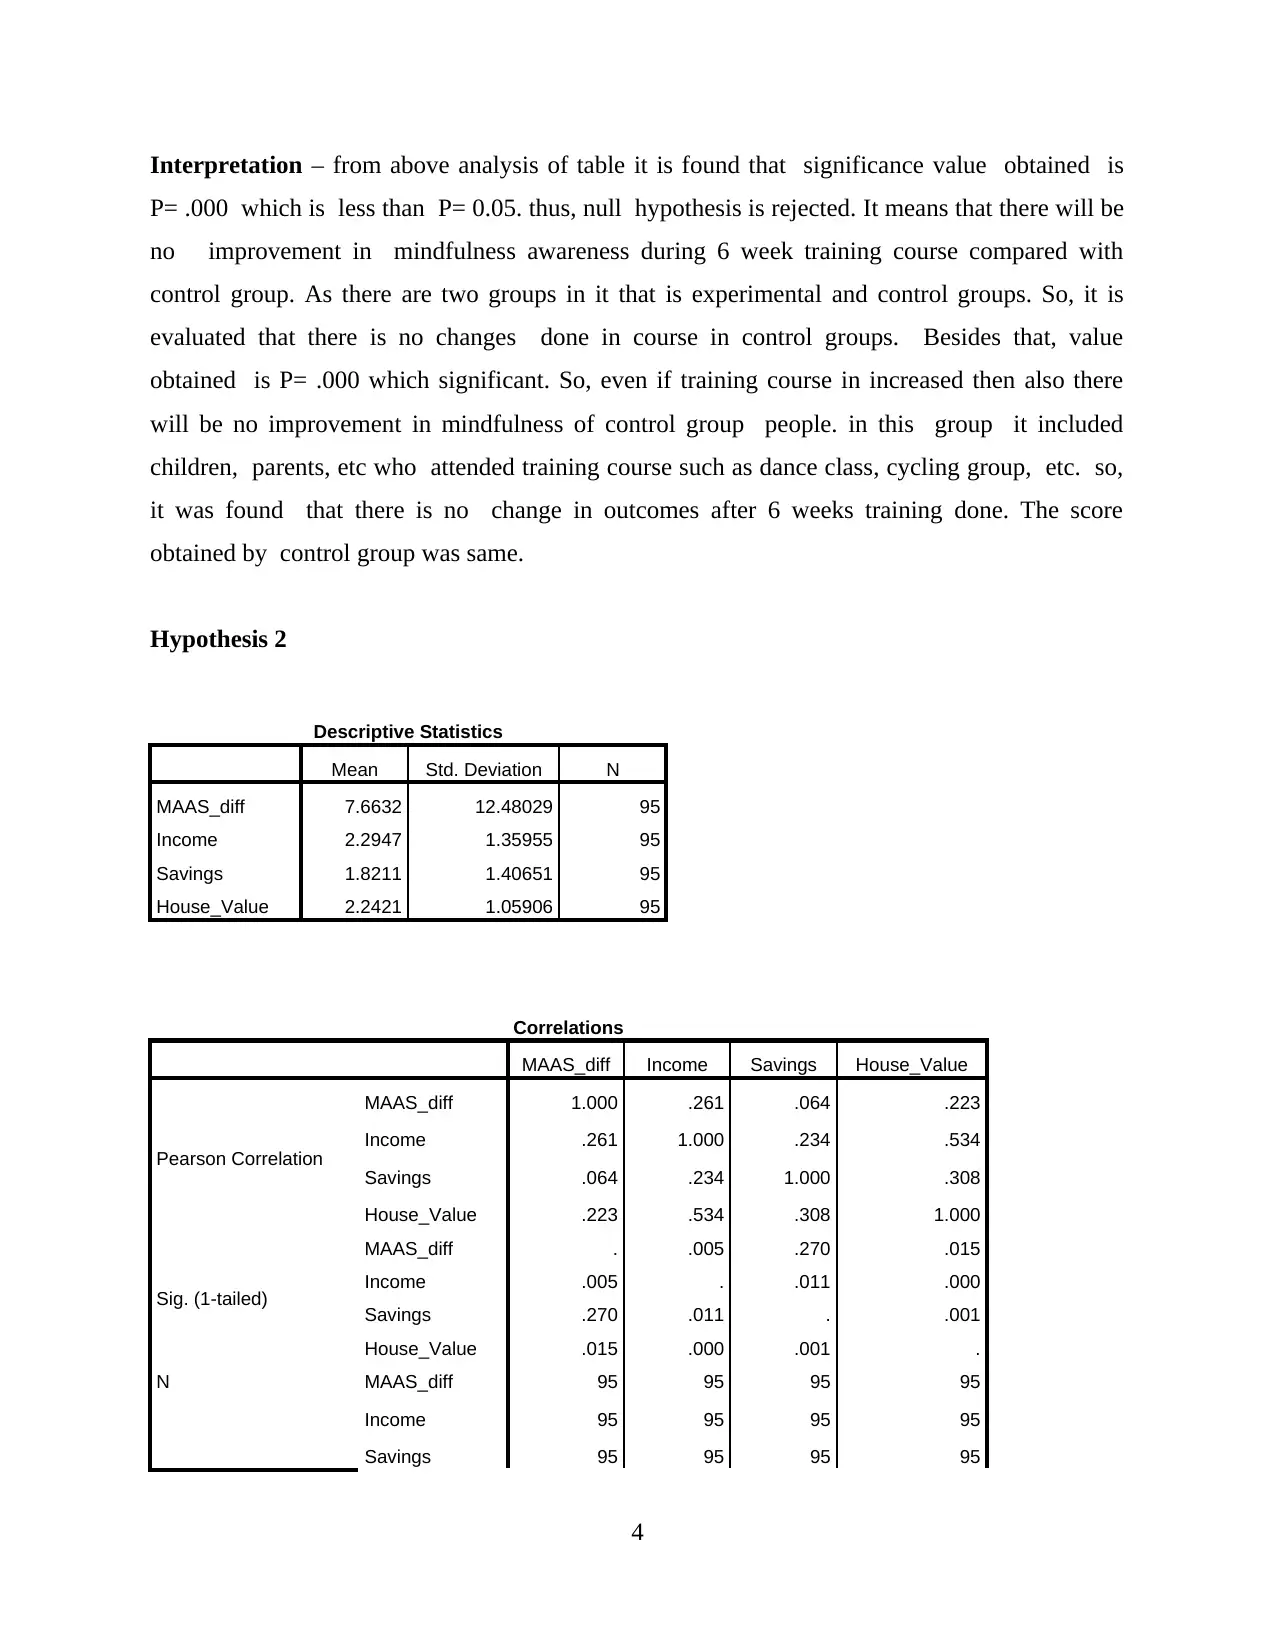
Hypothesis 2
Descriptive Statistics
Mean Std. Deviation N
MAAS_diff 7.6632 12.48029 95
Income 2.2947 1.35955 95
Savings 1.8211 1.40651 95
House_Value 2.2421 1.05906 95
Correlations
MAAS_diff Income Savings House_Value
Pearson Correlation
MAAS_diff 1.000 .261 .064 .223
Income .261 1.000 .234 .534
Savings .064 .234 1.000 .308
House_Value .223 .534 .308 1.000
Sig. (1-tailed)
MAAS_diff . .005 .270 .015
Income .005 . .011 .000
Savings .270 .011 . .001
House_Value .015 .000 .001 .
N MAAS_diff 95 95 95 95
Income 95 95 95 95
Savings 95 95 95 95
4
P= .000 which is less than P= 0.05. thus, null hypothesis is rejected. It means that there will be
no improvement in mindfulness awareness during 6 week training course compared with
control group. As there are two groups in it that is experimental and control groups. So, it is
evaluated that there is no changes done in course in control groups. Besides that, value
obtained is P= .000 which significant. So, even if training course in increased then also there
will be no improvement in mindfulness of control group people. in this group it included
children, parents, etc who attended training course such as dance class, cycling group, etc. so,
it was found that there is no change in outcomes after 6 weeks training done. The score
obtained by control group was same.
Hypothesis 2
Descriptive Statistics
Mean Std. Deviation N
MAAS_diff 7.6632 12.48029 95
Income 2.2947 1.35955 95
Savings 1.8211 1.40651 95
House_Value 2.2421 1.05906 95
Correlations
MAAS_diff Income Savings House_Value
Pearson Correlation
MAAS_diff 1.000 .261 .064 .223
Income .261 1.000 .234 .534
Savings .064 .234 1.000 .308
House_Value .223 .534 .308 1.000
Sig. (1-tailed)
MAAS_diff . .005 .270 .015
Income .005 . .011 .000
Savings .270 .011 . .001
House_Value .015 .000 .001 .
N MAAS_diff 95 95 95 95
Income 95 95 95 95
Savings 95 95 95 95
4
Paraphrase This Document
Need a fresh take? Get an instant paraphrase of this document with our AI Paraphraser
House_Value 95 95 95 95
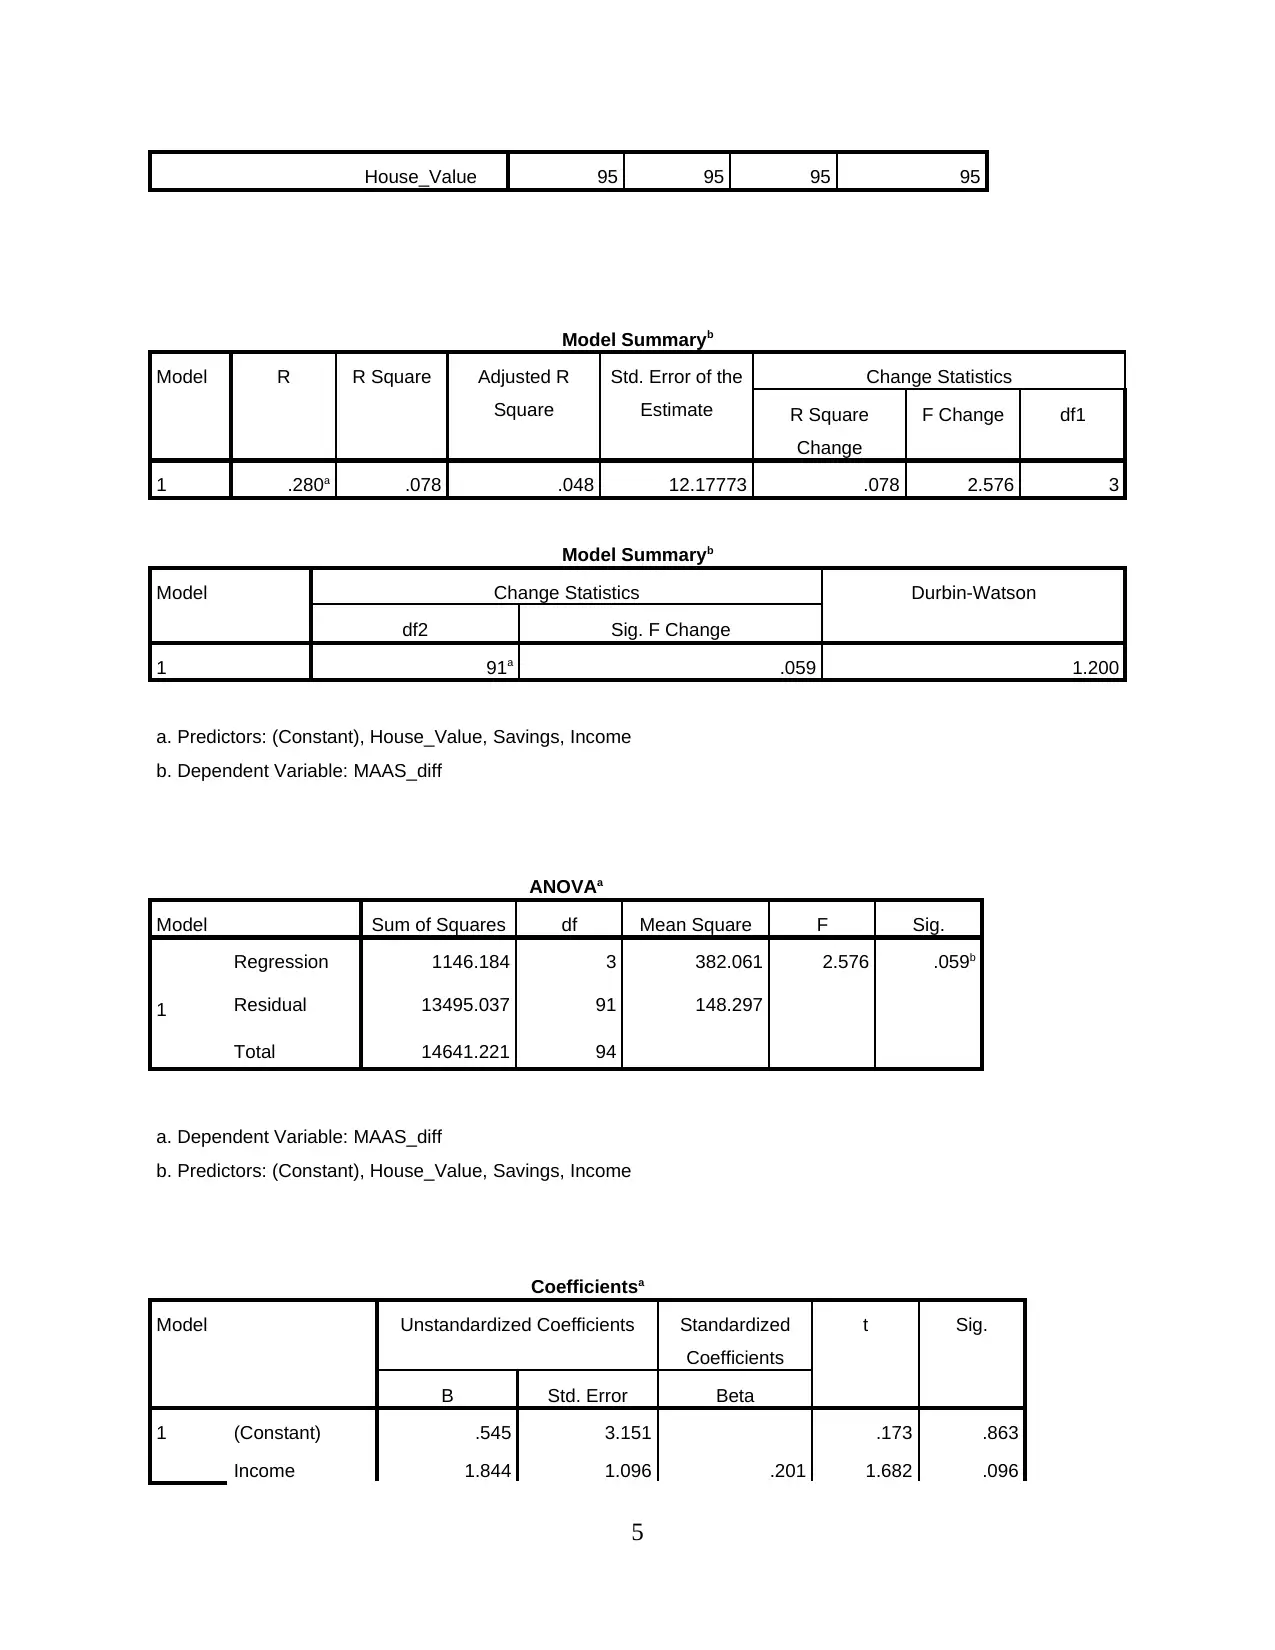
Model Summaryb
Model R R Square Adjusted R
Square
Std. Error of the
Estimate
Change Statistics
R Square
Change
F Change df1
1 .280a .078 .048 12.17773 .078 2.576 3
Model Summaryb
Model Change Statistics Durbin-Watson
df2 Sig. F Change
1 91a .059 1.200
a. Predictors: (Constant), House_Value, Savings, Income
b. Dependent Variable: MAAS_diff
ANOVAa
Model Sum of Squares df Mean Square F Sig.
1
Regression 1146.184 3 382.061 2.576 .059b
Residual 13495.037 91 148.297
Total 14641.221 94
a. Dependent Variable: MAAS_diff
b. Predictors: (Constant), House_Value, Savings, Income
Coefficientsa
Model Unstandardized Coefficients Standardized
Coefficients
t Sig.
B Std. Error Beta
1 (Constant) .545 3.151 .173 .863
Income 1.844 1.096 .201 1.682 .096
5
Model Summaryb
Model R R Square Adjusted R
Square
Std. Error of the
Estimate
Change Statistics
R Square
Change
F Change df1
1 .280a .078 .048 12.17773 .078 2.576 3
Model Summaryb
Model Change Statistics Durbin-Watson
df2 Sig. F Change
1 91a .059 1.200
a. Predictors: (Constant), House_Value, Savings, Income
b. Dependent Variable: MAAS_diff
ANOVAa
Model Sum of Squares df Mean Square F Sig.
1
Regression 1146.184 3 382.061 2.576 .059b
Residual 13495.037 91 148.297
Total 14641.221 94
a. Dependent Variable: MAAS_diff
b. Predictors: (Constant), House_Value, Savings, Income
Coefficientsa
Model Unstandardized Coefficients Standardized
Coefficients
t Sig.
B Std. Error Beta
1 (Constant) .545 3.151 .173 .863
Income 1.844 1.096 .201 1.682 .096
5
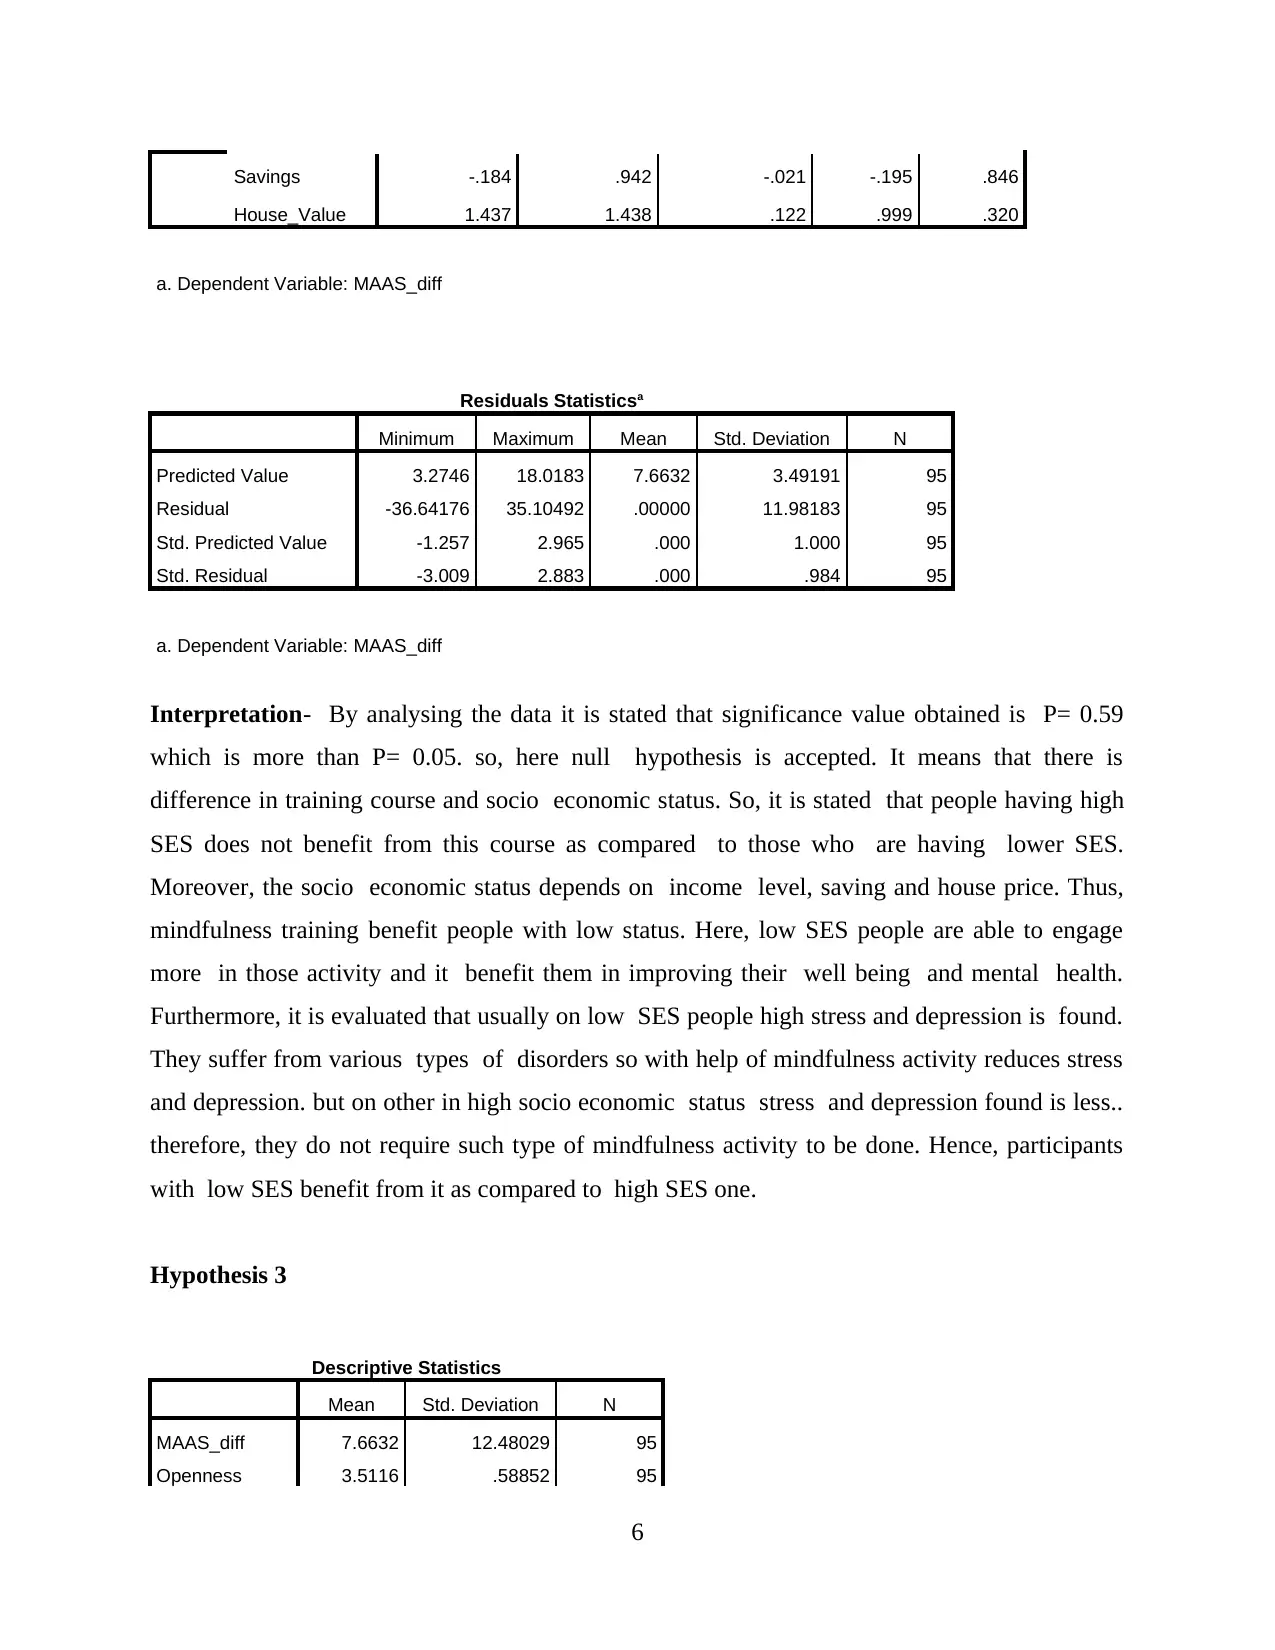
Savings -.184 .942 -.021 -.195 .846
House_Value 1.437 1.438 .122 .999 .320
a. Dependent Variable: MAAS_diff
Residuals Statisticsa
Minimum Maximum Mean Std. Deviation N
Predicted Value 3.2746 18.0183 7.6632 3.49191 95
Residual -36.64176 35.10492 .00000 11.98183 95
Std. Predicted Value -1.257 2.965 .000 1.000 95
Std. Residual -3.009 2.883 .000 .984 95
a. Dependent Variable: MAAS_diff
Interpretation- By analysing the data it is stated that significance value obtained is P= 0.59
which is more than P= 0.05. so, here null hypothesis is accepted. It means that there is
difference in training course and socio economic status. So, it is stated that people having high
SES does not benefit from this course as compared to those who are having lower SES.
Moreover, the socio economic status depends on income level, saving and house price. Thus,
mindfulness training benefit people with low status. Here, low SES people are able to engage
more in those activity and it benefit them in improving their well being and mental health.
Furthermore, it is evaluated that usually on low SES people high stress and depression is found.
They suffer from various types of disorders so with help of mindfulness activity reduces stress
and depression. but on other in high socio economic status stress and depression found is less..
therefore, they do not require such type of mindfulness activity to be done. Hence, participants
with low SES benefit from it as compared to high SES one.
Hypothesis 3
Descriptive Statistics
Mean Std. Deviation N
MAAS_diff 7.6632 12.48029 95
Openness 3.5116 .58852 95
6
⊘ This is a preview!⊘
Do you want full access?
Subscribe today to unlock all pages.
Trusted by 1+ million students worldwide
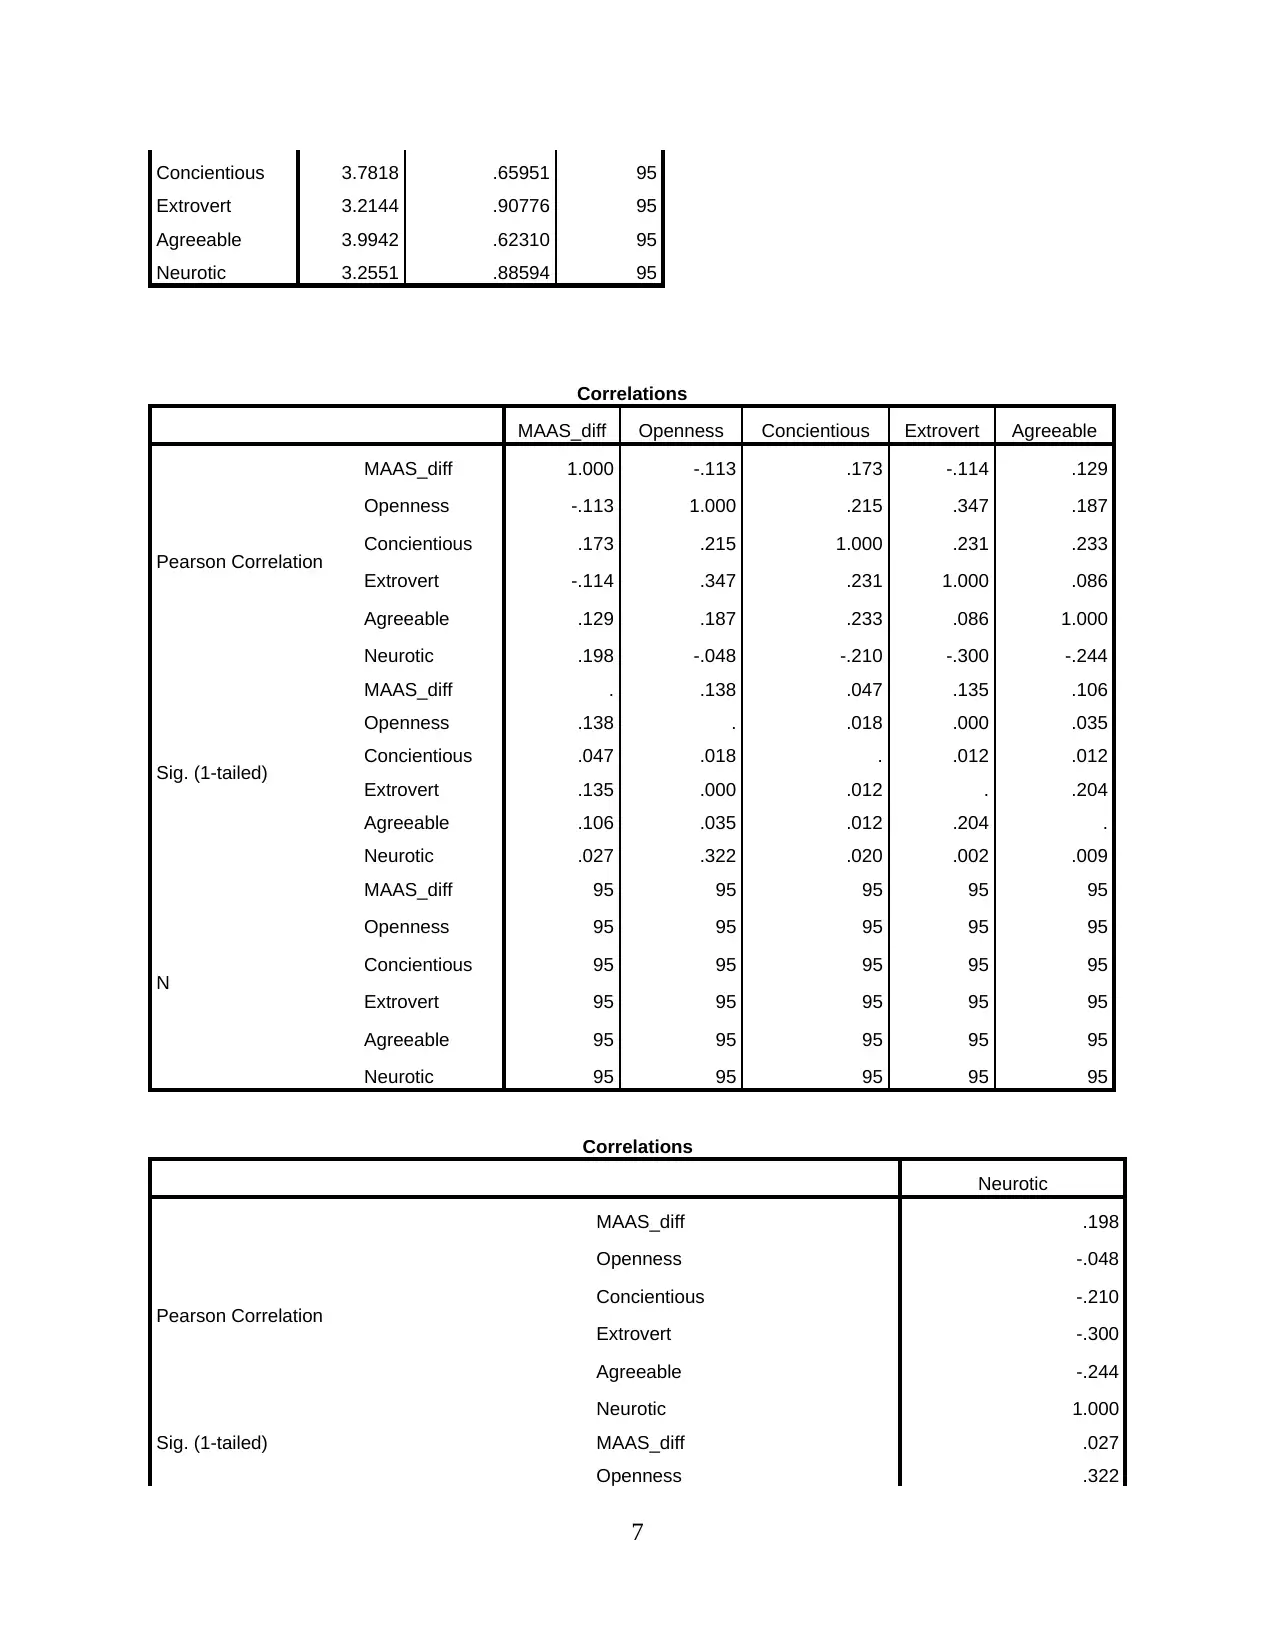
Concientious 3.7818 .65951 95
Extrovert 3.2144 .90776 95
Agreeable 3.9942 .62310 95
Neurotic 3.2551 .88594 95
Correlations
MAAS_diff Openness Concientious Extrovert Agreeable
Pearson Correlation
MAAS_diff 1.000 -.113 .173 -.114 .129
Openness -.113 1.000 .215 .347 .187
Concientious .173 .215 1.000 .231 .233
Extrovert -.114 .347 .231 1.000 .086
Agreeable .129 .187 .233 .086 1.000
Neurotic .198 -.048 -.210 -.300 -.244
Sig. (1-tailed)
MAAS_diff . .138 .047 .135 .106
Openness .138 . .018 .000 .035
Concientious .047 .018 . .012 .012
Extrovert .135 .000 .012 . .204
Agreeable .106 .035 .012 .204 .
Neurotic .027 .322 .020 .002 .009
N
MAAS_diff 95 95 95 95 95
Openness 95 95 95 95 95
Concientious 95 95 95 95 95
Extrovert 95 95 95 95 95
Agreeable 95 95 95 95 95
Neurotic 95 95 95 95 95
Correlations
Neurotic
Pearson Correlation
MAAS_diff .198
Openness -.048
Concientious -.210
Extrovert -.300
Agreeable -.244
Neurotic 1.000
Sig. (1-tailed) MAAS_diff .027
Openness .322
7
Paraphrase This Document
Need a fresh take? Get an instant paraphrase of this document with our AI Paraphraser
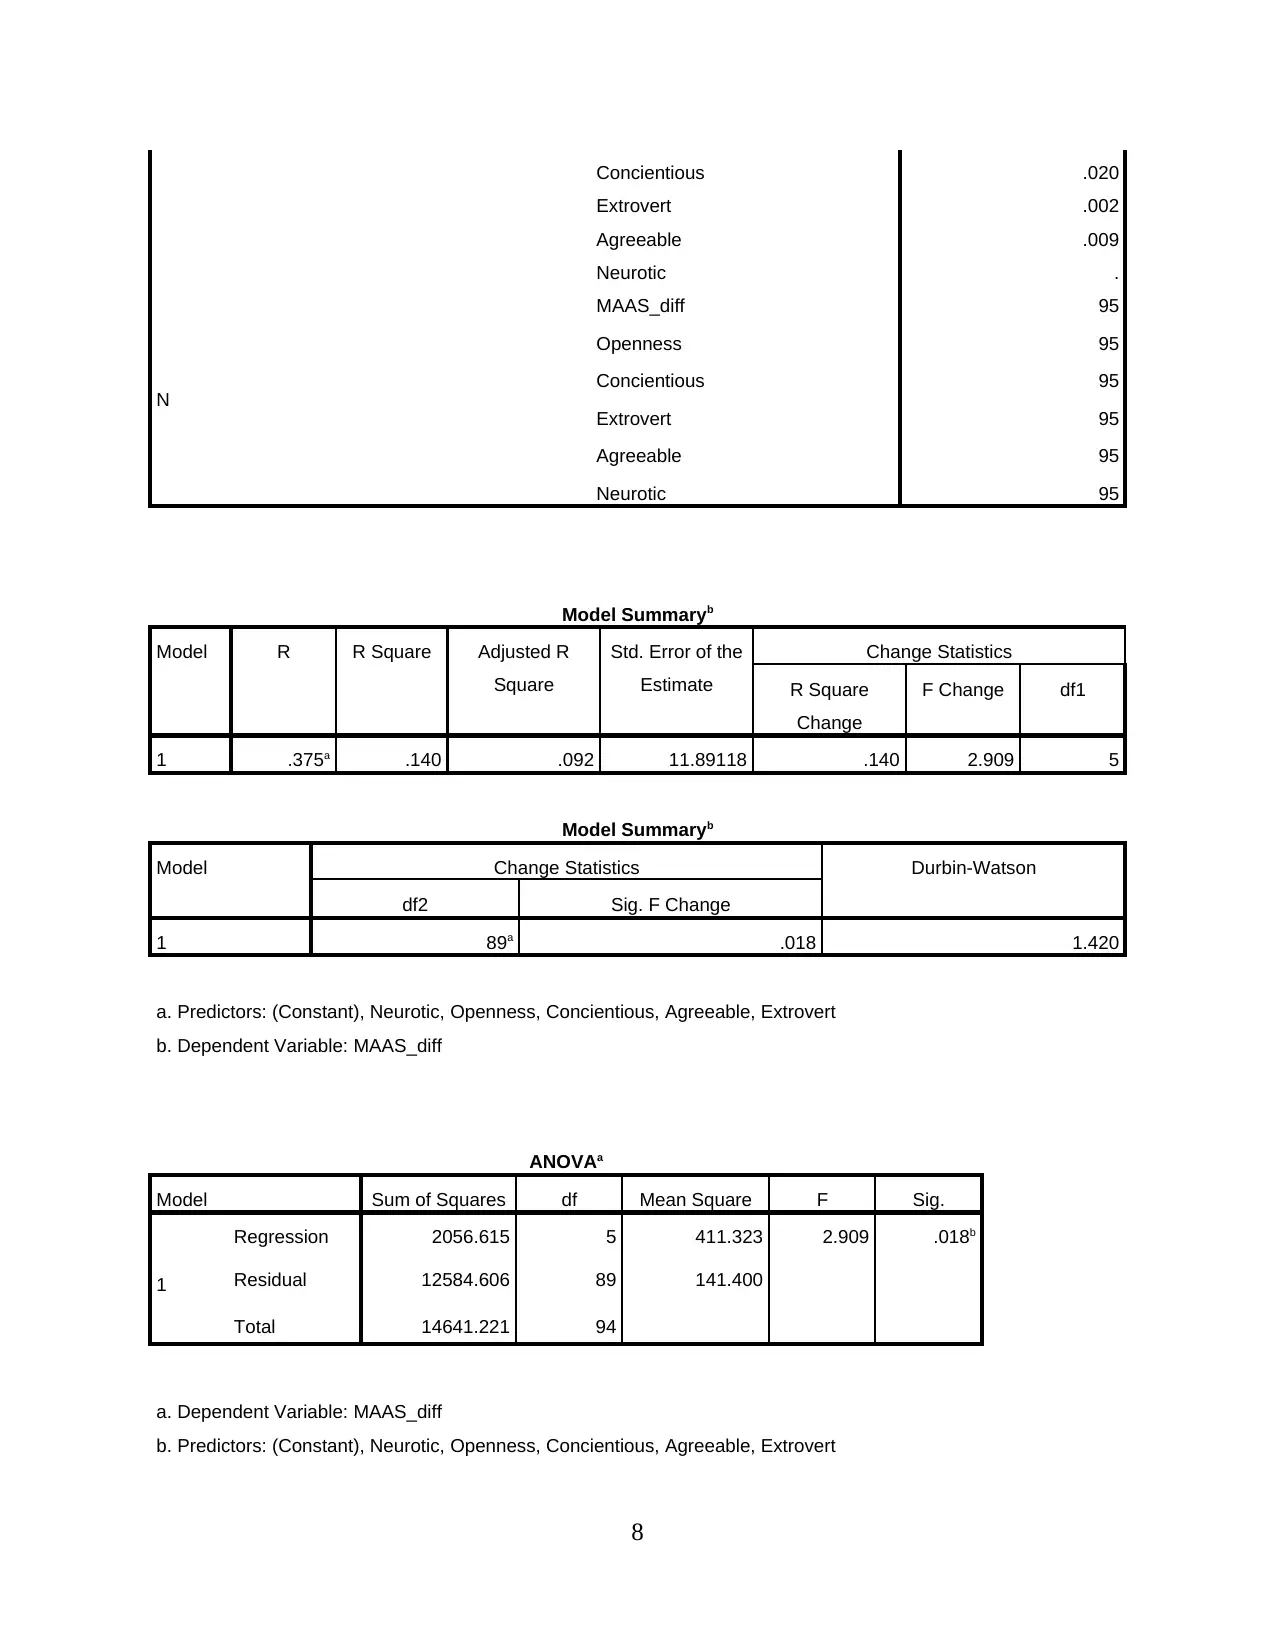
Concientious .020
Extrovert .002
Agreeable .009
Neurotic .
N
MAAS_diff 95
Openness 95
Concientious 95
Extrovert 95
Agreeable 95
Neurotic 95
Model Summaryb
Model R R Square Adjusted R
Square
Std. Error of the
Estimate
Change Statistics
R Square
Change
F Change df1
1 .375a .140 .092 11.89118 .140 2.909 5
Model Summaryb
Model Change Statistics Durbin-Watson
df2 Sig. F Change
1 89a .018 1.420
a. Predictors: (Constant), Neurotic, Openness, Concientious, Agreeable, Extrovert
b. Dependent Variable: MAAS_diff
ANOVAa
Model Sum of Squares df Mean Square F Sig.
1
Regression 2056.615 5 411.323 2.909 .018b
Residual 12584.606 89 141.400
Total 14641.221 94
a. Dependent Variable: MAAS_diff
b. Predictors: (Constant), Neurotic, Openness, Concientious, Agreeable, Extrovert
8
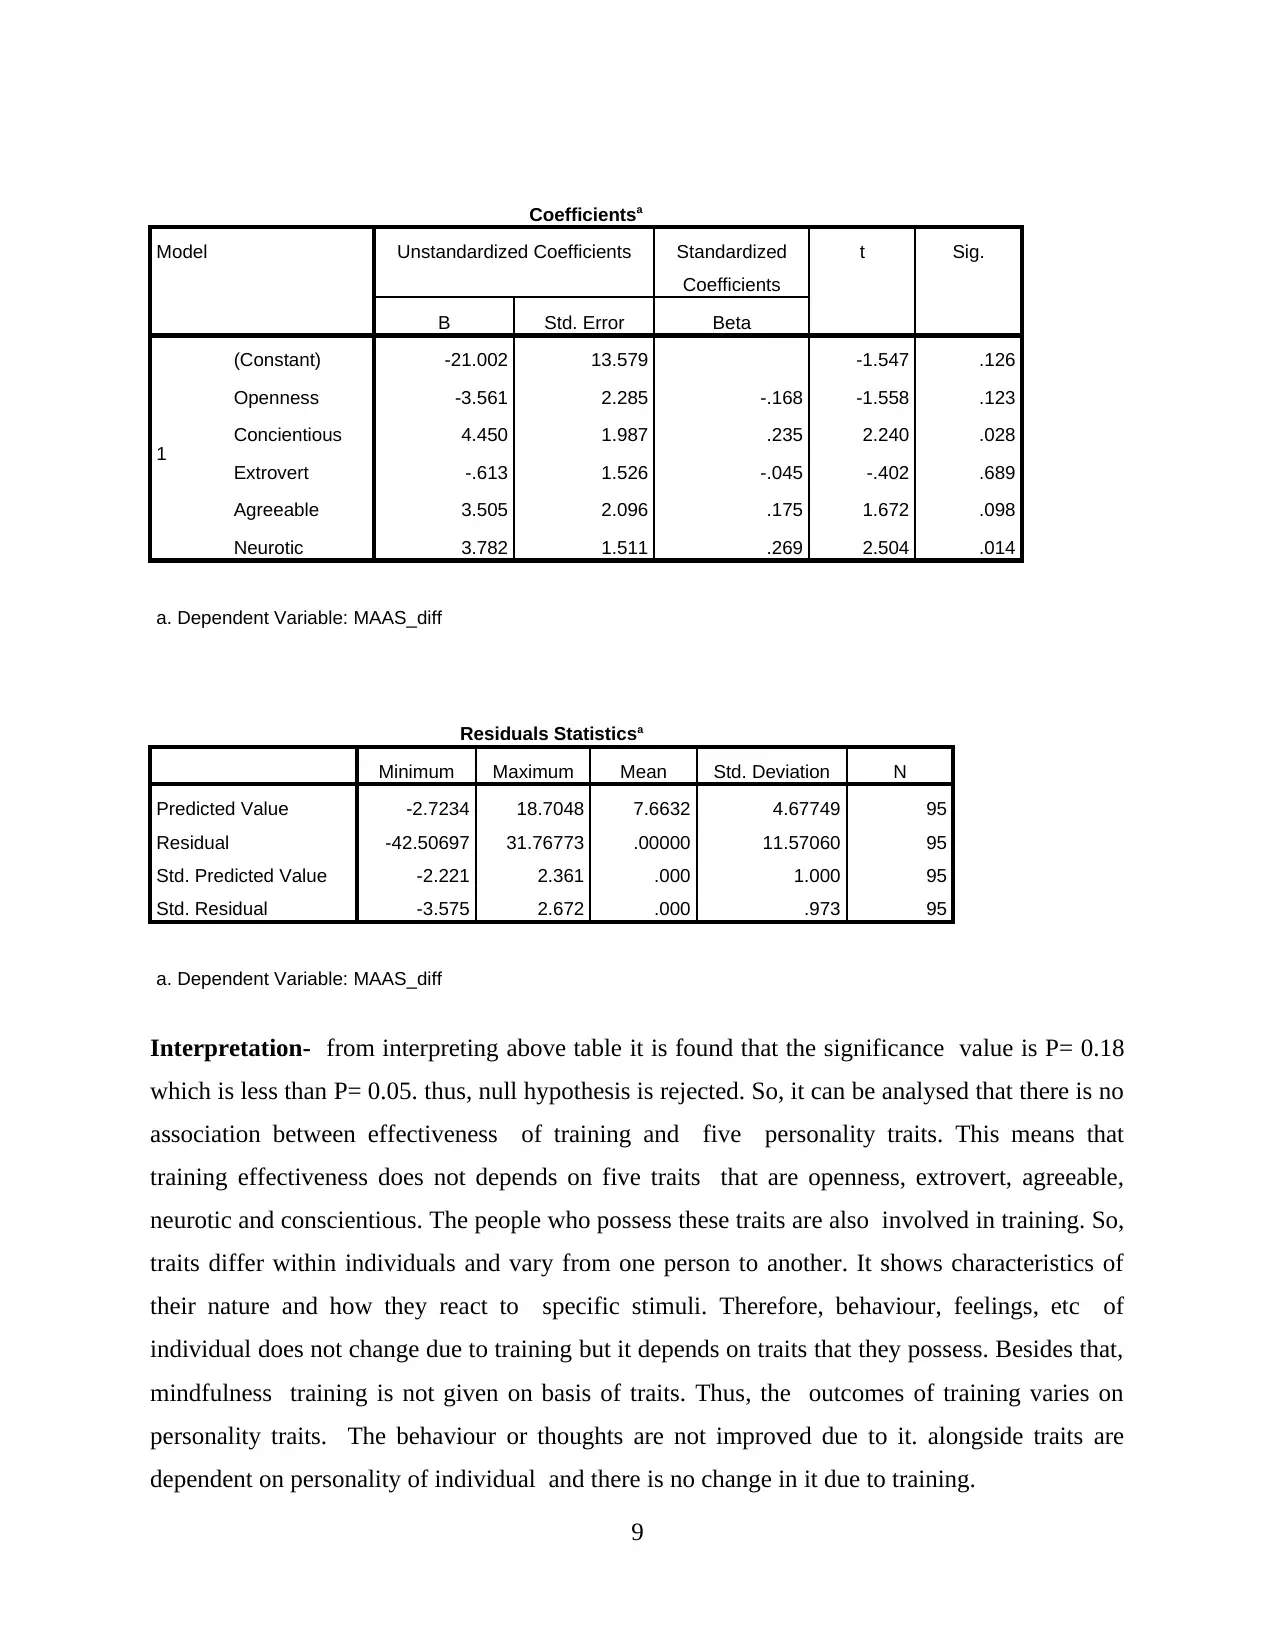
Coefficientsa
Model Unstandardized Coefficients Standardized
Coefficients
t Sig.
B Std. Error Beta
1
(Constant) -21.002 13.579 -1.547 .126
Openness -3.561 2.285 -.168 -1.558 .123
Concientious 4.450 1.987 .235 2.240 .028
Extrovert -.613 1.526 -.045 -.402 .689
Agreeable 3.505 2.096 .175 1.672 .098
Neurotic 3.782 1.511 .269 2.504 .014
a. Dependent Variable: MAAS_diff
Residuals Statisticsa
Minimum Maximum Mean Std. Deviation N
Predicted Value -2.7234 18.7048 7.6632 4.67749 95
Residual -42.50697 31.76773 .00000 11.57060 95
Std. Predicted Value -2.221 2.361 .000 1.000 95
Std. Residual -3.575 2.672 .000 .973 95
a. Dependent Variable: MAAS_diff
Interpretation- from interpreting above table it is found that the significance value is P= 0.18
which is less than P= 0.05. thus, null hypothesis is rejected. So, it can be analysed that there is no
association between effectiveness of training and five personality traits. This means that
training effectiveness does not depends on five traits that are openness, extrovert, agreeable,
neurotic and conscientious. The people who possess these traits are also involved in training. So,
traits differ within individuals and vary from one person to another. It shows characteristics of
their nature and how they react to specific stimuli. Therefore, behaviour, feelings, etc of
individual does not change due to training but it depends on traits that they possess. Besides that,
mindfulness training is not given on basis of traits. Thus, the outcomes of training varies on
personality traits. The behaviour or thoughts are not improved due to it. alongside traits are
dependent on personality of individual and there is no change in it due to training.
9
⊘ This is a preview!⊘
Do you want full access?
Subscribe today to unlock all pages.
Trusted by 1+ million students worldwide
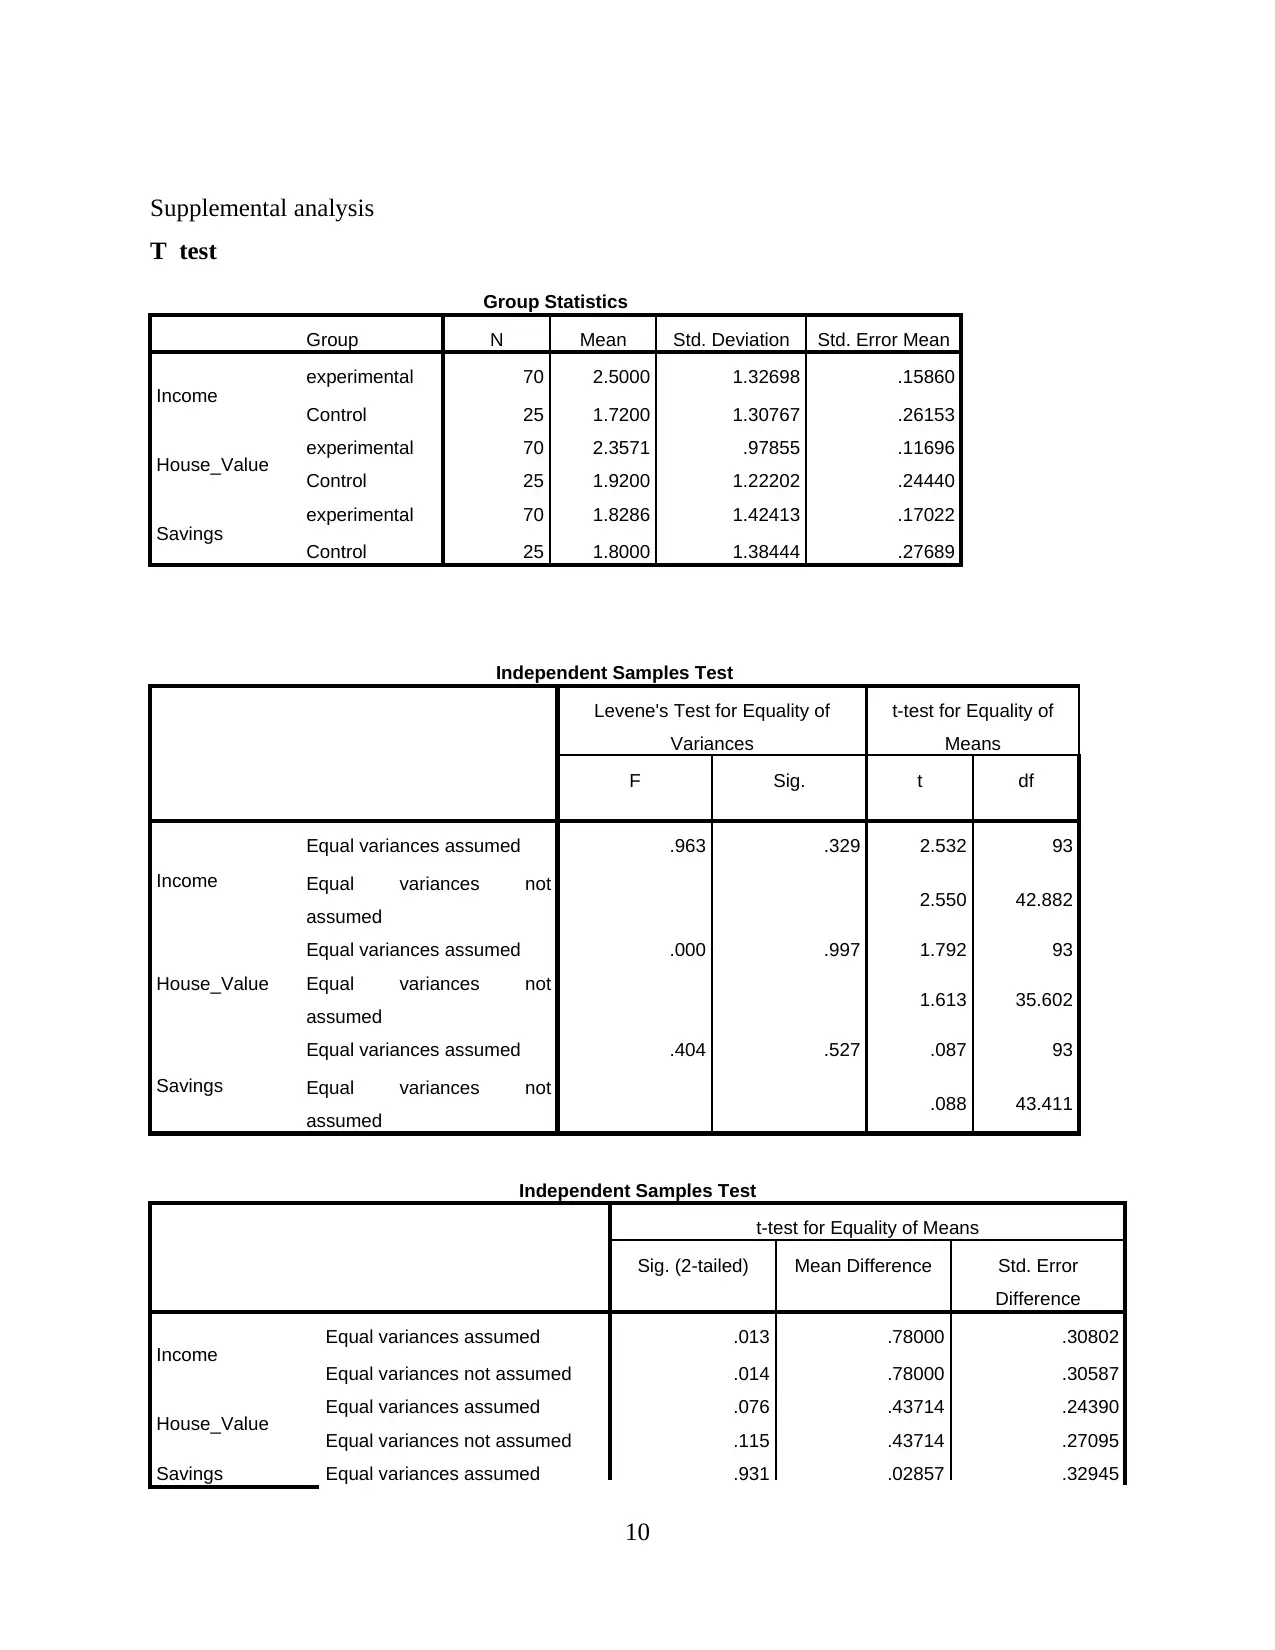
Supplemental analysis
T test
Group Statistics
Group N Mean Std. Deviation Std. Error Mean
Income experimental 70 2.5000 1.32698 .15860
Control 25 1.7200 1.30767 .26153
House_Value experimental 70 2.3571 .97855 .11696
Control 25 1.9200 1.22202 .24440
Savings experimental 70 1.8286 1.42413 .17022
Control 25 1.8000 1.38444 .27689
Independent Samples Test
Levene's Test for Equality of
Variances
t-test for Equality of
Means
F Sig. t df
Income
Equal variances assumed .963 .329 2.532 93
Equal variances not
assumed 2.550 42.882
House_Value
Equal variances assumed .000 .997 1.792 93
Equal variances not
assumed 1.613 35.602
Savings
Equal variances assumed .404 .527 .087 93
Equal variances not
assumed .088 43.411
Independent Samples Test
t-test for Equality of Means
Sig. (2-tailed) Mean Difference Std. Error
Difference
Income Equal variances assumed .013 .78000 .30802
Equal variances not assumed .014 .78000 .30587
House_Value Equal variances assumed .076 .43714 .24390
Equal variances not assumed .115 .43714 .27095
Savings Equal variances assumed .931 .02857 .32945
10
Paraphrase This Document
Need a fresh take? Get an instant paraphrase of this document with our AI Paraphraser
Equal variances not assumed .930 .02857 .32502
Independent Samples Test
t-test for Equality of Means
95% Confidence Interval of the Difference
Lower Upper
Income Equal variances assumed .16833 1.39167
Equal variances not assumed .16311 1.39689
House_Value Equal variances assumed -.04720 .92148
Equal variances not assumed -.11258 .98686
Savings Equal variances assumed -.62565 .68280
Equal variances not assumed -.62672 .68386
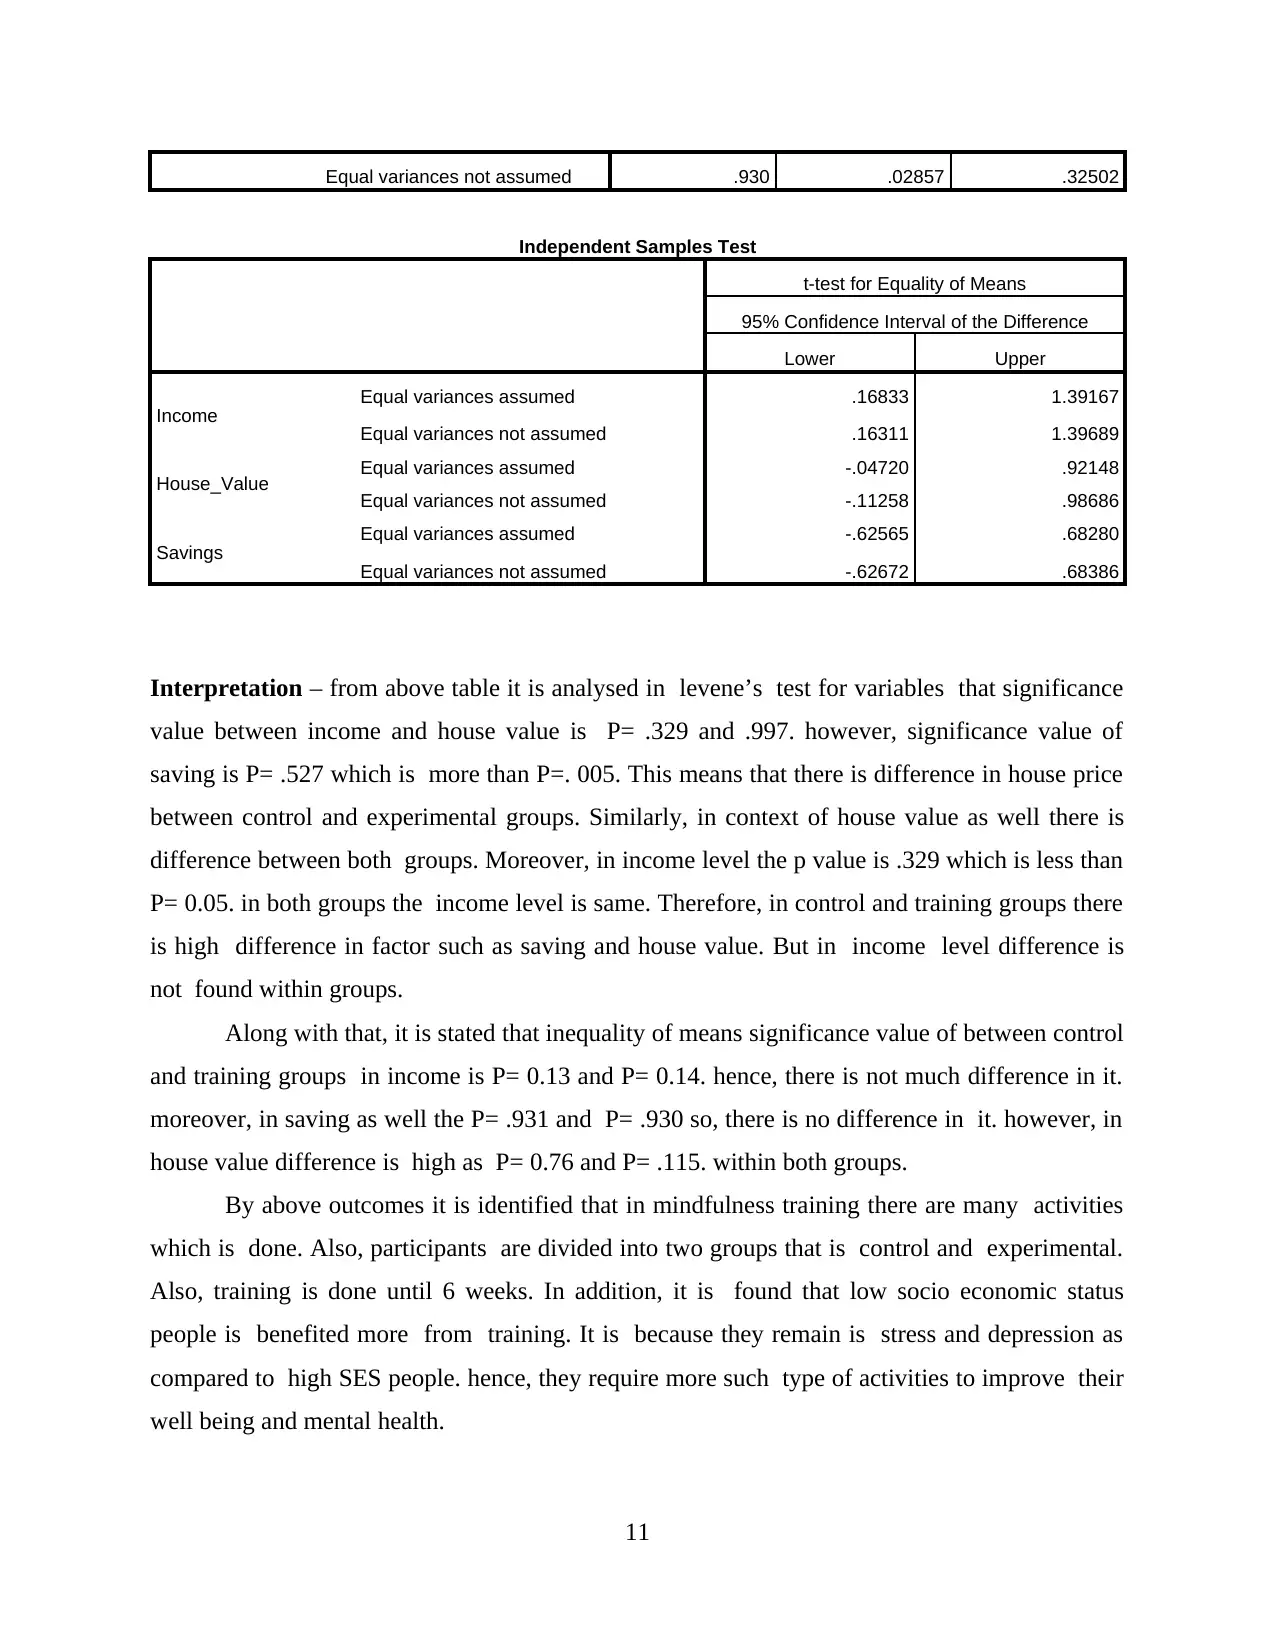
Interpretation – from above table it is analysed in levene’s test for variables that significance
value between income and house value is P= .329 and .997. however, significance value of
saving is P= .527 which is more than P=. 005. This means that there is difference in house price
between control and experimental groups. Similarly, in context of house value as well there is
difference between both groups. Moreover, in income level the p value is .329 which is less than
P= 0.05. in both groups the income level is same. Therefore, in control and training groups there
is high difference in factor such as saving and house value. But in income level difference is
not found within groups.
Along with that, it is stated that inequality of means significance value of between control
and training groups in income is P= 0.13 and P= 0.14. hence, there is not much difference in it.
moreover, in saving as well the P= .931 and P= .930 so, there is no difference in it. however, in
house value difference is high as P= 0.76 and P= .115. within both groups.
By above outcomes it is identified that in mindfulness training there are many activities
which is done. Also, participants are divided into two groups that is control and experimental.
Also, training is done until 6 weeks. In addition, it is found that low socio economic status
people is benefited more from training. It is because they remain is stress and depression as
compared to high SES people. hence, they require more such type of activities to improve their
well being and mental health.
11
Independent Samples Test
t-test for Equality of Means
95% Confidence Interval of the Difference
Lower Upper
Income Equal variances assumed .16833 1.39167
Equal variances not assumed .16311 1.39689
House_Value Equal variances assumed -.04720 .92148
Equal variances not assumed -.11258 .98686
Savings Equal variances assumed -.62565 .68280
Equal variances not assumed -.62672 .68386
Interpretation – from above table it is analysed in levene’s test for variables that significance
value between income and house value is P= .329 and .997. however, significance value of
saving is P= .527 which is more than P=. 005. This means that there is difference in house price
between control and experimental groups. Similarly, in context of house value as well there is
difference between both groups. Moreover, in income level the p value is .329 which is less than
P= 0.05. in both groups the income level is same. Therefore, in control and training groups there
is high difference in factor such as saving and house value. But in income level difference is
not found within groups.
Along with that, it is stated that inequality of means significance value of between control
and training groups in income is P= 0.13 and P= 0.14. hence, there is not much difference in it.
moreover, in saving as well the P= .931 and P= .930 so, there is no difference in it. however, in
house value difference is high as P= 0.76 and P= .115. within both groups.
By above outcomes it is identified that in mindfulness training there are many activities
which is done. Also, participants are divided into two groups that is control and experimental.
Also, training is done until 6 weeks. In addition, it is found that low socio economic status
people is benefited more from training. It is because they remain is stress and depression as
compared to high SES people. hence, they require more such type of activities to improve their
well being and mental health.
11

12
⊘ This is a preview!⊘
Do you want full access?
Subscribe today to unlock all pages.
Trusted by 1+ million students worldwide
1 out of 17


Your All-in-One AI-Powered Toolkit for Academic Success.
+13062052269
info@desklib.com
Available 24*7 on WhatsApp / Email
![[object Object]](/_next/static/media/star-bottom.7253800d.svg)
Unlock your academic potential
Copyright © 2020–2026 A2Z Services. All Rights Reserved. Developed and managed by ZUCOL.