Analysis of Personality Traits and Social Relations: PSY303 Report
VerifiedAdded on 2022/10/19
|9
|3013
|67
Report
AI Summary
This lab report investigates the relationship between personality traits (conscientiousness, openness, and extraversion) and social functioning. The study utilizes a provided SPSS dataset containing demographic factors and the Big Five personality traits. Three hypotheses are developed and tested using paired sample t-tests to determine the impact of each personality trait on social relations. The report includes data cleaning, descriptive statistics, and inferential analysis to determine whether high scores in conscientiousness negatively impact social functioning, if high openness scores correlate with better social functioning, and if high extraversion scores lead to improved social relations. The results, presented in tables, are then discussed to draw conclusions about the validity of the hypotheses and the implications of personality traits on social interactions. The report follows the structure of a typical psychology lab report, including abstract, introduction, method, results, and discussion sections, providing a comprehensive analysis of the data and its implications.
Running Head: PERSONALITY TRAITS
Personality Traits and Social Relations
Name of Student
School Name
Student ID
1
Personality Traits and Social Relations
Name of Student
School Name
Student ID
1
Paraphrase This Document
Need a fresh take? Get an instant paraphrase of this document with our AI Paraphraser
PERSONALITY
Abstract
The aim of this lab report is to establish if personality traits actually affect the way individuals
relate socially. For this, there is an SPSS data file that is provided for use in the actual analysis.
The SPSS file contains demographic factors alongside the big five personality factors. The focus
of the report will be on the big five personality traits and the personal relations variable. From
these three hypotheses will be developed and tested and they are;
1st hypothesis: High individual scores in conscientiousness equal poorer social functioning.
2nd hypothesis: High individual score in openness equals better social functioning.
3rd hypothesis: High individual scores in extraversion equal better social functioning.
The method used in testing the hypothesis will be a paired sample t-test which will be able to
pair up social functioning and respective personality trait to be tested after which we will get the
actual results which help in accepting or rejecting the null hypothesis created (Frank, 2018). The
results can be used to help individuals improve on themselves and even help different people
understand one another.
2
PERSONALITY
Introduction
From the three sets of hypothesis, it is very clear that there will be three statements of
investigations. Three hypotheses equal three tasks of investigations and therefore the number of
statements that will be investigated are three. The variable of interest is the social functioning of
each and every individual in relation to their personal traits. Of the three hypotheses, there is a
consideration of picking only three out of the big five personality traits (LeVine, 2018) that will
relate to individuals personality traits. The statements of the investigation will; finding out if
high scores in individuals' conscientiousness have a poor effect on how they relate socially;
finding out if high openness scores bring forth high social functions; finding out if high scores in
extraversion have positive effects on the social relations of individuals.
The personality traits that were picked, as can be viewed from the hypothesis section are;
conscientiousness, openness and extraversion. Conscientiousness is associated with an
individual's control, regulation, dictation and direction of the urges that they experience.
Individuals with high levels of conscientiousness have high levels of discipline. Such individuals
are more perfectionist and do not leave anything that is under their belt to chance. This by far
could be tasks that are assigned to them. Such individuals, one would say are, possessed by
impressing their seniors and therefore do not decline tasks and see through with tasks to the end.
These are the be alone types and do not like social gatherings and therefore are deemed as boring
people (Chapman, Lin, Roy, Benedict & Lyness, 2019).
Openness is a personality trait that relates to individuals who like trying out new things and
exploring more and more. By literature, open people meet most individuals in the process of
interaction and therefore must be having high social relations or functions. Such individuals do
well in jobs of advertising, research and artistic jobs as all of these jobs require imagination,
open-mindedness and curiosity. All that is mention in the earlier parts of the paragraph would
literally mention the reasons as to why an individual who has high scores in openness has high
levels of social functioning (Guo & Groothuis, 2018).
Extraversion, by literature, spells out that a person who scores highly in extraversion
scores high in social functions as well. Such individuals are the party type who love interacting
with new people and participate in social gatherings. They are too characterized by high levels of
energy and are mostly the centre of attraction in groups. We would say in one word, they are
extraverts and are action, excited and enthusiastic people (Szczygiel & Mikolajczak, 2018).
The variables that are to be used in the analysis of how an individual relates socially are
only based on personality traits. Meaning all the demographic variables; age, sex, marital and
ethnicity will not be used at all. The demographic factors do not largely affect how an individual
typically relates to society but just the personality traits of an individual. There are other two
personality traits that will not be considered in this lab report and they are; neuroticism and
agreeableness. To comprehensively view the relationship of the three personality trait to the
3
⊘ This is a preview!⊘
Do you want full access?
Subscribe today to unlock all pages.
Trusted by 1+ million students worldwide
PERSONALITY
social functioning of individuals that have them, there will be tests on the hypotheses that are
developed and mentioned in the abstract section. There are absolutely different entry scores that
relate to each and every individual used in the lab report research data. The scores range from a
minimum close to zero to a maximum close to the value 10. These entries are made for both
social relations and the respective personality traits that are to be used in the study of this lab
report. The scaling of social functioning as a variable is a bit in excess as the highest value that
was recorded was 17.
The rationale and the aim of the hypotheses are to spell out, via the data are given if the
actual facts from the literature provided actually hold true. As per the hypotheses and the
literature used in the referencing of this lab report, a higher score in one personality trait would
lead to a higher or lower social functioning of an individual. This is to be done via tests in SPSS
to find out the truth of the matters as per the results that will be spelt out (Bibring, 2018).
Method
Students will be the participants of the respective lab report that is to be produced. Each
and every student is expected to open the dataset in SPSS, read and understand all the variables,
look for the demographic variables and understand their positioning as they will not at all be
used in the analysis process and that these factors do not determine the actual behaviour of an
individual. The dataset that is provided with any way has lots of mistakes and missing values and
need cleaning. Using an un-cleaned dataset in the running of analyses prevents an analyst from
getting the best results and therefore is not in the position of making an informed decision as
opposed to if one would have used an already cleaned dataset. Of the dataset, there are values
that are coded as missing values of 99.00 and these values need to be decoded and those cells
must be filled by valid data points that correspond the variables column (Zhao, Lee, Lee & Kim,
2016). This can be done via the variable view at the missing column of the variable view. Of the
cells that actually have totally empty cells, the series mean function can be used in the filling of
the entries (George & Mallery, 2016). The series means cannot be used on binary entry sets on a
variable as this would bring back a decimal not binary result. Therefore for the binary points,
manual entries should be done (Charry, Coussement, Demoulin & Heuvinck, 2016).
In the participant's entries used in the dataset, we had two genders, and that was the males
and females as per the demographic variables. There were different IDs issued to the respective
participants that were used. The participants are actually of different ages with most of them
being the youths. Some of the participants selected for study are single whereas others are
married and others divorced. The personality trait entry score is then recorded for each for every
participant that has been chosen for the personality trait analysis. Entries for how the personality
traits affect the degree at which an individual is to procrastinate or have high social functioning
are also entered. This paragraph explains as well explains the design in which the dataset is
presented. There are scale variables with only two nominal variables.
4
Paraphrase This Document
Need a fresh take? Get an instant paraphrase of this document with our AI Paraphraser
PERSONALITY
From the hypotheses developed, there are four variables that will be used for analysis. These
four variables that are to be used in the analysis and testing of the hypothesis will have their
scaling defined as far as understanding them is concerned. The scaling of social functions starts
at a lower value of up to 1 and goes as high as 17 with other participants taking the values in
between. All the personality traits are all falling on the scaling of between 1 and 10 and no entry
has a value that is higher than that. All the variables that will be considered for testing
hypotheses are all scale variables and there is a nominal variable (Palmer, d’Orazio, Kenwick &
Lane, 2015).
The actual procedure according to this section is the analysis procedure as the directive of
the lab report is to load data onto SPSS after which analysis will be done to deduce results.
Results
The start of this section will be on the scoring of data, and what this means are the
processes followed from the raw data stage (where there exists only raw data that has not
undergone any processing) to the stage of analysis. After analysis, datasets give concrete
information that an analyst uses for making inferential and descriptive interpretation and
conclusion (Yandell, 2017). As per the directive of the assignment, descriptive statistics should
be carried out on the dataset and the results are interpreted. The interpretation of the results of the
inferential statistics and the hypotheses test will be done on the next section with discussion sub-
title. The tables and the figures will be indicated as a picture in this section.
The descriptive statistics conducted was to check on the means, standard deviation, and
variance, skew, median and modes as well. The descriptive statistics are represented in bits with
demographics in a different table and that of personality traits in a totally separate table as well.
For one to arrive at the results of descriptive statistics, go to the analyze tab then descriptive
statistics then click on frequencies and choose the variables that you want to run descriptive
statistics on and choose options to help you get to the area of the descriptive functions. Choose
the descriptive functions like the mean and the rest then click continue then okay. Results will
definitely pop up on the output view (Larson-Hall, 2015).
For the hypothesis test, a paired sample t-test will be appropriate to run and this is done
by going to analyze tab then compare means and later paired sample t-test after which the
dragging of relevant variables to the paired variables section is done and eventually press okay
and the t-test results are produced together with the p-value that determines the actual rejection
or acceptance of the null hypothesis (Opie, 2019).
5
PERSONALITY
Extraversion Agreeableness Conscientiousness EmotStability Openness
Mean 5.5059 7.2093 6.8655 5.2721 6.8014
Median 5.5059 7.3750 7.0000 5.1250 6.8014
Std
deviation
1.32322 1.09462 1.13799 1.52743 1.11642
Variance 1.751 1.198 1.295 2.333 1.246
Table 1
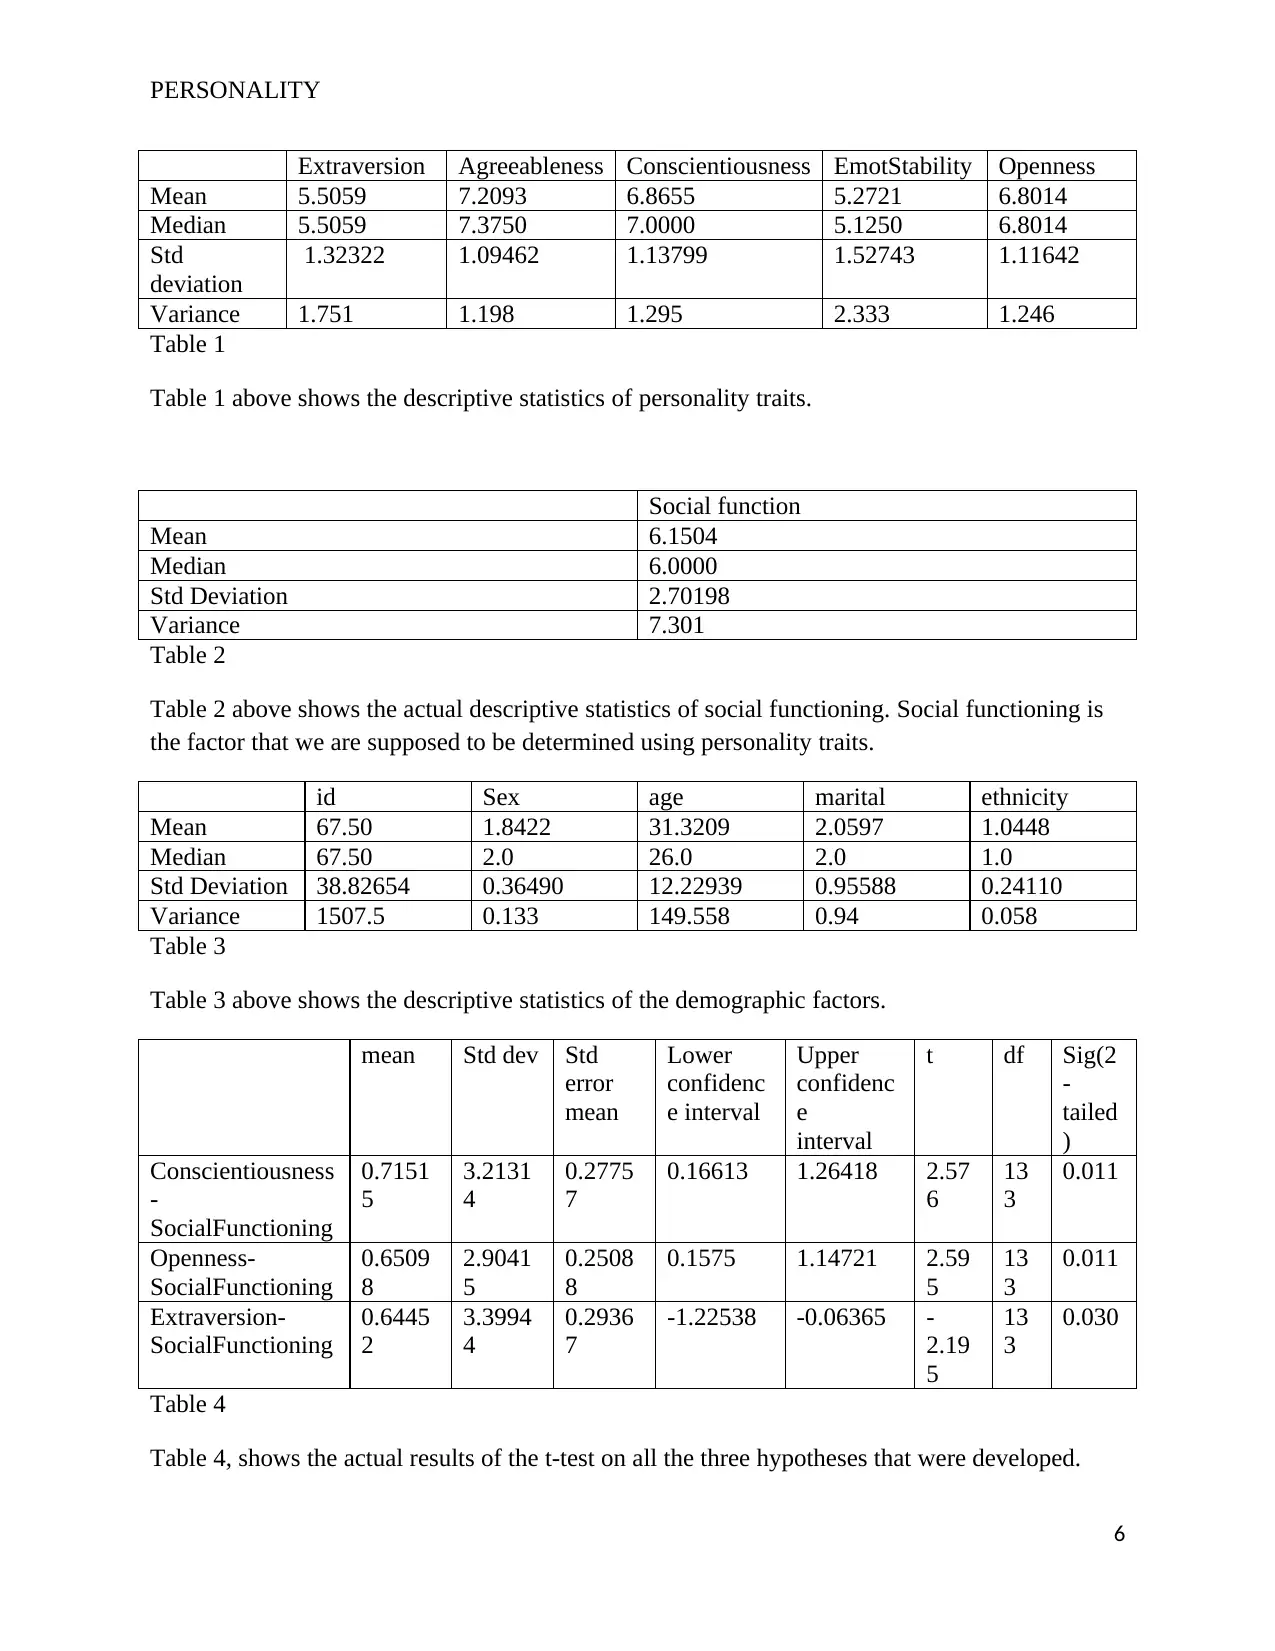
Table 1 above shows the descriptive statistics of personality traits.
Social function
Mean 6.1504
Median 6.0000
Std Deviation 2.70198
Variance 7.301
Table 2
Table 2 above shows the actual descriptive statistics of social functioning. Social functioning is
the factor that we are supposed to be determined using personality traits.
id Sex age marital ethnicity
Mean 67.50 1.8422 31.3209 2.0597 1.0448
Median 67.50 2.0 26.0 2.0 1.0
Std Deviation 38.82654 0.36490 12.22939 0.95588 0.24110
Variance 1507.5 0.133 149.558 0.94 0.058
Table 3
Table 3 above shows the descriptive statistics of the demographic factors.
mean Std dev Std
error
mean
Lower
confidenc
e interval
Upper
confidenc
e
interval
t df Sig(2
-
tailed
)
Conscientiousness
-
SocialFunctioning
0.7151
5
3.2131
4
0.2775
7
0.16613 1.26418 2.57
6
13
3
0.011
Openness-
SocialFunctioning
0.6509
8
2.9041
5
0.2508
8
0.1575 1.14721 2.59
5
13
3
0.011
Extraversion-
SocialFunctioning
0.6445
2
3.3994
4
0.2936
7
-1.22538 -0.06365 -
2.19
5
13
3
0.030
Table 4
Table 4, shows the actual results of the t-test on all the three hypotheses that were developed.
6
Extraversion Agreeableness Conscientiousness EmotStability Openness
Mean 5.5059 7.2093 6.8655 5.2721 6.8014
Median 5.5059 7.3750 7.0000 5.1250 6.8014
Std
deviation
1.32322 1.09462 1.13799 1.52743 1.11642
Variance 1.751 1.198 1.295 2.333 1.246
Table 1
Table 1 above shows the descriptive statistics of personality traits.
Social function
Mean 6.1504
Median 6.0000
Std Deviation 2.70198
Variance 7.301
Table 2
Table 2 above shows the actual descriptive statistics of social functioning. Social functioning is
the factor that we are supposed to be determined using personality traits.
id Sex age marital ethnicity
Mean 67.50 1.8422 31.3209 2.0597 1.0448
Median 67.50 2.0 26.0 2.0 1.0
Std Deviation 38.82654 0.36490 12.22939 0.95588 0.24110
Variance 1507.5 0.133 149.558 0.94 0.058
Table 3
Table 3 above shows the descriptive statistics of the demographic factors.
mean Std dev Std
error
mean
Lower
confidenc
e interval
Upper
confidenc
e
interval
t df Sig(2
-
tailed
)
Conscientiousness
-
SocialFunctioning
0.7151
5
3.2131
4
0.2775
7
0.16613 1.26418 2.57
6
13
3
0.011
Openness-
SocialFunctioning
0.6509
8
2.9041
5
0.2508
8
0.1575 1.14721 2.59
5
13
3
0.011
Extraversion-
SocialFunctioning
0.6445
2
3.3994
4
0.2936
7
-1.22538 -0.06365 -
2.19
5
13
3
0.030
Table 4
Table 4, shows the actual results of the t-test on all the three hypotheses that were developed.
6
⊘ This is a preview!⊘
Do you want full access?
Subscribe today to unlock all pages.
Trusted by 1+ million students worldwide
PERSONALITY
Discussion
In this section discussion of the actual results as per the analysis that we have done so far
will be done. The very first analysis look is on the personality traits table, table 1. The main
focus will be on three personality traits and these are; conscientiousness, openness and
extraversion. The reason for this is because these are the one that we will use in the
determination of individuals personality traits and how they affect their ability to socially relate
with one another. As per table 1, it is evident to see that the means are very close for almost all
variables. This is an indication that all the datasets of the three variables that we are to consider
are actually concentrated around the centre. This is also evident from the results of the variance
where we have the variance value of the three variables to be very low. The standard deviations
of the three variables give us how the data points deviate from each other. These values are very
small giving an indication that the actual variations of the data points of these three variables are
actually not so far apart (Muhammad-Lawal & Atte, 2016).
This part of the section is the most important part as it shows us whether to accept or
reject the null hypotheses that have been developed since the start of the lab report. From table 4
the variables social functioning and conscientiousness both have a mean of slightly over 6 with
smaller standard errors. Correlation value stands at -0.281, this shows that the variables are
negatively correlated. The significant value of the t-test is 0.011 which is less than 0.05 hence we
reject the null hypothesis associated with table 1. This shows that the test is statistically
significant. The same analysis can be used for the remaining hypothesis (Mirman, 2017).
In conclusion, the actual trait of a person does not affect entirely how they relate to the social
relations and this can be seen from the results which act contradictive.
7
Paraphrase This Document
Need a fresh take? Get an instant paraphrase of this document with our AI Paraphraser
PERSONALITY
References
Bibring, E. (2018). The development and problems of the theory of the instincts 1. In Influential
Papers from the 1940s (pp. 53-85). Routledge.
Chapman, B. P., Lin, F., Roy, S., Benedict, R. H., & Lyness, J. M. (2019). Health risk prediction
models incorporating personality data: Motivation, challenges, and illustration.
Personality Disorders: Theory, Research, and Treatment, 10(1), 46.
Charry, K., Coussement, K., Demoulin, N., & Heuvinck, N. (2016). Marketing research with
IBM® SPSS statistics: a practical guide. Routledge.
Frank, A. G. (2018). The development of underdevelopment. In Promise of development (pp.
111-123). Routledge.
George, D., & Mallery, P. (2016). IBM SPSS statistics 23 step by step: A simple guide and
reference. Routledge.
Guo, S. W., & Groothuis, P. G. (2018). Is it time for a paradigm shift in drug research and
development in endometriosis/adenomyosis?. Human reproduction update, 24(5), 577-
598.
Larson-Hall, J. (2015). A guide to doing statistics in second language research using SPSS and
R. Routledge.
LeVine, R. A. (2018). Culture, behaviour, and personality: An introduction to the comparative
study of psychosocial adaptation. Routledge.
Mirman, D. (2017). Growth curve analysis and visualization using R. Chapman and Hall/CRC.
Muhammad-Lawal, A., & Atte, O. A. (2016). An analysis of agricultural production in Nigeria.
African Journal of General Agriculture, 2(1).
Opie, C. (2019). USING EXCEL/SPSS IN YOUR RESEARCH. Getting Started in Your
Educational Research: Design, Data Production and Analysis, 309.
Palmer, G., d’Orazio, V., Kenwick, M., & Lane, M. (2015). The MID4 dataset, 2002–2010:
Procedures, coding rules and description. Conflict Management and Peace Science,
32(2), 222-242.
Szczygiel, D., & Mikolajczak, M. (2018). Is it enough to be an extrovert to be liked? Emotional
competence moderates the relationship between extraversion and peer-rated likeability.
Frontiers in psychology, 9.
Yandell, B. (2017). Practical data analysis for designed experiments. Routledge.
8
PERSONALITY
Zhao, J., Lee, B., Lee, T. W., & Kim, C. G. (2016). U.S. Patent No. 9,380,351. Washington, DC:
U.S. Patent and Trademark Office.
9
Zhao, J., Lee, B., Lee, T. W., & Kim, C. G. (2016). U.S. Patent No. 9,380,351. Washington, DC:
U.S. Patent and Trademark Office.
9
⊘ This is a preview!⊘
Do you want full access?
Subscribe today to unlock all pages.
Trusted by 1+ million students worldwide
1 out of 9
Related Documents


Your All-in-One AI-Powered Toolkit for Academic Success.
+13062052269
info@desklib.com
Available 24*7 on WhatsApp / Email
![[object Object]](/_next/static/media/star-bottom.7253800d.svg)
Unlock your academic potential
Copyright © 2020–2026 A2Z Services. All Rights Reserved. Developed and managed by ZUCOL.