PY7015 Psychology Research Exercises: Data Analysis and Reporting

Verified

Added on  2021/11/16

|23
|4795
|75
Homework Assignment
AI Summary
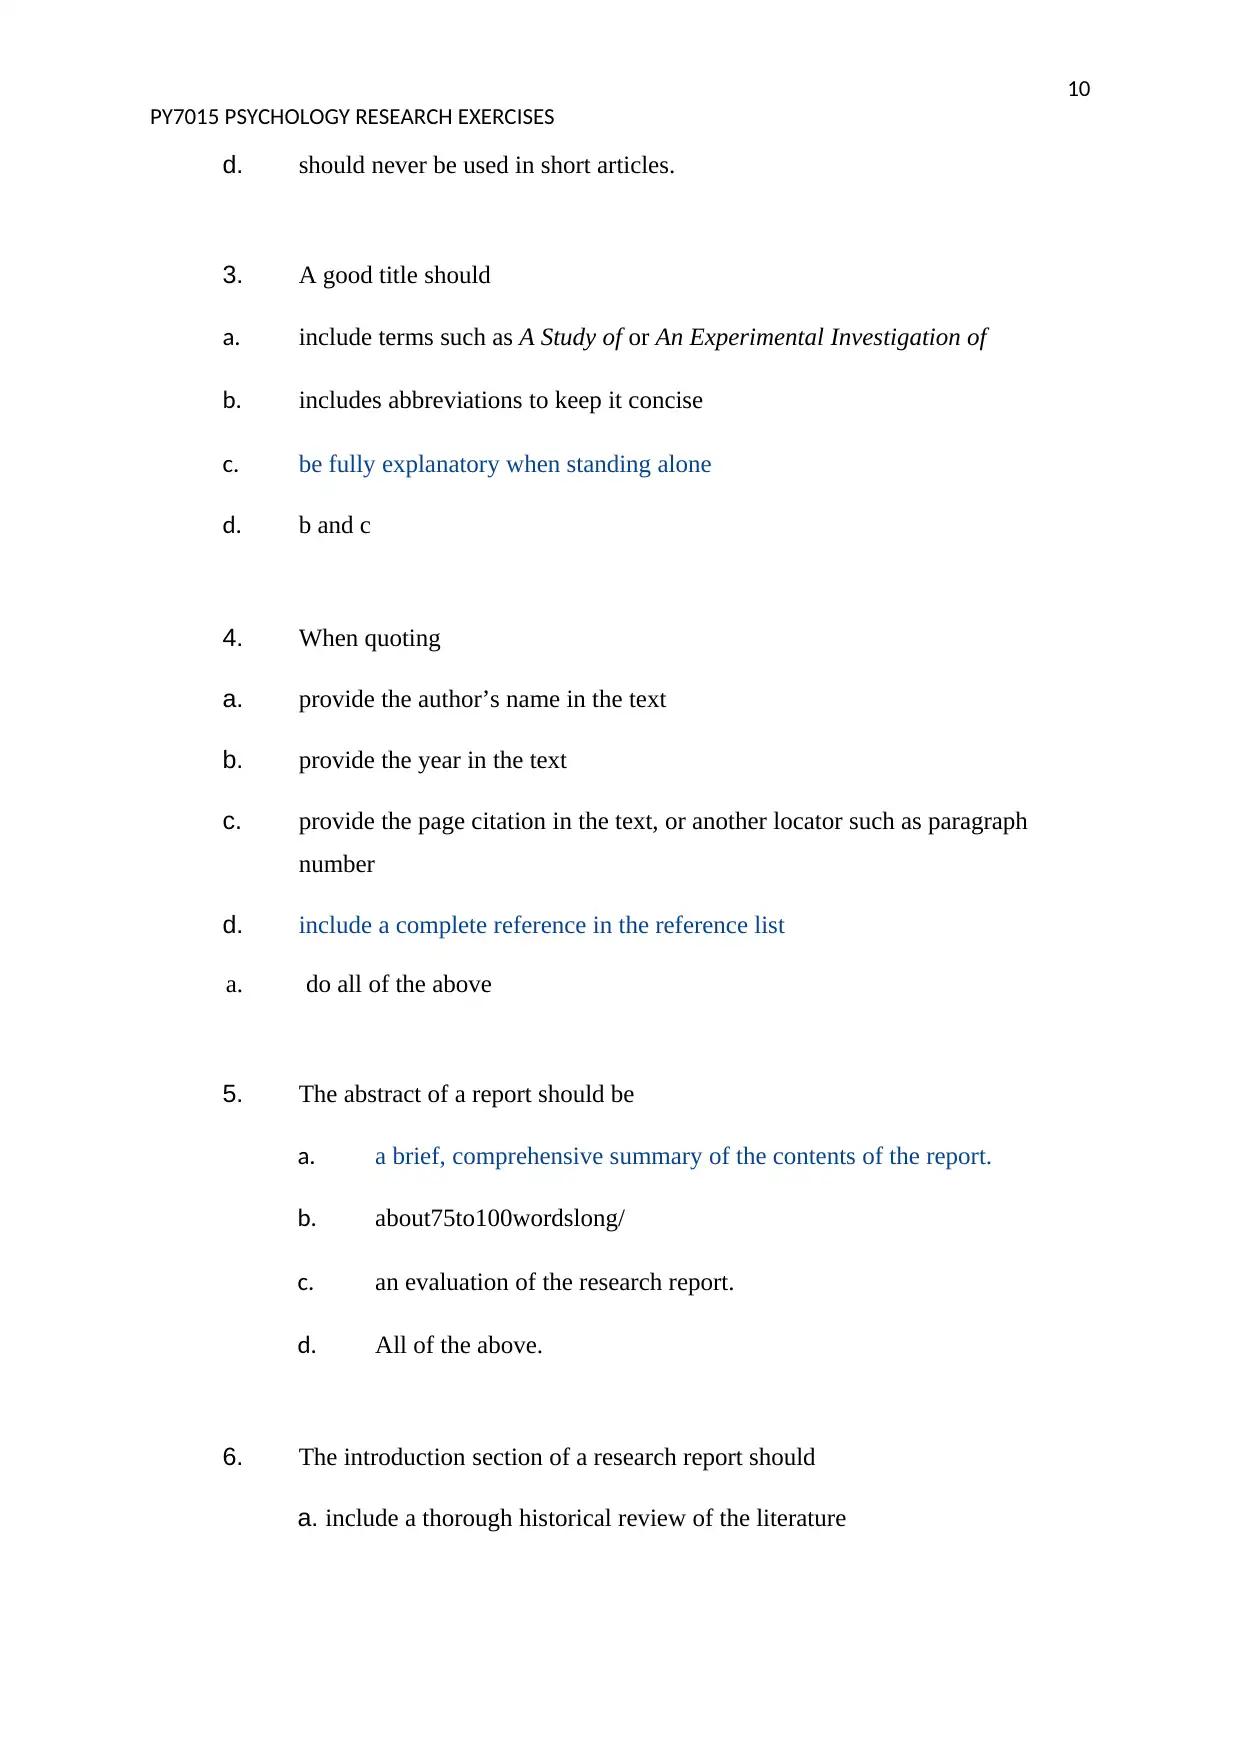
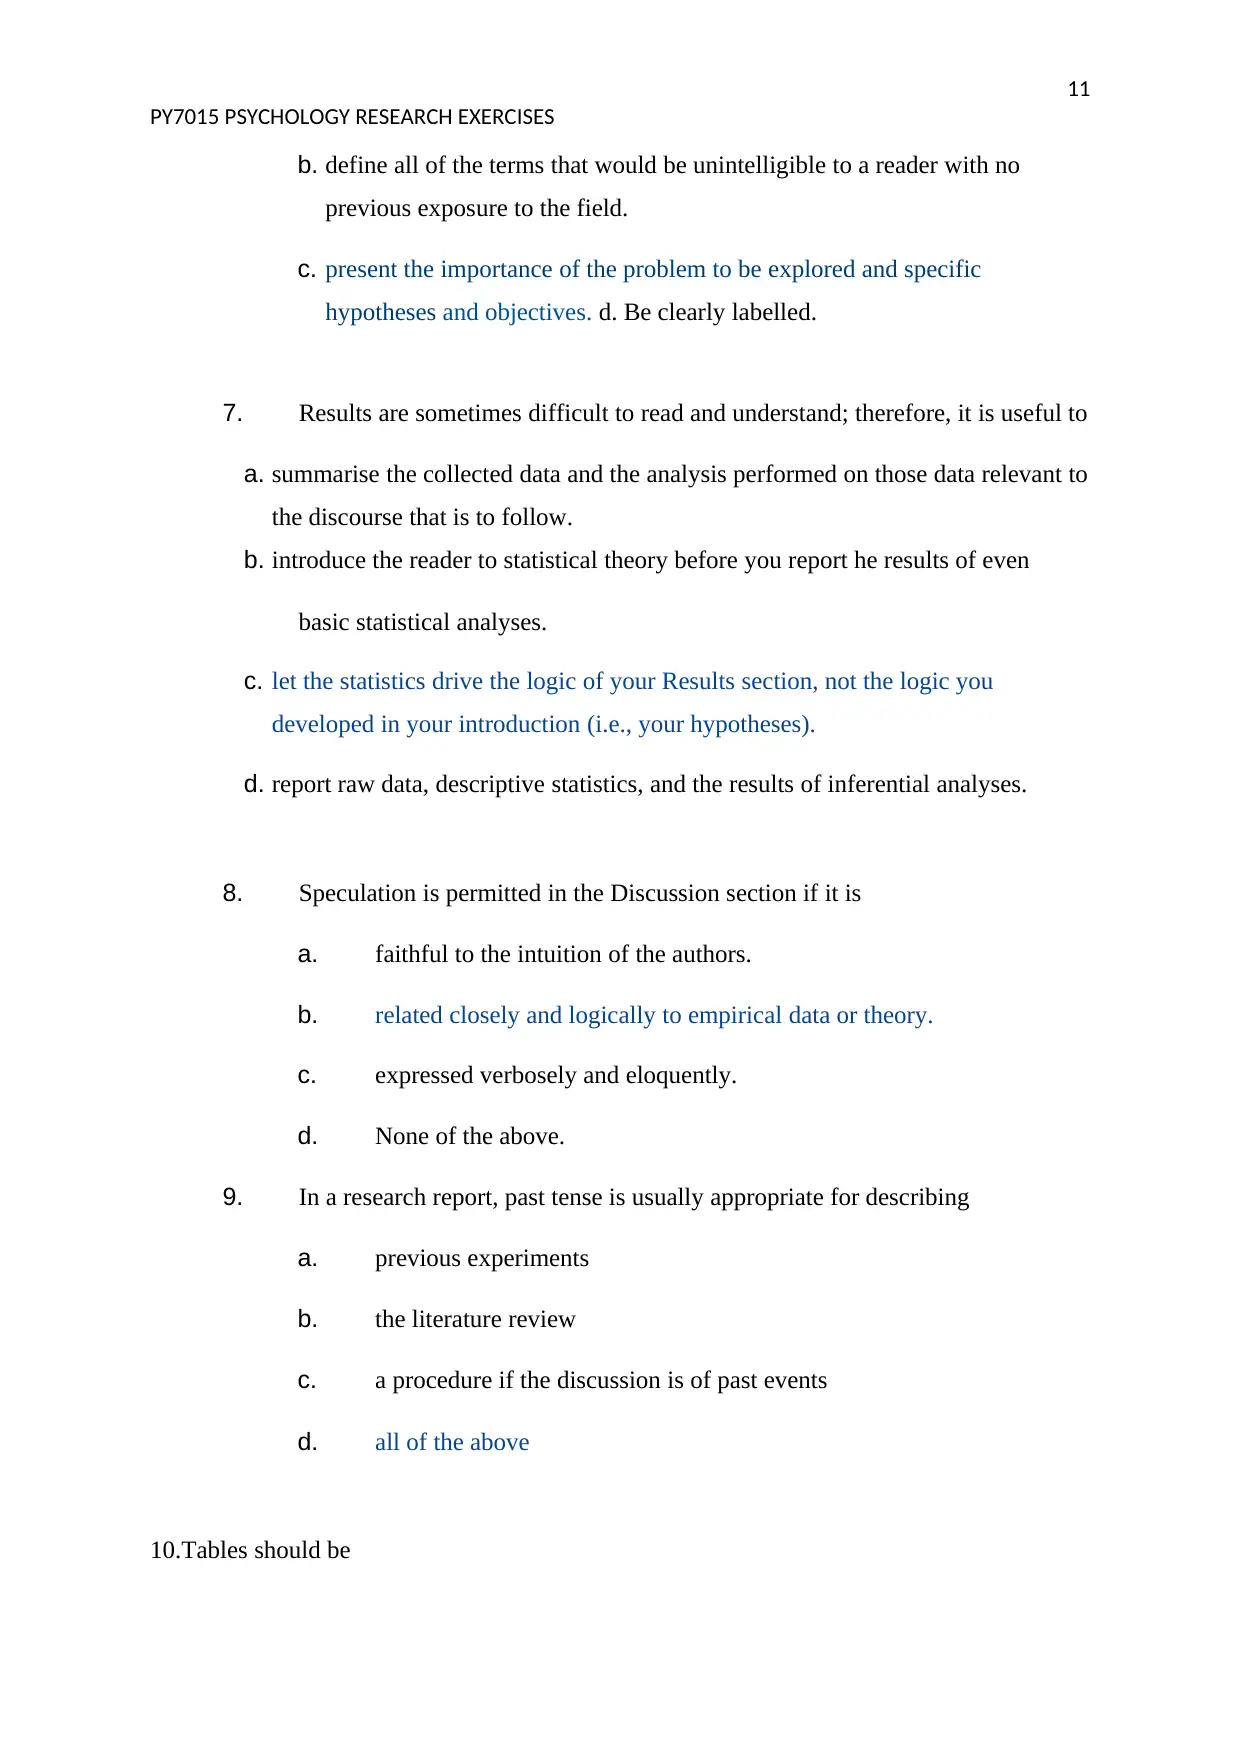
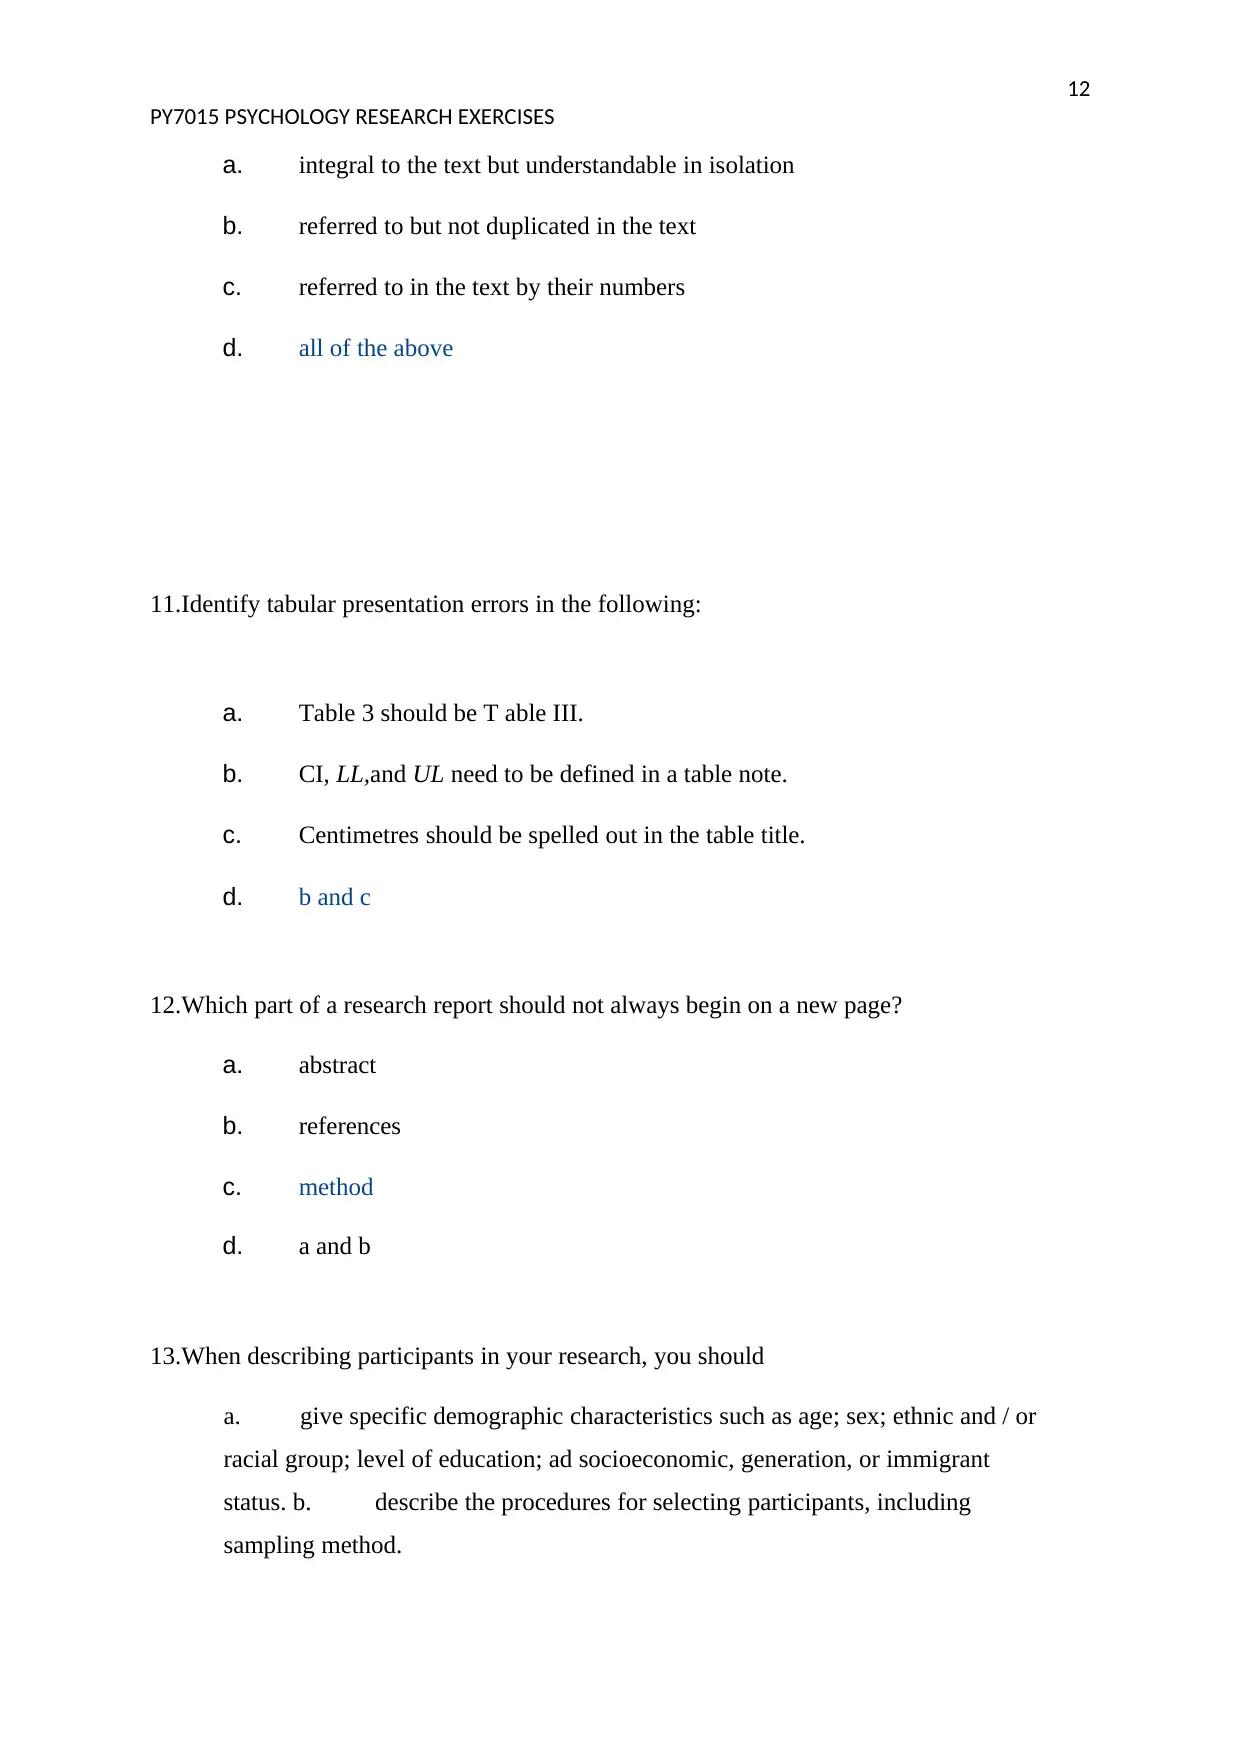
This document presents solutions for a PY7015 Psychology Research Exercises assignment, covering various aspects of psychological research. The assignment includes exercises on quantitative methods, focusing on the goals of science, modifying research ideas, and levels of measurement, along with a comparison of reliability and validity. The second part involves data description using SPSS, including identifying independent and dependent variables, interpreting box plots, and calculating descriptive statistics. Furthermore, the assignment includes multiple-choice questions on reporting quantitative research, such as elements of a good title, referencing, and the structure of a research report. The solutions demonstrate an understanding of research design, data analysis techniques, and the correct format for reporting research findings.
Document Page
1
Running head: PY7015 PSYCHOLOGY RESEARCH EXERCISES
PY7015 PSYCHOLOGY RESEARCH EXERCISES
STUDENT ID:
[Pick the date]
tabler-icon-diamond-filled.svg

Paraphrase This Document

Need a fresh take? Get an instant paraphrase of this document with our AI Paraphraser
Document Page
2
PY7015 PSYCHOLOGY RESEARCH EXERCISES
Contents
Week 1: Quantitative methods.........................................................................................................................3
Week 2 - Data description with SPSS..............................................................................................................5
Exercise 1: Data Description........................................................................................................................5
Week 3: Reporting Quantitative Research........................................................................................................9
Week 4: Research Design 2............................................................................................................................16
Methods and Tools.....................................................................................................................................16
Multiple Choice Questions – Methods and ToolsPlease.................................................................................16
References......................................................................................................................................................23
Document Page
3
PY7015 PSYCHOLOGY RESEARCH EXERCISES
Week 1: Quantitative methods
Using one sentence per goal, briefly describe the four goals of science.
The description of phenomena of interest, of observable behaviour methodically and the records of
the results. The explanation of what causes these phenomena, this behaviour, and sometimes the
suggestion of a theory. Making prediction for our results, which often are built from theories.
Controlling or affecting the phenomenon of interest, attitudes and behaviour. (Heath, 2017).
Word count: 55
State three ways in which you could modify previously published research to create a 'new' research
idea.
You can vary an independent variable or measure the variable of interest in a different way than
previous researchers. Extend the external validity, the ability of generalising results of a research to
other situations and to other people. (Heath, 2017)
Word Count: 40 words
Name the four levels (scales) of measurement and give an example of each (make sure that your
example is described in sufficient detail to demonstrate that it belongs to the level of measurement
that you have used it to illustrate (for example, age could be measured in a variety of different
ways, so giving age as your example would be insufficient).
Nominal, Ordinal, Interval, Ratio.
An example of nominal scale is gender, which has two or more labeled categories: Male, Female,
Transgender. These categories are just named, without having any kind of natural order or numeric
value.
An example of ordinal scale is satisfaction, which is a non-numeric concept and has named and
ordered variables. The distance between variables is not necessarily equal, it can’t be calculated and
known and the zero point is chosen arbitrarily.
An example of interval scale is temperature, because the difference between each value is equal.
The interval between 10 and 20 degrees is the same as the interval between 40 and 50 degrees, but a
temperature of 100 degrees is not twice as hot as 50 degrees.
An example of ratio scale is weight. A ratio scale has all the qualities of an interval scale but has an
absolute zero. The useful point about having an absolute zero is that we can form ratios using such
scales, so a weight of 10 grams is twice a weight of 5 grams.
Word count: 175 words
Describe or create a table or graphic to show the difference between reliability and validity in terms
of measurement of constructs in psychology. You may use note form rather than full sentences.
(max 80 words)
Reliability Validity
It is the extend to which a research yields a
consistent outcome when the researcher does
measurements many times according to
Refers to the degree to which the instrument
the researcher uses in establishing measures
measures what the researcher intends it to
Document Page
4
PY7015 PSYCHOLOGY RESEARCH EXERCISES
LoBiondo-Wood & Haber, (2014) measure.
It does not require a valid instrument to
measure.
The researcher always considers the
reliability
of the instrument.
It is mainly used in ontology which refers to
the study of nature of human beings.
It is mainly applied in epistemology which
refers to the part of philosophy that aims at
acquiring knowledge.
tabler-icon-diamond-filled.svg

Paraphrase This Document

Need a fresh take? Get an instant paraphrase of this document with our AI Paraphraser
Document Page
5
PY7015 PSYCHOLOGY RESEARCH EXERCISES
Week 2 - Data description with SPSS
Exercise 1: Data Description
(Taken from Dancey and Reidy (2017) Chapter 3):
1) The Independent Variable (IV) in the given study is the type of lighting that is used in the
office which is altered by the researcher.
2) The Dependent Variable (DV) in the given study is the number of daily errors made by the
inputters.
3) For the given data, the box plot obtained using SPSS is indicated as follows.
a) The given data is clearly not normally distributed which is apparent from the box plot is
not symmetric. It is evident from the box plot that the difference between Q2-Q1 is not equal
Document Page
6
PY7015 PSYCHOLOGY RESEARCH EXERCISES
to Q3 –Q2. Also, the maximum value is significantly greater owing to which there is
presence of positive skew as indicated from the box plot (Flick, 2015).
b) From the box plot above, it is evident that there are five outliers in the given data as
indicated by circles and asterisk, so the outliers are from scores 3, 4, 5, 13 and 14.
c) The mean and standard deviation of the given data is indicated as follows:
Descriptive Statistics
N Mean
Error 20 21.40
Valid N
(listwise)
20
Descriptive Statistics
N Std.
Deviation
Error 20 6.61
Valid N
(listwise)
20
Exercise 2: Data Description
(Taken from Dancey and Reidy (2017) Chapter 3)
1) The IV in this study is if the students took or not hallucinogenic drugs while they were
attending Dr Boering’s lectures.
Document Page
7
PY7015 PSYCHOLOGY RESEARCH EXERCISES
2) The DV in this study is the marks obtained by students in the exam at the end of the term
since the marks are supposed to be dependent on the decision taken by the students to
consume or avoid consumption of hallucinogenic drug.
3) The histogram for the marks of those students who took hallucinogenic drugs in Dr.
Boering’s lectures has been derived using SPSS as shown below:
The histogram for the marks of those students who did not take hallucinogenic drugs in Dr.
Boering’s lectures has been derived using SPSS as shown below:
tabler-icon-diamond-filled.svg

Paraphrase This Document

Need a fresh take? Get an instant paraphrase of this document with our AI Paraphraser
Document Page
8
PY7015 PSYCHOLOGY RESEARCH EXERCISES
a) Based on the histograms of the scores for two sets of students shown above, it is apparent
that they can be assumed to be roughly normally distributed. This is on account of the
middle value in the distribution having the highest frequency and lower frequencies are to
the left and right (Ericsson & Kovalainen, 2015).
b) The corresponding outputs indicating the mean and standard deviation of marks of those
students who took hallucinogenic drugs in Dr. Boering’s lectures has been derived using
SPSS as shown below:
Document Page
9
PY7015 PSYCHOLOGY RESEARCH EXERCISES
The corresponding outputs indicating the mean and standard deviation of marks of those
students who did not take hallucinogenic drugs in Dr. Boering’s lectures has been derived
using SPSS as shown below:
On the basis of the above outputs, it can be concluded that highest mean is exhibited by the
group of students who did not take hallucinogenic drugs in Dr. Boering’s lectures. Variability
is captured by standard deviation which is higher for the group of students who did take
hallucinogenic drugs in Dr. Boering’s lectures (Hastie, Tibshirani & Friedman, 2016).
Week 3: Reporting Quantitative Research
Multiple Choice Questions
1. The introduction of a report
a. discusses the importance of the problem and why it needs research
b. describes in detail how the study was conducted
c. describes the sample adequately
d. includes information essential to comprehend and replicate the study
2. A reference list
a. cites all works supportive of or contradictory to the text.
b. Is a synonym for bibliography
c. should include only the references cited in the article
Document Page
10
PY7015 PSYCHOLOGY RESEARCH EXERCISES
d. should never be used in short articles.
3. A good title should
a. include terms such as A Study of or An Experimental Investigation of
b. includes abbreviations to keep it concise
c. be fully explanatory when standing alone
d. b and c
4. When quoting
a. provide the author’s name in the text
b. provide the year in the text
c. provide the page citation in the text, or another locator such as paragraph
number
d. include a complete reference in the reference list
a. do all of the above
5. The abstract of a report should be
a. a brief, comprehensive summary of the contents of the report.
b. about75to100wordslong/
c. an evaluation of the research report.
d. All of the above.
6. The introduction section of a research report should
a. include a thorough historical review of the literature
tabler-icon-diamond-filled.svg

Paraphrase This Document

Need a fresh take? Get an instant paraphrase of this document with our AI Paraphraser
Document Page
11
PY7015 PSYCHOLOGY RESEARCH EXERCISES
b. define all of the terms that would be unintelligible to a reader with no
previous exposure to the field.
c. present the importance of the problem to be explored and specific
hypotheses and objectives. d. Be clearly labelled.
7. Results are sometimes difficult to read and understand; therefore, it is useful to
a. summarise the collected data and the analysis performed on those data relevant to
the discourse that is to follow.
b. introduce the reader to statistical theory before you report he results of even
basic statistical analyses.
c. let the statistics drive the logic of your Results section, not the logic you
developed in your introduction (i.e., your hypotheses).
d. report raw data, descriptive statistics, and the results of inferential analyses.
8. Speculation is permitted in the Discussion section if it is
a. faithful to the intuition of the authors.
b. related closely and logically to empirical data or theory.
c. expressed verbosely and eloquently.
d. None of the above.
9. In a research report, past tense is usually appropriate for describing
a. previous experiments
b. the literature review
c. a procedure if the discussion is of past events
d. all of the above
10.Tables should be
Document Page
12
PY7015 PSYCHOLOGY RESEARCH EXERCISES
a. integral to the text but understandable in isolation
b. referred to but not duplicated in the text
c. referred to in the text by their numbers
d. all of the above
11.Identify tabular presentation errors in the following:
a. Table 3 should be T able III.
b. CI, LL,and UL need to be defined in a table note.
c. Centimetres should be spelled out in the table title.
d. b and c
12.Which part of a research report should not always begin on a new page?
a. abstract
b. references
c. method
d. a and b
13.When describing participants in your research, you should
a. give specific demographic characteristics such as age; sex; ethnic and / or
racial group; level of education; ad socioeconomic, generation, or immigrant
status. b. describe the procedures for selecting participants, including
sampling method.
chevron_up_icon
1 out of 23
circle_padding
hide_on_mobile
zoom_out_icon
[object Object]