Report: Research Methods & Ethics in Psychology - Lie Detection
VerifiedAdded on 2022/12/29
|14
|2975
|1
Report
AI Summary
This report presents a study on research methods and ethics in psychology, focusing on a lie detection experiment. The study utilized psychophysiological instruments to monitor heart rate, electrodermal activity, and blood pressure. Participants were subjected to scenarios involving deceptive responses and the measurement of EDA. The study included two groups, one exposed to a polygraph evaluation session. The report details the methods, including regression and descriptive analysis, and presents the results, which include statistical data such as correlations and ANOVA tables. The study also touches on contemporary issues in psychology, such as the implications of direct-to-consumer DNA tests and the ethical considerations surrounding them. The results section provides statistical data, including regression analysis results and descriptive analysis results. The report provides a comprehensive overview of the study's design, execution, and findings, offering insights into the complexities of psychological research and ethical considerations.

Research Methods &
Ethics in Psychology
Ethics in Psychology
Paraphrase This Document
Need a fresh take? Get an instant paraphrase of this document with our AI Paraphraser
Table of Contents
INTRODUCTION...........................................................................................................................3
Methods...........................................................................................................................................3
Results..............................................................................................................................................3
Conclusion.......................................................................................................................................3
INTRODUCTION
Psychophysiological instruments monitoring heart rate (HR), electro dermal activity (EDA) and
blood pressure were linked to each individual (RR). Also EDA will be used as a descriptive
indicator of the operation of the autonomic for this study, in which a stronger average value
reflects higher EDA values, taken as an indicator of further enthusiasm. The greater the EDA
quality, the further the hands sweat, in many other words. The same series of assignments is
completed by each member. A set of ten respondents were answered and then either respondents
answered honestly or the deceived. On 3-5 of the 10 questions, respondents were told to take a
factually inaccurate answer. Participants also participated in a monitoring scenario where
painted sheets of data were shown to them. They actually stared at the text that was put in the
front of themselves for 10 seconds. When individuals cheated, stated the facts, and then shown
colour paper, the overall EDA operation was then measured for each student. The section
consists of two separate groups, with each group having 40 members. As parts of the teaching
practicum, some group attended the polygraph evaluation session, in which a cynical perception
of the polygraph's usefulness as a psychological test was presented. The researchers' age bracket
was 18-29 years, with 65 percent female. In exchange for course points, students in the middle
category were asked to participate in a study. Numerous famous polygraph managers performed
the training session as well as the interview process was favourably identified as a secure and
accurate tool for identifying lies. Only after debriefing was the subject advised that the two
background check observers were not technically qualified experts, but two team leaders from
another agency instead.
Contemporary issues in Psychology
This analysis demonstrates the extraordinary occurrence in three people who have recently found
that they have been not just too strongly predisposed but yet have at least 15 further relatives
associated with donors. With their consent, their data release the personal dynamics and
difficulties of exploration via such a manner and how this new insight will influence other people
in these ecosystems. Another member of the party was also warned about his roots by a DTC
Dna sample and during preparation of the comment. The news had to be quite 'awful' but rather
induced disappointment, excitement and gratitude that nothing more was involved. The fear of
her parents, which had not been known, was that it could influence her father's feeling to even
though she was very close. The absence of a maternal genetic relationship was verified when
⊘ This is a preview!⊘
Do you want full access?
Subscribe today to unlock all pages.
Trusted by 1+ million students worldwide
Adrianne requested the parental relative to evaluate the DNA. During these three 'different'
representatives of the larger donor groups, numerous connections (face-to-face, e-mail,
telephone) have been formed as they navigate their route with mixes of interest, enthusiasm and
puzzlement. Discussions these people face common and some distinct obstacles (and rewards)
due to the need for them or relatives of direct-to-consumer DNA experiments for purposes of
non-conception. All 3 had to pick who else that would tell their relatives which can be the main
reason for the issue. The difficulties (and rewards) not only were communicated by their
relatives as well as by themselves. Caryl and Adrianne's (adult) kids had to both adapt ourselves
to new knowledge, but rather to determine when and where to tell their moms (and in turn with
whom else in their networks to share the information). For at least a handful, the knowledge gave
consolation, when you thought it clarified certain 'foundational gaps' between your immediate
and your mother's daughter's. This helps the researcher to approximate the conditional
probability (or population mean price) of the predictor variables for particular statistical purposes
(see linear regression) as the three factors take over a specified set of values. Slightly various
methods are used for less traditional types of regression to approximate alternative position
conditions (e.g. quantile regression or Required Condition Analysis) or to calculate the
conditional probability over a larger collection of non-linear equations. For 2 conceptually
distinct reasons, regression analysis is commonly used. Second, for modelling and forecasting,
predictive testing is frequently used, where its application overlaps considerably with the area of
information technology. Second, multiple regressions could be used in certain cases to assume
causal associations between correlation analysis. Pertinently, regressions of their own only
display correlations in a fixed sample between such a predictor variables and a series of
independent factors.
Methods
The main methods used to determine the relationship between variables are discussed below:
Regression analysis:
Regression analysis is a collection of mathematical methods used to measure the relationship
among variables and one or more predictor variable (almost always referred to as 'predictor
variables',' covariates', or 'characteristics'). Regression model is perhaps the most general type of
regression analysis, where a researcher seeks the line (or the more complex control mixture) that
matches the information more strongly as per a particular mathematical criterion. The quantile
Paraphrase This Document
Need a fresh take? Get an instant paraphrase of this document with our AI Paraphraser
regression rule, for example, calculates a particular line (or hyperplane) that minimises the sum
of recognise between both the real data but that row (and hyperplane). This helps the researcher
to approximate the conditional probability (or population mean price) of the predictor variables
for particular statistical purposes (see linear regression) as the three factors take over a specified
set of values. Slightly various methods are used for less traditional types of regression to
approximate alternative position conditions (e.g. quantile regression or Required Condition
Analysis) or to calculate the conditional probability over a larger collection of non-linear
equations. For 2 conceptually distinct reasons, regression analysis is commonly used. Second, for
modelling and forecasting, predictive testing is frequently used, where its application overlaps
considerably with the area of information technology. Second, multiple regressions could be
used in certain cases to assume causal associations between correlation analysis. Pertinently,
regressions of their own only display correlations in a fixed sample between such a predictor
variables and a series of independent factors. A study must keep explaining why current
associations have explanatory prospect of a new background or why a coefficient of correlation
has a functional meaning in order to use regression analysis for forecasting or to assume causal
relations, accordingly. When investigators intend to approximate causal interactions using
observational evidence that too is particularly important.
Descriptive analysis:
It is a type of predictive hypothesis test that is extensively included in observational
statistical analysis. A test outcome (computed from the regression model and the survey) is
considered statistically important if, assuming the validity of the regression model, it is found
impossible to have arisen by mistake. If the likelihood (p-value) is much less than before the
criterion (effect size), a clinically significant outcome supports the null hypothesis was rejected,
but unless the a-priori likelihood of the hypothesis isn't really high. The scientific method in the
standard ANOVA framework is that classes are latent variables from same community. For
instance, the scientific method, when examining the effects of various therapies on identical
clinical specimens, is that those therapies had same effect (perhaps none). The dismissal of the
anthropic principle is known to mean that perhaps the variations between patient groups
throughout the results found are impossible to be attributed to pure guessing. Methodologies of
Regression appear to become a subject of intensive study. New technologies have been
implemented in recent years for robust regression, correlation including associated responses like
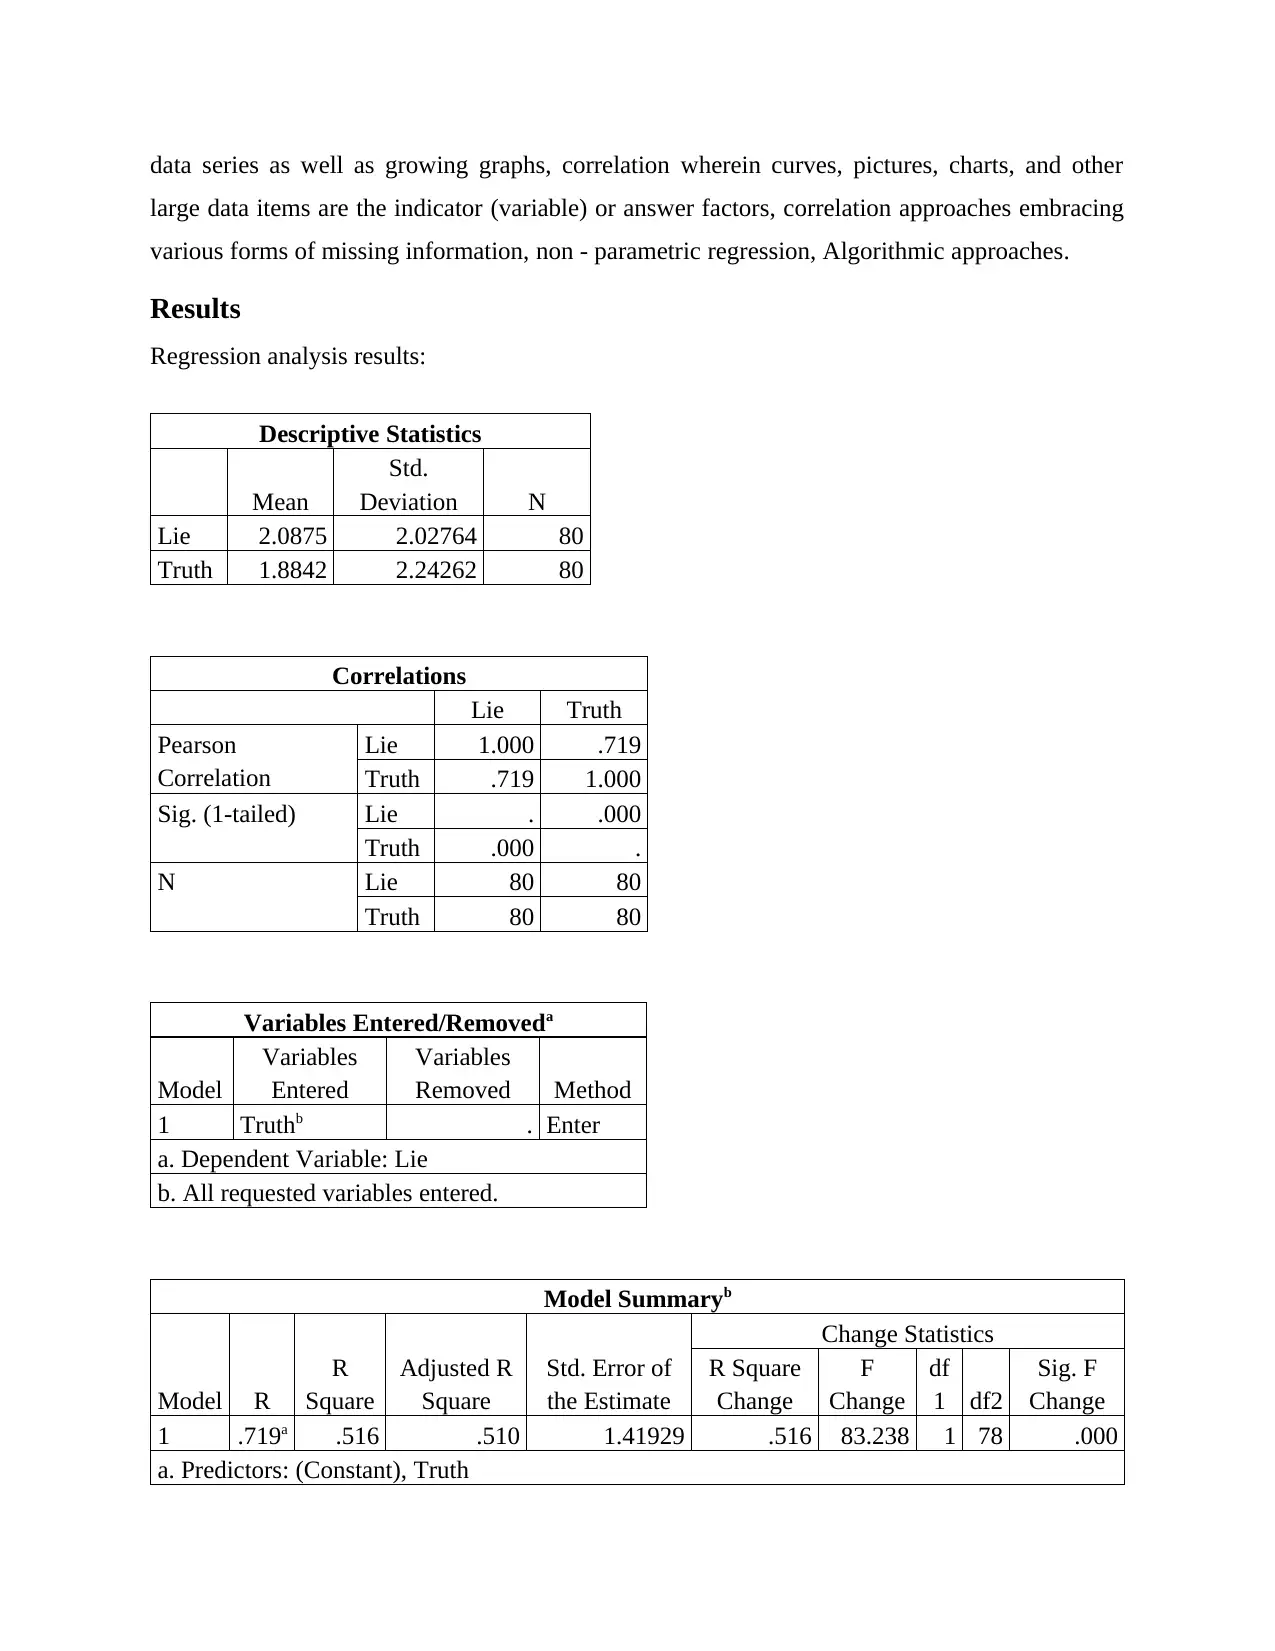
data series as well as growing graphs, correlation wherein curves, pictures, charts, and other
large data items are the indicator (variable) or answer factors, correlation approaches embracing
various forms of missing information, non - parametric regression, Algorithmic approaches.
Results
Regression analysis results:
Descriptive Statistics
Mean
Std.
Deviation N
Lie 2.0875 2.02764 80
Truth 1.8842 2.24262 80
Correlations
Lie Truth
Pearson
Correlation
Lie 1.000 .719
Truth .719 1.000
Sig. (1-tailed) Lie . .000
Truth .000 .
N Lie 80 80
Truth 80 80
Variables Entered/Removeda
Model
Variables
Entered
Variables
Removed Method
1 Truthb . Enter
a. Dependent Variable: Lie
b. All requested variables entered.
Model Summaryb
Model R
R
Square
Adjusted R
Square
Std. Error of
the Estimate
Change Statistics
R Square
Change
F
Change
df
1 df2
Sig. F
Change
1 .719a .516 .510 1.41929 .516 83.238 1 78 .000
a. Predictors: (Constant), Truth
⊘ This is a preview!⊘
Do you want full access?
Subscribe today to unlock all pages.
Trusted by 1+ million students worldwide
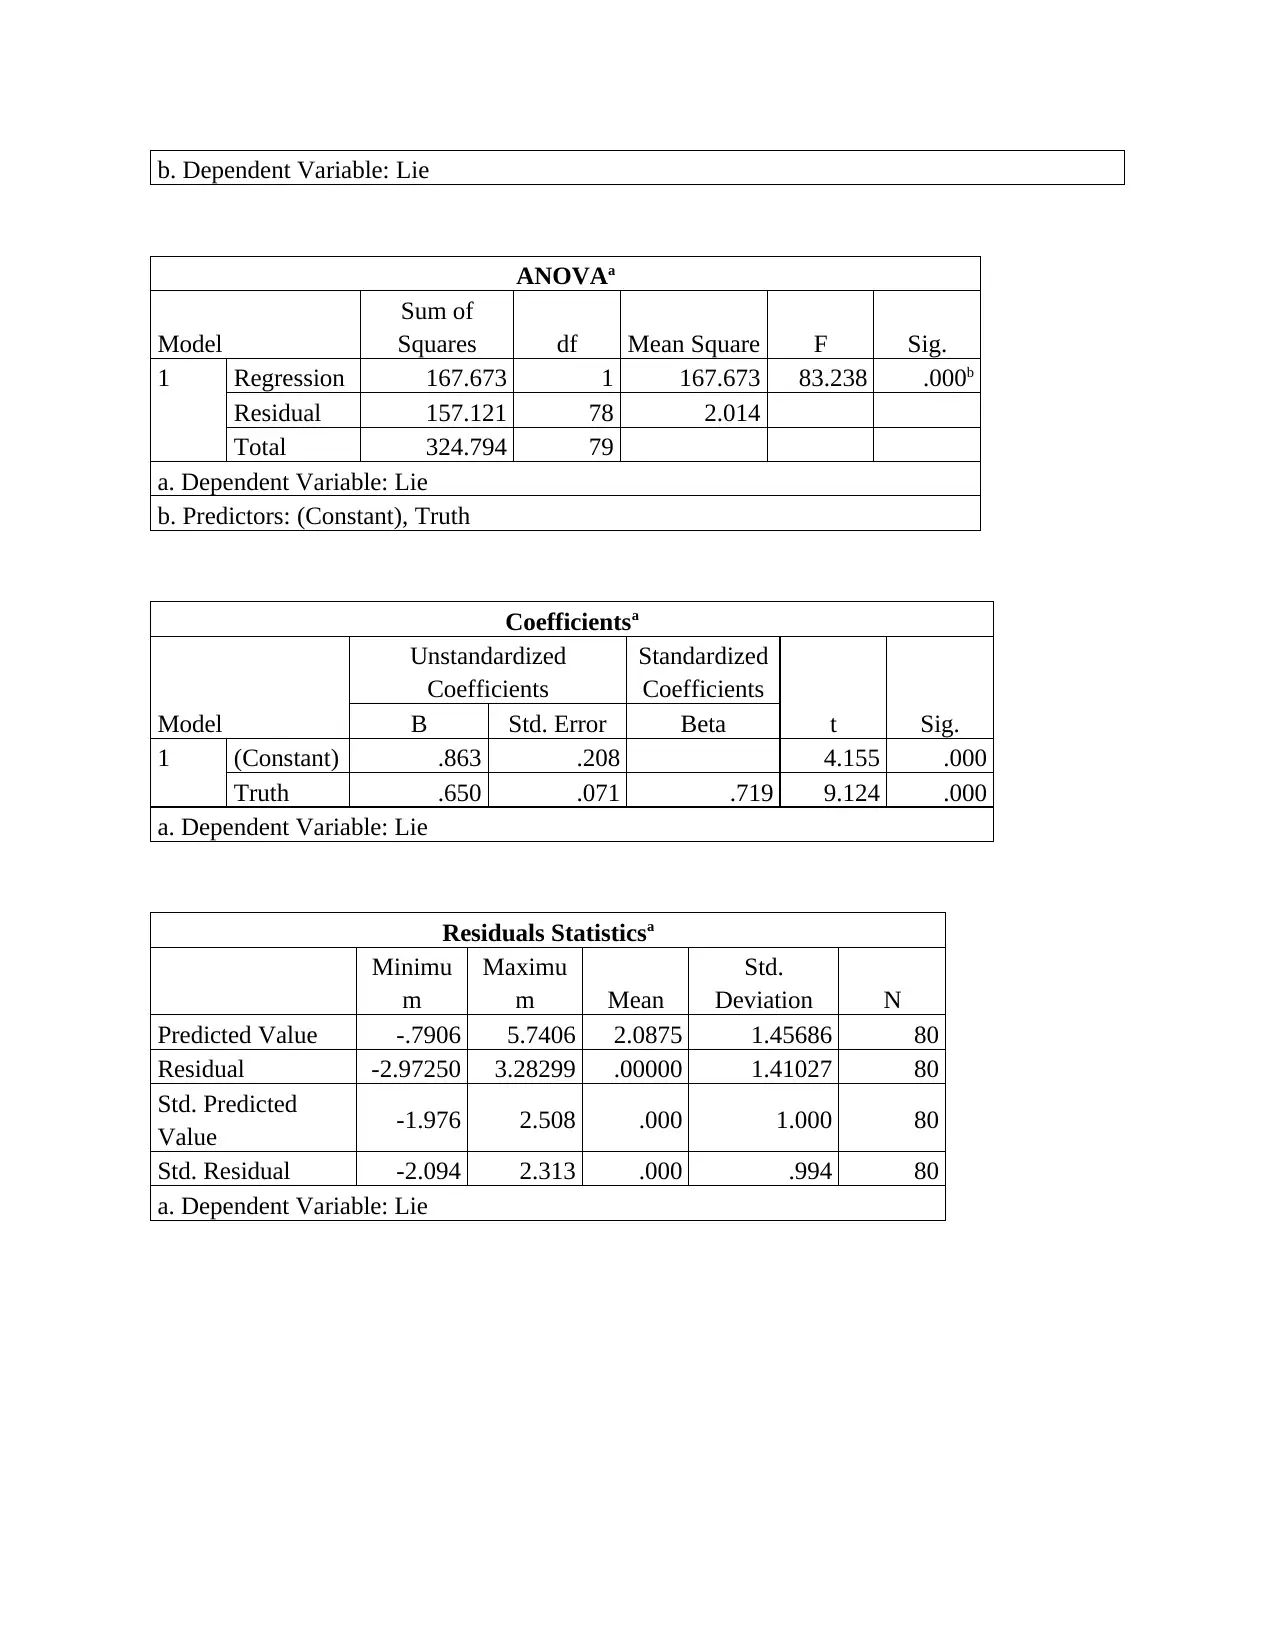
b. Dependent Variable: Lie
ANOVAa
Model
Sum of
Squares df Mean Square F Sig.
1 Regression 167.673 1 167.673 83.238 .000b
Residual 157.121 78 2.014
Total 324.794 79
a. Dependent Variable: Lie
b. Predictors: (Constant), Truth
Coefficientsa
Model
Unstandardized
Coefficients
Standardized
Coefficients
t Sig.B Std. Error Beta
1 (Constant) .863 .208 4.155 .000
Truth .650 .071 .719 9.124 .000
a. Dependent Variable: Lie
Residuals Statisticsa
Minimu
m
Maximu
m Mean
Std.
Deviation N
Predicted Value -.7906 5.7406 2.0875 1.45686 80
Residual -2.97250 3.28299 .00000 1.41027 80
Std. Predicted
Value -1.976 2.508 .000 1.000 80
Std. Residual -2.094 2.313 .000 .994 80
a. Dependent Variable: Lie
Paraphrase This Document
Need a fresh take? Get an instant paraphrase of this document with our AI Paraphraser
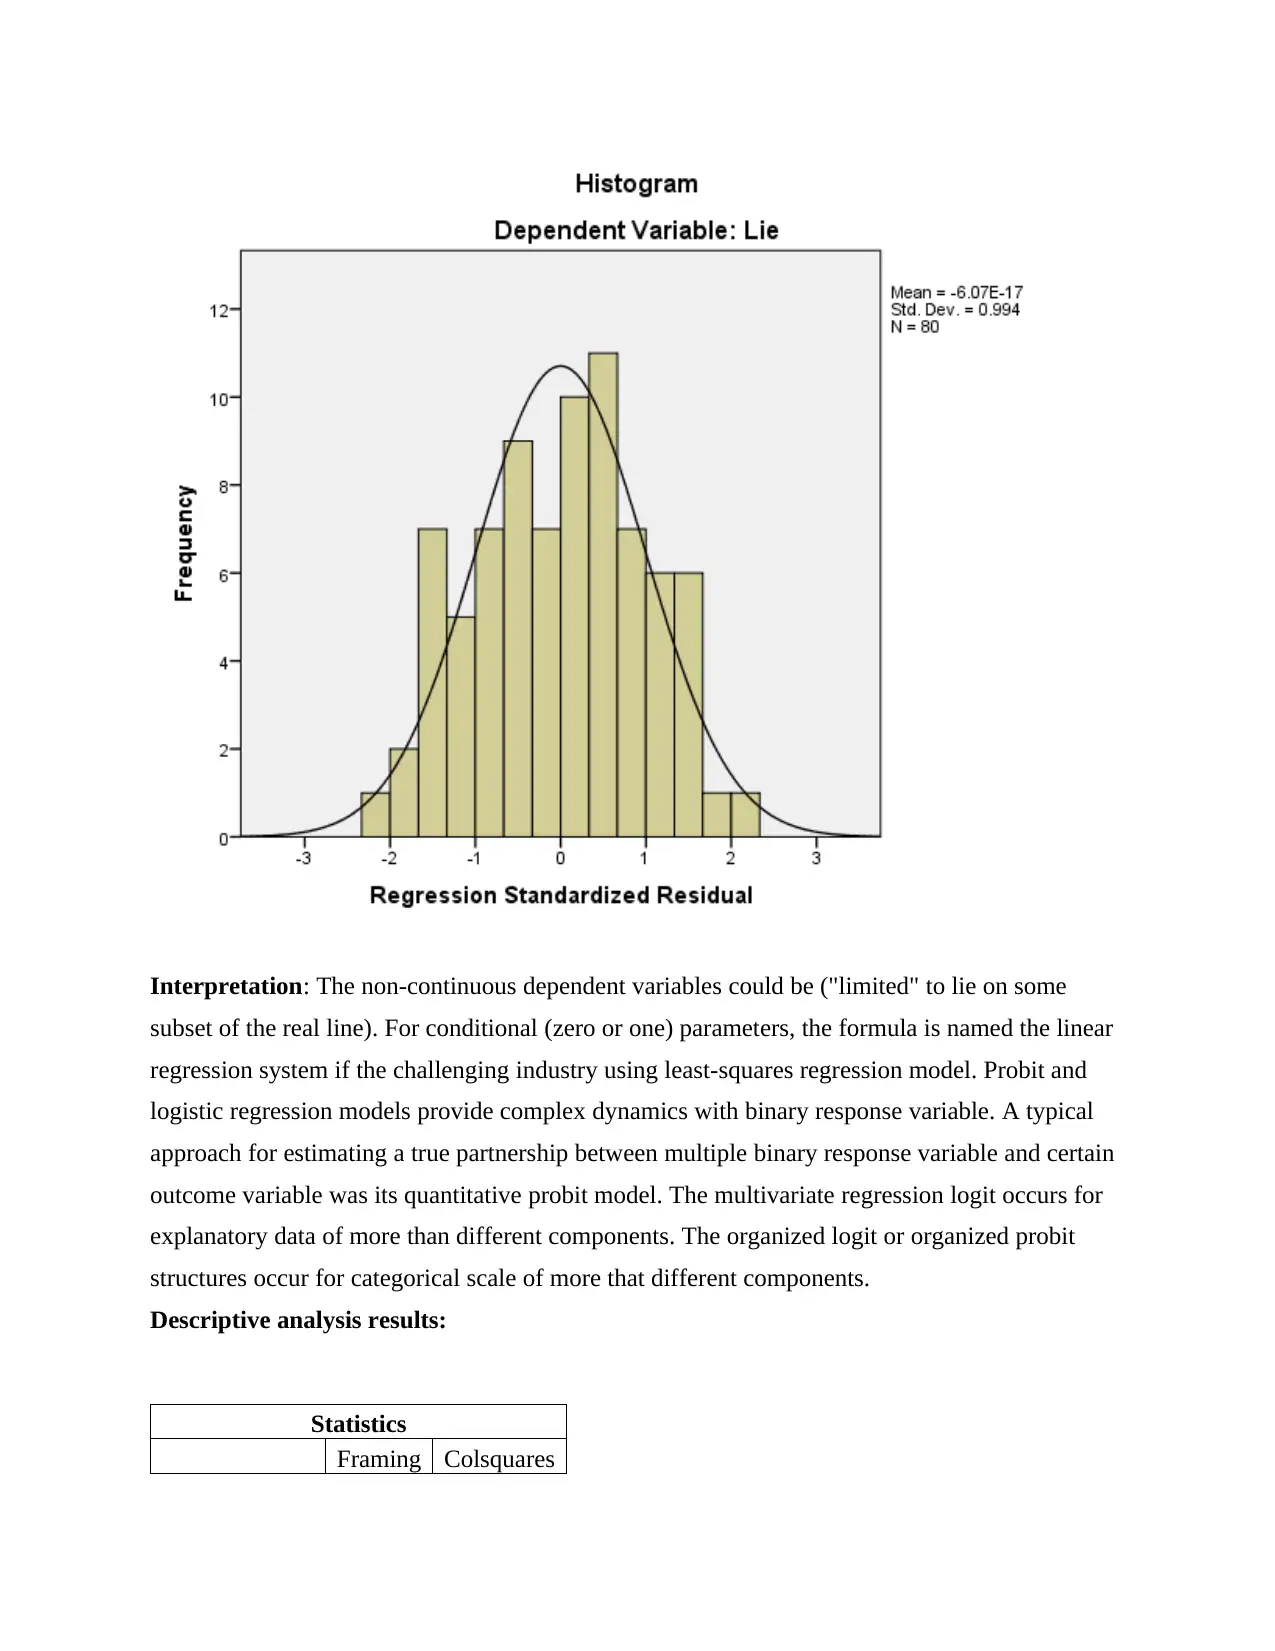
Interpretation: The non-continuous dependent variables could be ("limited" to lie on some
subset of the real line). For conditional (zero or one) parameters, the formula is named the linear
regression system if the challenging industry using least-squares regression model. Probit and
logistic regression models provide complex dynamics with binary response variable. A typical
approach for estimating a true partnership between multiple binary response variable and certain
outcome variable was its quantitative probit model. The multivariate regression logit occurs for
explanatory data of more than different components. The organized logit or organized probit
structures occur for categorical scale of more that different components.
Descriptive analysis results:
Statistics
Framing Colsquares
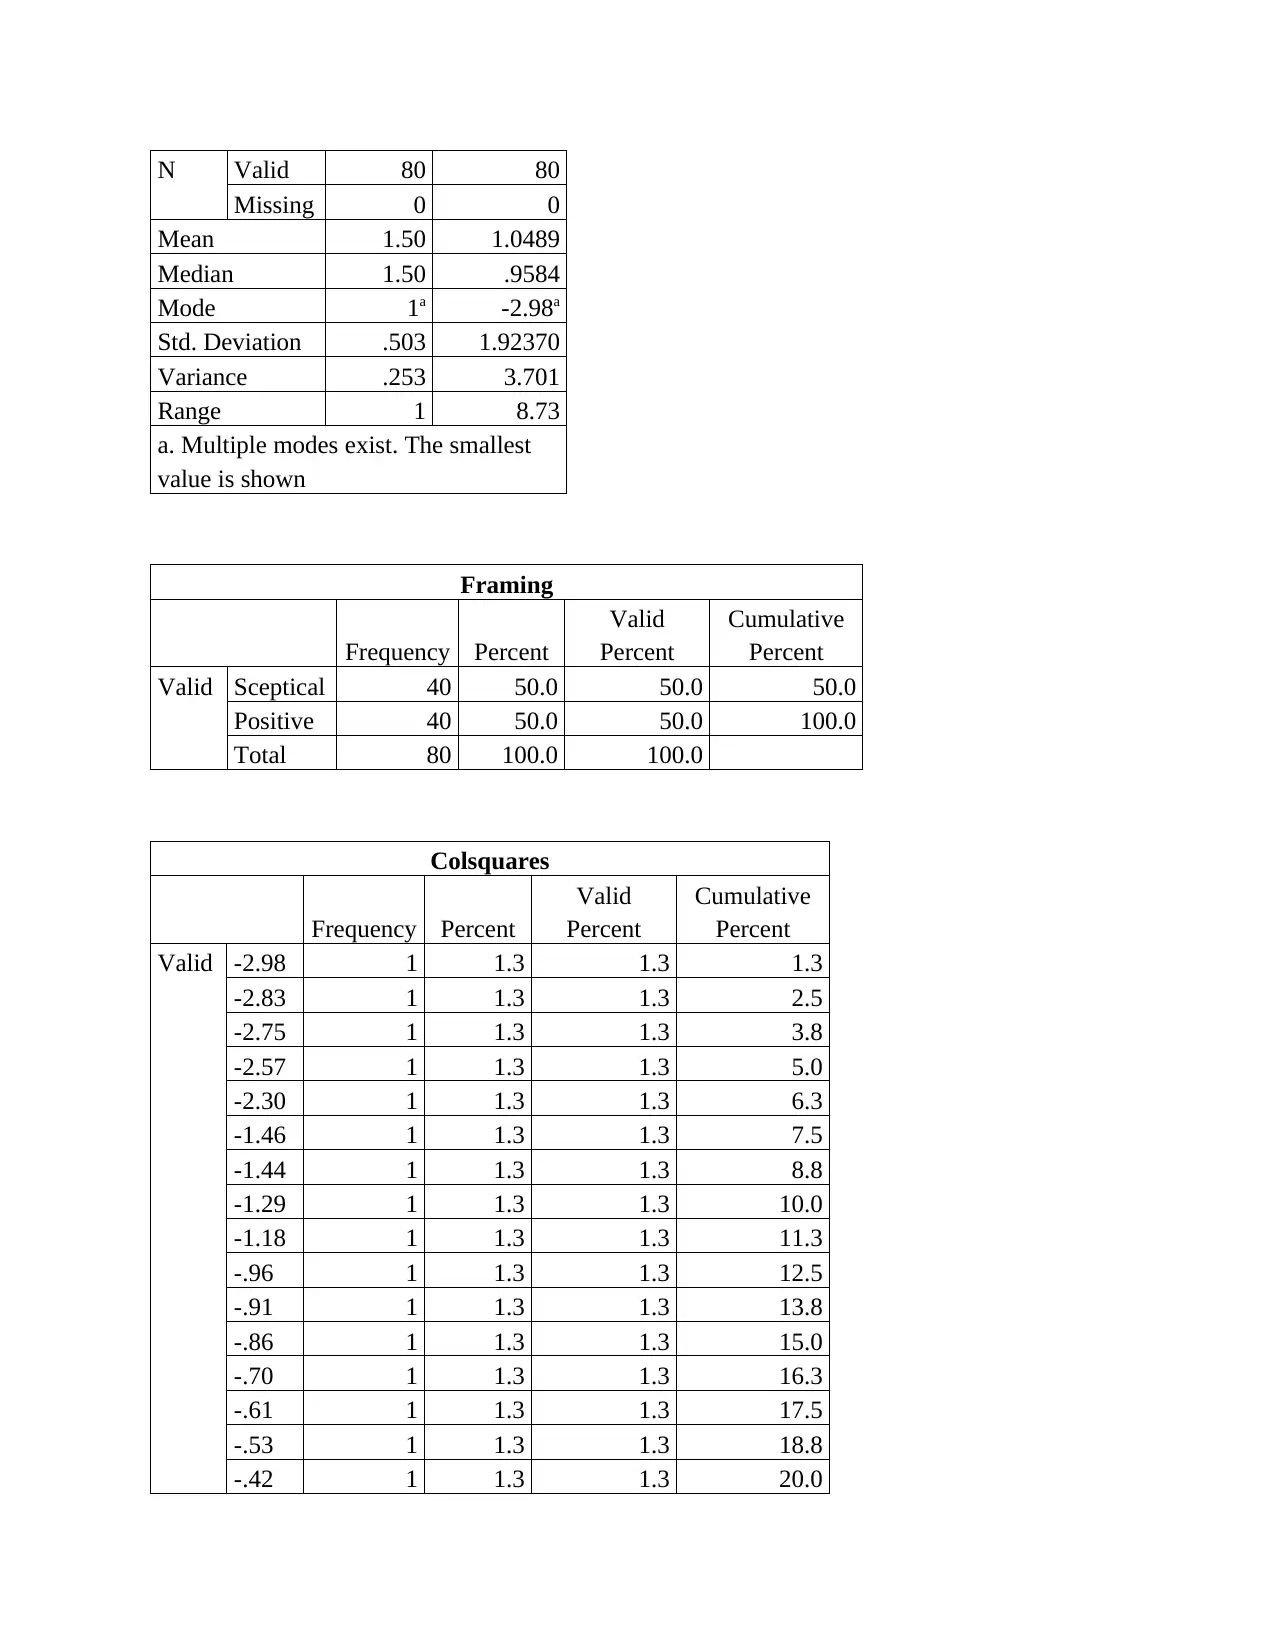
N Valid 80 80
Missing 0 0
Mean 1.50 1.0489
Median 1.50 .9584
Mode 1a -2.98a
Std. Deviation .503 1.92370
Variance .253 3.701
Range 1 8.73
a. Multiple modes exist. The smallest
value is shown
Framing
Frequency Percent
Valid
Percent
Cumulative
Percent
Valid Sceptical 40 50.0 50.0 50.0
Positive 40 50.0 50.0 100.0
Total 80 100.0 100.0
Colsquares
Frequency Percent
Valid
Percent
Cumulative
Percent
Valid -2.98 1 1.3 1.3 1.3
-2.83 1 1.3 1.3 2.5
-2.75 1 1.3 1.3 3.8
-2.57 1 1.3 1.3 5.0
-2.30 1 1.3 1.3 6.3
-1.46 1 1.3 1.3 7.5
-1.44 1 1.3 1.3 8.8
-1.29 1 1.3 1.3 10.0
-1.18 1 1.3 1.3 11.3
-.96 1 1.3 1.3 12.5
-.91 1 1.3 1.3 13.8
-.86 1 1.3 1.3 15.0
-.70 1 1.3 1.3 16.3
-.61 1 1.3 1.3 17.5
-.53 1 1.3 1.3 18.8
-.42 1 1.3 1.3 20.0
⊘ This is a preview!⊘
Do you want full access?
Subscribe today to unlock all pages.
Trusted by 1+ million students worldwide
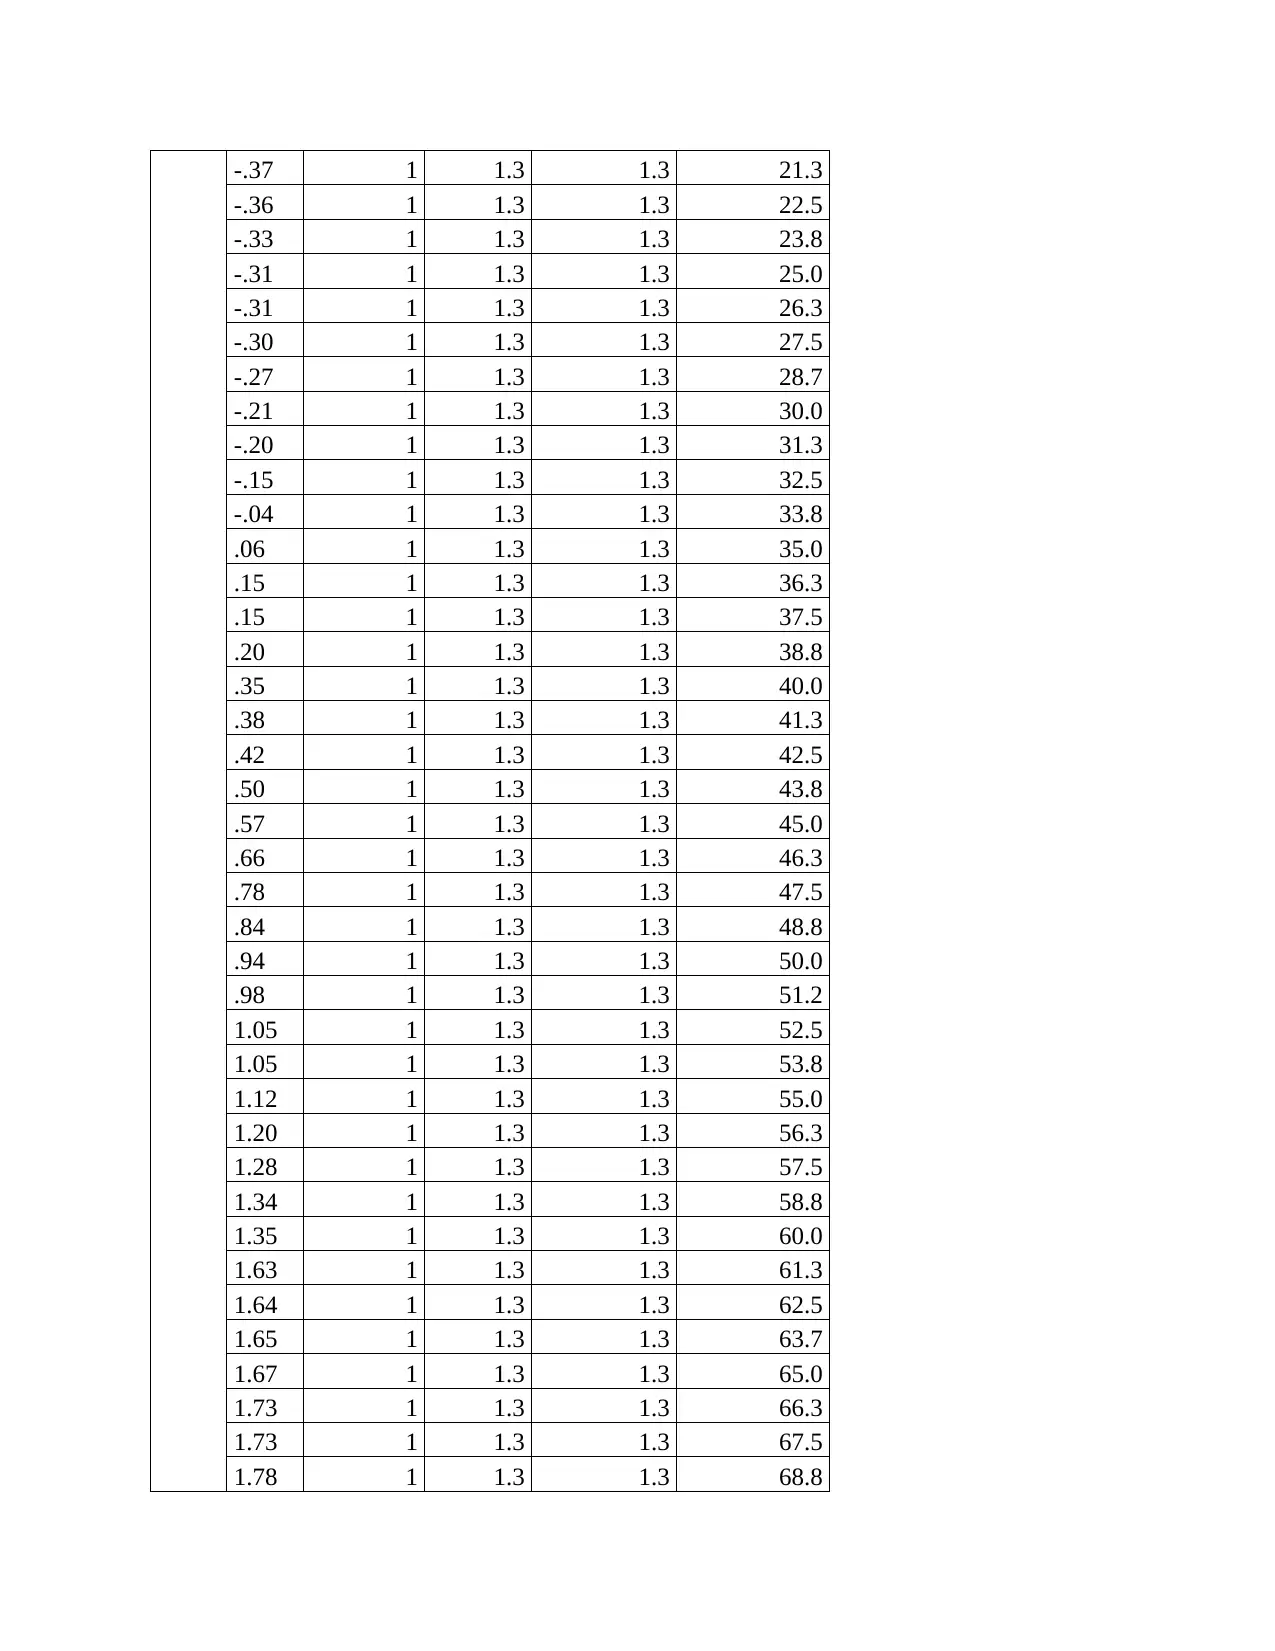
-.37 1 1.3 1.3 21.3
-.36 1 1.3 1.3 22.5
-.33 1 1.3 1.3 23.8
-.31 1 1.3 1.3 25.0
-.31 1 1.3 1.3 26.3
-.30 1 1.3 1.3 27.5
-.27 1 1.3 1.3 28.7
-.21 1 1.3 1.3 30.0
-.20 1 1.3 1.3 31.3
-.15 1 1.3 1.3 32.5
-.04 1 1.3 1.3 33.8
.06 1 1.3 1.3 35.0
.15 1 1.3 1.3 36.3
.15 1 1.3 1.3 37.5
.20 1 1.3 1.3 38.8
.35 1 1.3 1.3 40.0
.38 1 1.3 1.3 41.3
.42 1 1.3 1.3 42.5
.50 1 1.3 1.3 43.8
.57 1 1.3 1.3 45.0
.66 1 1.3 1.3 46.3
.78 1 1.3 1.3 47.5
.84 1 1.3 1.3 48.8
.94 1 1.3 1.3 50.0
.98 1 1.3 1.3 51.2
1.05 1 1.3 1.3 52.5
1.05 1 1.3 1.3 53.8
1.12 1 1.3 1.3 55.0
1.20 1 1.3 1.3 56.3
1.28 1 1.3 1.3 57.5
1.34 1 1.3 1.3 58.8
1.35 1 1.3 1.3 60.0
1.63 1 1.3 1.3 61.3
1.64 1 1.3 1.3 62.5
1.65 1 1.3 1.3 63.7
1.67 1 1.3 1.3 65.0
1.73 1 1.3 1.3 66.3
1.73 1 1.3 1.3 67.5
1.78 1 1.3 1.3 68.8
Paraphrase This Document
Need a fresh take? Get an instant paraphrase of this document with our AI Paraphraser
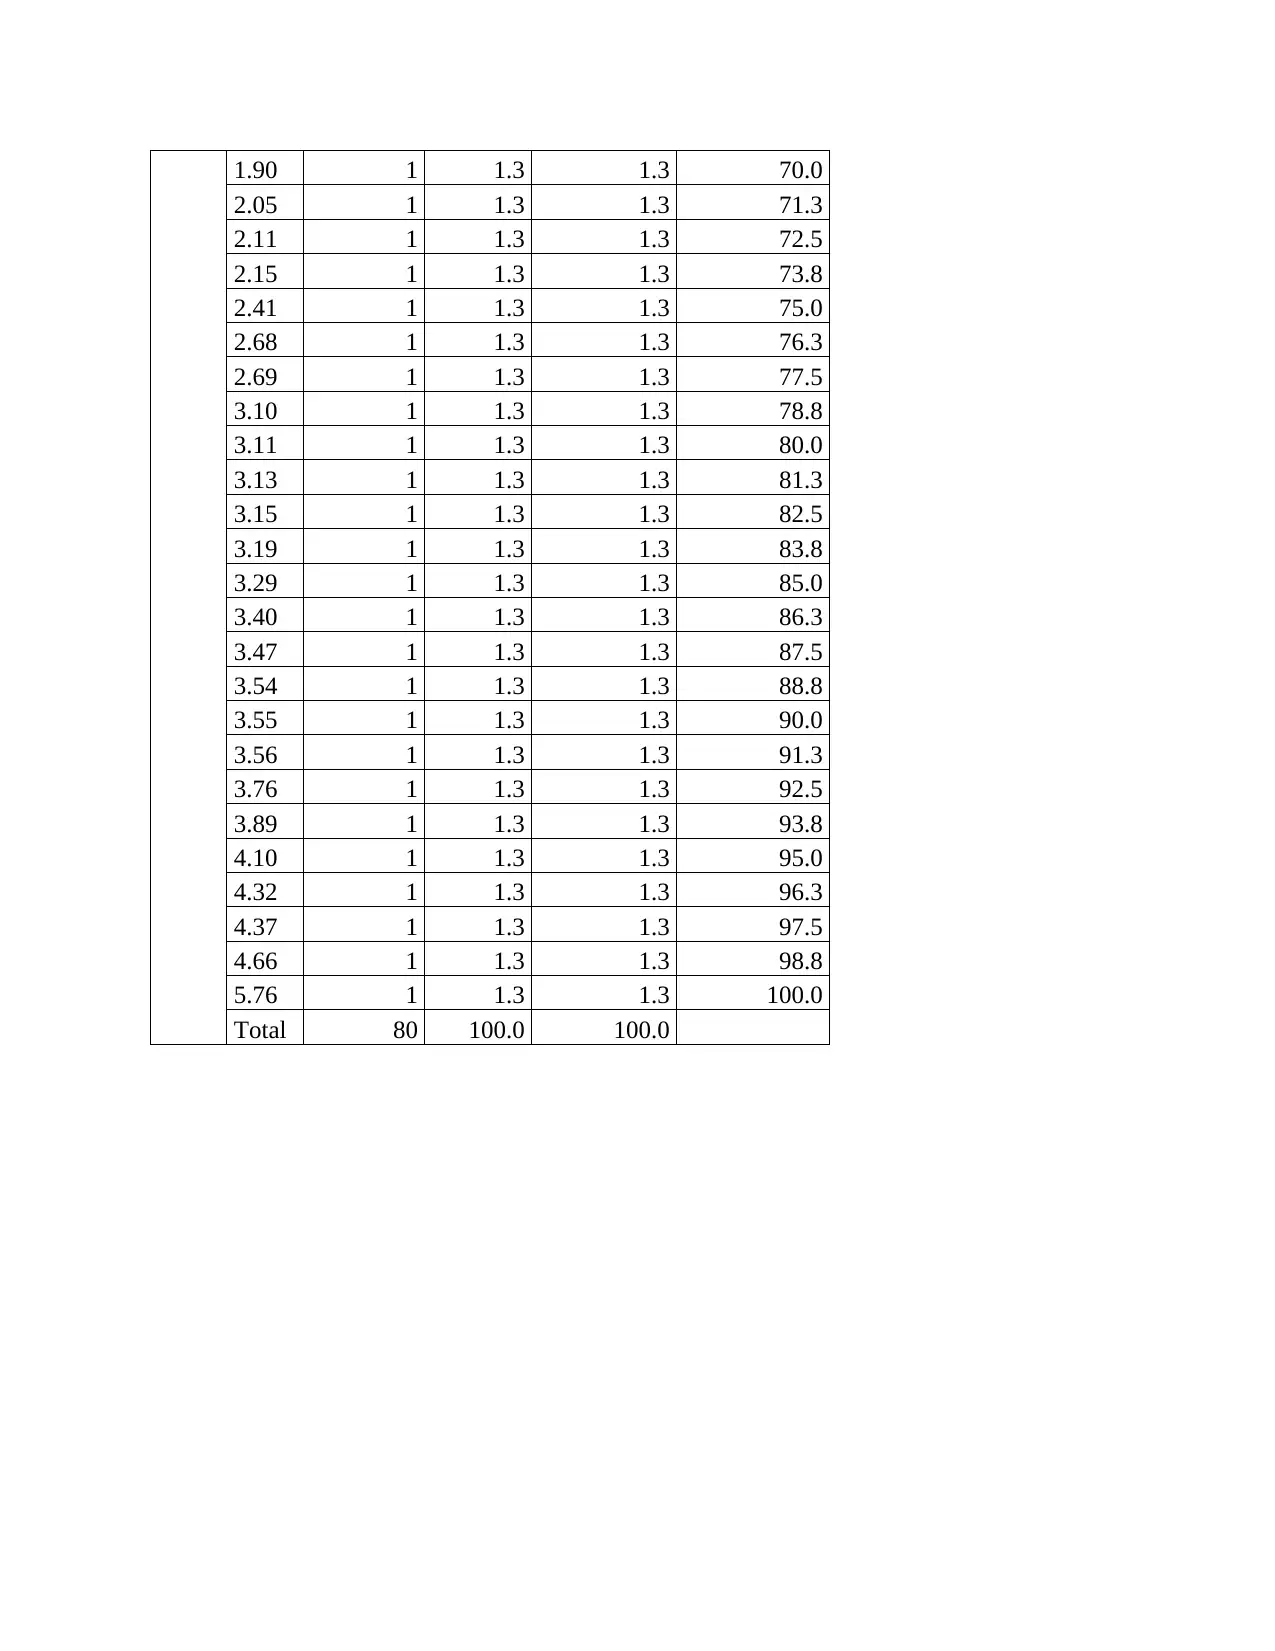
1.90 1 1.3 1.3 70.0
2.05 1 1.3 1.3 71.3
2.11 1 1.3 1.3 72.5
2.15 1 1.3 1.3 73.8
2.41 1 1.3 1.3 75.0
2.68 1 1.3 1.3 76.3
2.69 1 1.3 1.3 77.5
3.10 1 1.3 1.3 78.8
3.11 1 1.3 1.3 80.0
3.13 1 1.3 1.3 81.3
3.15 1 1.3 1.3 82.5
3.19 1 1.3 1.3 83.8
3.29 1 1.3 1.3 85.0
3.40 1 1.3 1.3 86.3
3.47 1 1.3 1.3 87.5
3.54 1 1.3 1.3 88.8
3.55 1 1.3 1.3 90.0
3.56 1 1.3 1.3 91.3
3.76 1 1.3 1.3 92.5
3.89 1 1.3 1.3 93.8
4.10 1 1.3 1.3 95.0
4.32 1 1.3 1.3 96.3
4.37 1 1.3 1.3 97.5
4.66 1 1.3 1.3 98.8
5.76 1 1.3 1.3 100.0
Total 80 100.0 100.0
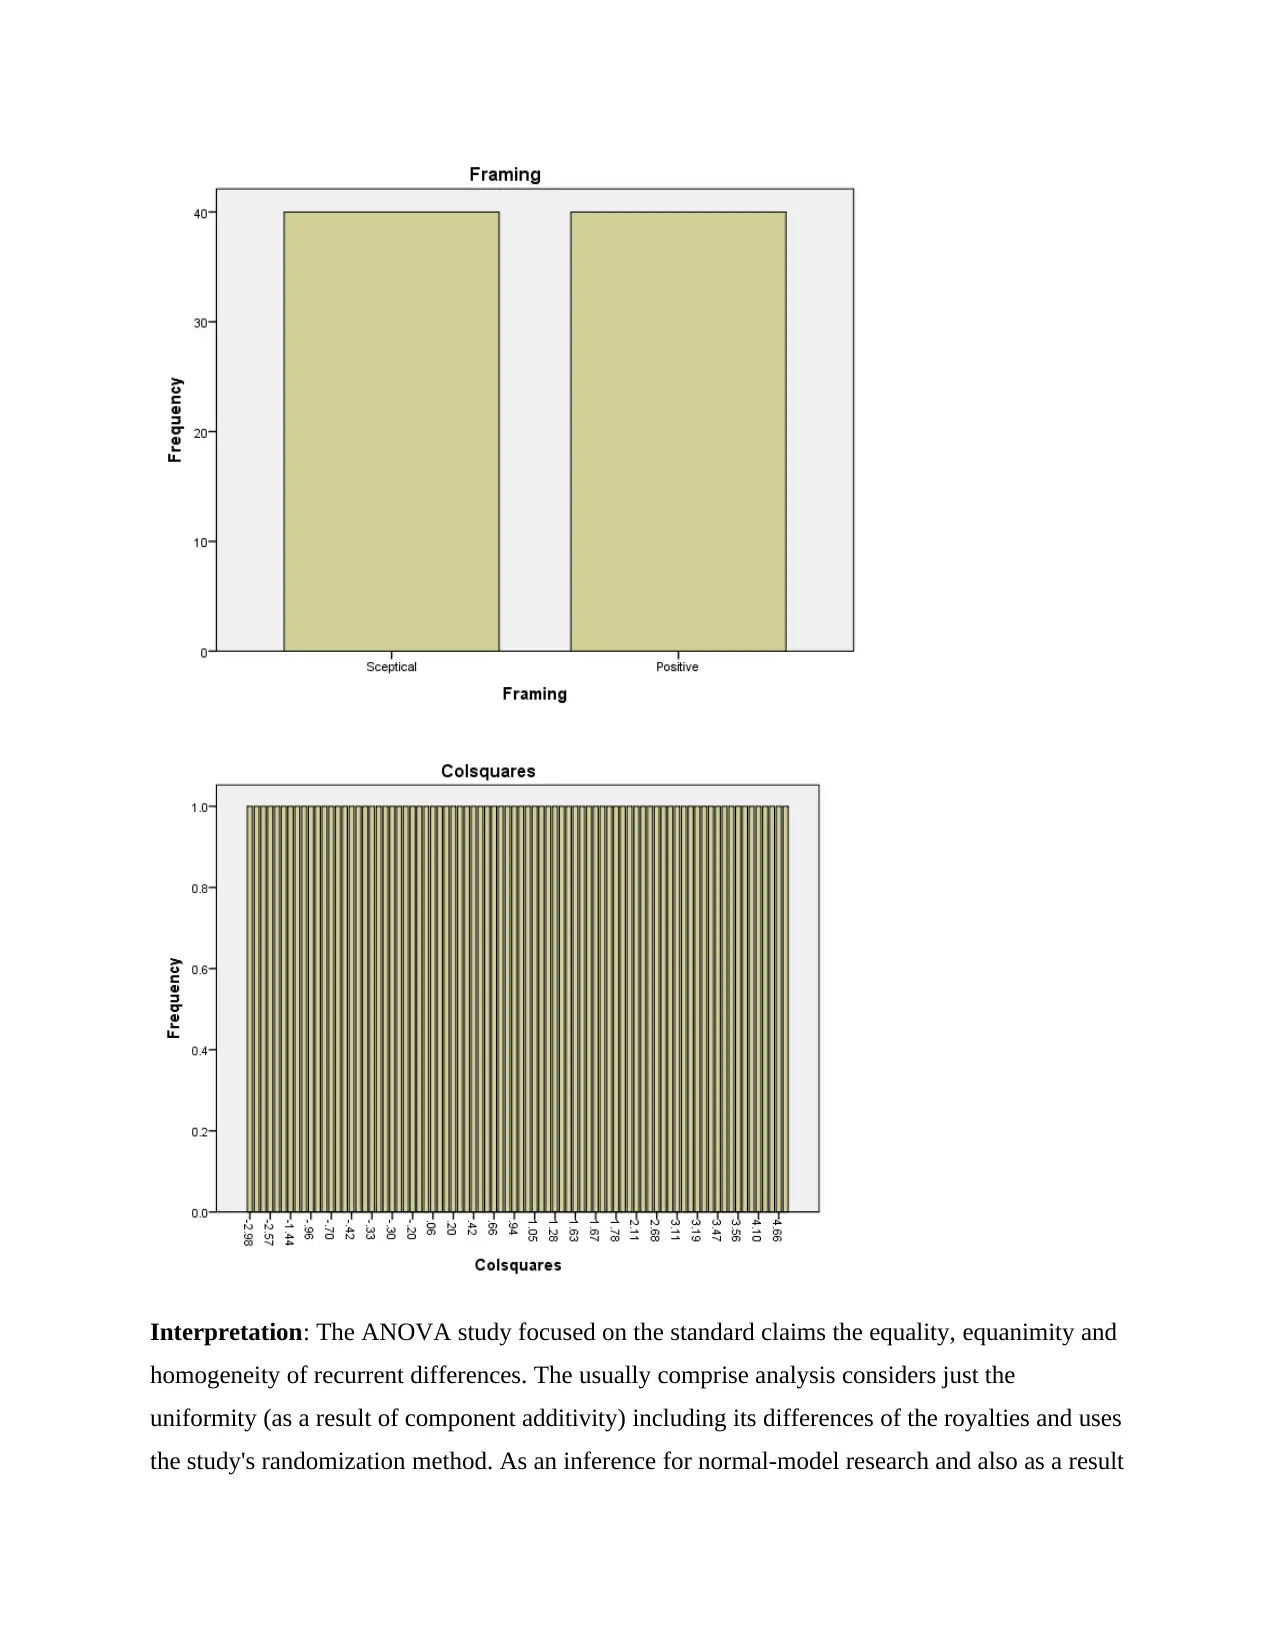
Interpretation: The ANOVA study focused on the standard claims the equality, equanimity and
homogeneity of recurrent differences. The usually comprise analysis considers just the
uniformity (as a result of component additivity) including its differences of the royalties and uses
the study's randomization method. As an inference for normal-model research and also as a result
homogeneity of recurrent differences. The usually comprise analysis considers just the
uniformity (as a result of component additivity) including its differences of the royalties and uses
the study's randomization method. As an inference for normal-model research and also as a result
⊘ This is a preview!⊘
Do you want full access?
Subscribe today to unlock all pages.
Trusted by 1+ million students worldwide
1 out of 14

Your All-in-One AI-Powered Toolkit for Academic Success.
+13062052269
info@desklib.com
Available 24*7 on WhatsApp / Email
![[object Object]](/_next/static/media/star-bottom.7253800d.svg)
Unlock your academic potential
Copyright © 2020–2026 A2Z Services. All Rights Reserved. Developed and managed by ZUCOL.