Psychology: Introduction to Research Methods Assignment Solutions

Verified

Added on  2020/02/03

|23
|2246
|104
Homework Assignment
AI Summary
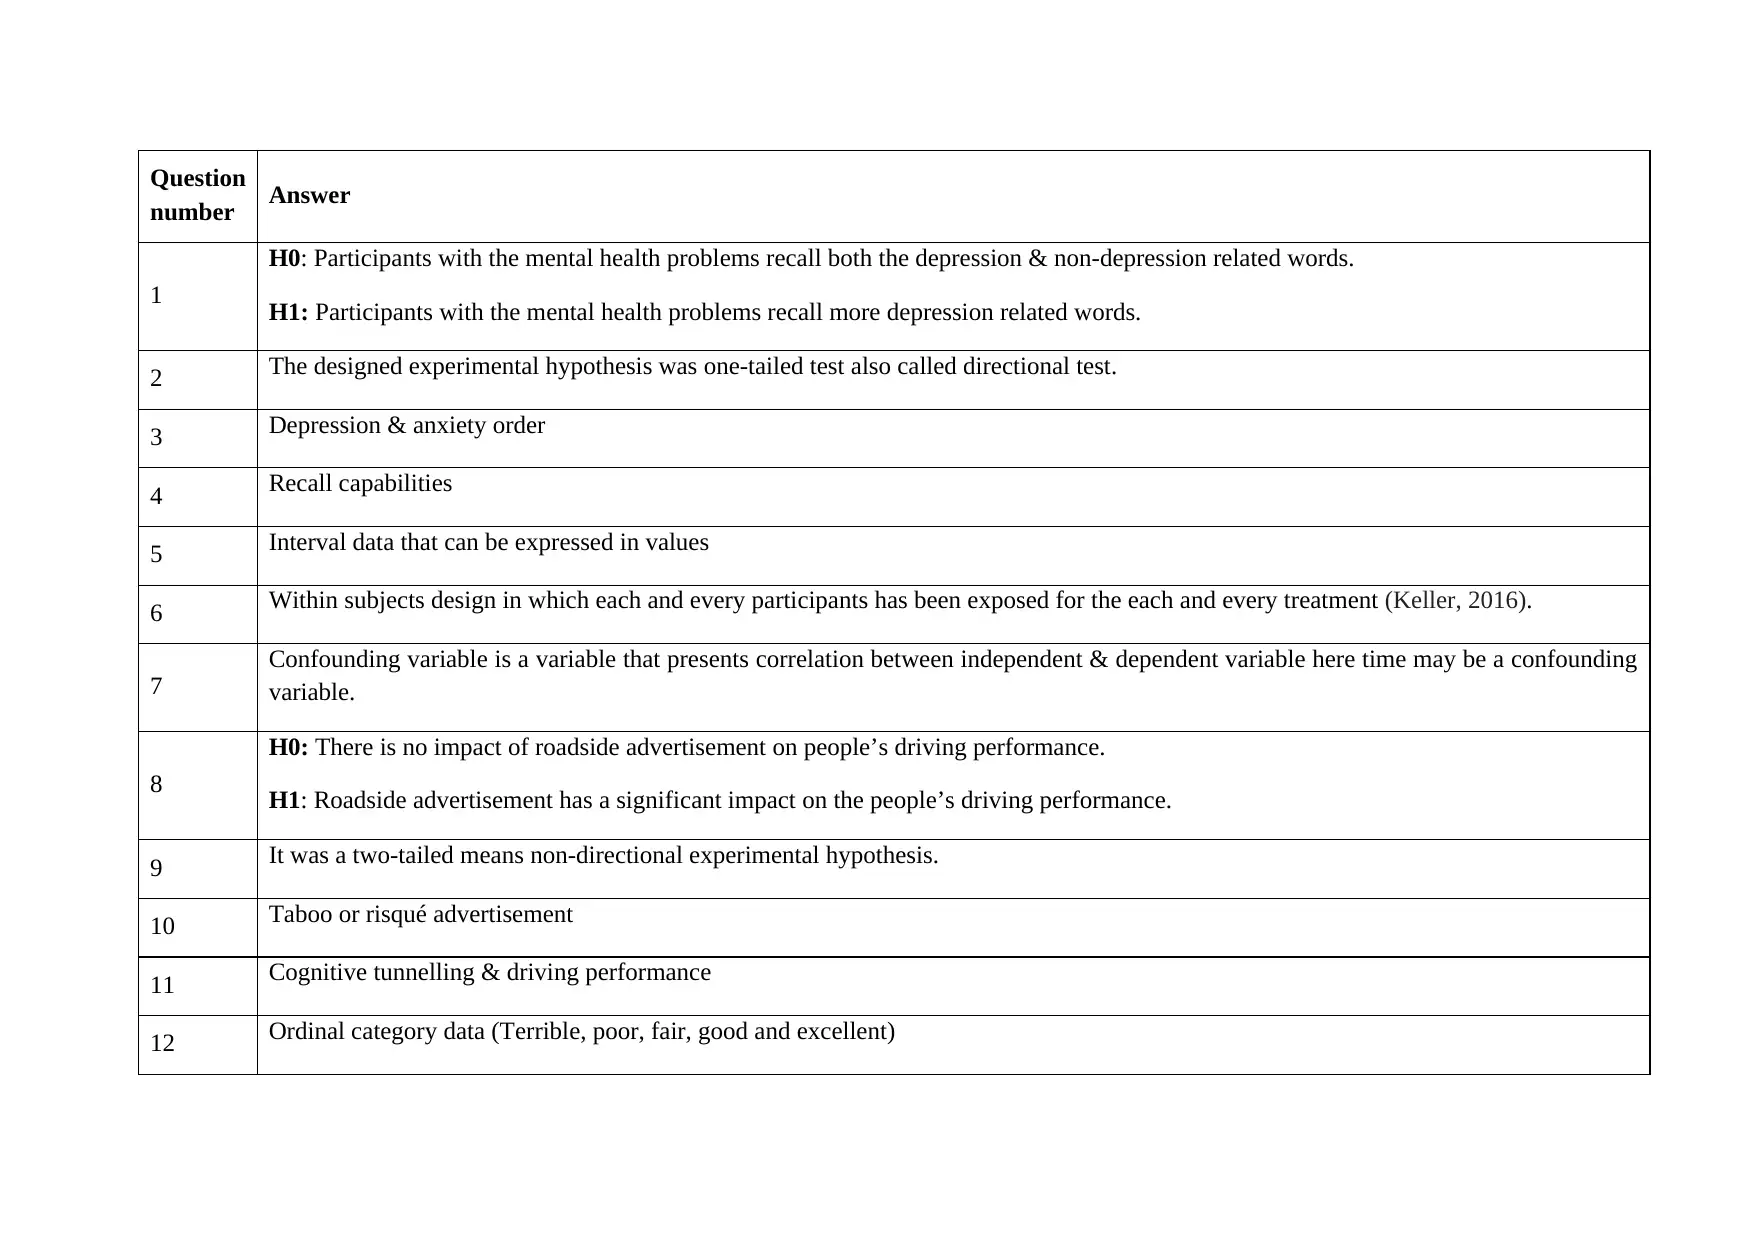
This document presents solutions to a research methods assignment in psychology, addressing a range of research questions and statistical analyses. The assignment covers topics such as hypothesis formulation, including null and alternative hypotheses, and the application of various statistical tests like t-tests, ANOVA, regression, and correlation analysis. It explores different experimental designs, including within-subjects and between-groups designs, and discusses the interpretation of statistical results, including descriptive statistics, frequency analysis, and the use of histograms and box plots. The solutions also involve identifying confounding variables, interpreting statistical output, and drawing conclusions based on the results of different statistical tests. The assignment covers a wide range of research scenarios, including studies on mental health, advertising, driving performance, mindfulness, pain perception, brain training, bullying, and the impact of video games on reaction time, demonstrating a strong understanding of research methodology.
tabler-icon-diamond-filled.svg

Contribute Materials

Your contribution can guide someone’s learning journey. Share your documents today.
Document Page
Introduction to Research Methods
tabler-icon-diamond-filled.svg

Secure Best Marks with AI Grader

Need help grading? Try our AI Grader for instant feedback on your assignments.
Document Page
Question
number Answer
1
H0: Participants with the mental health problems recall both the depression & non-depression related words.
H1: Participants with the mental health problems recall more depression related words.
2 The designed experimental hypothesis was one-tailed test also called directional test.
3 Depression & anxiety order
4 Recall capabilities
5 Interval data that can be expressed in values
6 Within subjects design in which each and every participants has been exposed for the each and every treatment (Keller, 2016).
7
Confounding variable is a variable that presents correlation between independent & dependent variable here time may be a confounding
variable.
8
H0: There is no impact of roadside advertisement on people’s driving performance.
H1: Roadside advertisement has a significant impact on the people’s driving performance.
9 It was a two-tailed means non-directional experimental hypothesis.
10 Taboo or risqué advertisement
11 Cognitive tunnelling & driving performance
12 Ordinal category data (Terrible, poor, fair, good and excellent)
Document Page
13
The experiment applied between group design, also called independent design because there were two different groups, one is neutral
word and emotionally charged taboo swear words.
14
Time devoted to look the advertisement may be an confounding variable because higher the time devoted to the advertisement maximize
the chance of impairing driving performance or vice-versa (Aczel & Sounderpandian, 2002).
15 Descriptive statistics: This statistical tool assists business analysts to summarize the big or huge quantum of data set into meaningful
information by presenting key summary statistics. It is broadly classified into two that are central tendency measures and measurement
of dispersion (Black & et.al., 2013). In this, central tendency measures comprises mean, mode and median, wherein mean represents
average, mode indicates value that has greatest frequency whilst median presents the value that is equal to 50% and divide the series into
two parts. However, dispersion measures the spread of each and every value from the average value measured by range, variance &
standard deviation.
Document Page
tabler-icon-diamond-filled.svg

Secure Best Marks with AI Grader

Need help grading? Try our AI Grader for instant feedback on your assignments.
Document Page
(ii)
Document Page
16 Interpretations: From the results derived above, it can be seen that mindfulness intervention group has founded highest mean age of
57.73 at a confidence interval of 53.42 and 62.03. However, other groups, people with no treatment, cognitive behavioural therapy and
anti-depressant medication have founded a mean age of 56.09, 50.18 & 31.18 years. Thus, from the results, it is clear that average age of
the people from the 4th group is founded lowest. However, on the other side, range is reported highest for the CBT group to 49 in
comparison to the 1st, 3rd and 4th group, which had reported a range of 21, 24 & 24 respectively. It showcase that CBT Group’s
participants age highly differ or spreaded (Aad & et.al., 2014). Although range is the simplest technique still, it cannot be considered as
the best technique for the dispersion measurement whilst standard deviation provides true results. Descriptive statistics results founded
highest value of standard deviation for the participants with the CBT applied to 16.510 which demonstrates that age group of each &
every participants involved in this group is scattered from the average age of 50.18 years (Siegel, 2016). In contrast, other groups
reported lower spreaders because their standard deviation has been measured at 6.395, 6.405 & 7.744 respectively.
Document Page
Interpretations: Looking to the frequency results, it can be seen that in the group under no treatment (controlled condition), 9 (81.8%)
and 2(18.2%) female participants has been involved in the investigation. However, participants with CBT, Mindfulness intervention &
anti-depressant medication involved male to 2(18.2%), 3(27.3%) and 3(27.3%) whereas female participants were founded to 9(81.8%),
8(72.7%) and 8(72.7%) respectively .
17 Histogram:
tabler-icon-diamond-filled.svg

Paraphrase This Document

Need a fresh take? Get an instant paraphrase of this document with our AI Paraphraser
Document Page
Interpretation; The above histogram reflects that data set regarding male participant visualized normal distribution whilst for female, it
is founded skewed.
Document Page
18
Document Page
tabler-icon-diamond-filled.svg

Secure Best Marks with AI Grader

Need help grading? Try our AI Grader for instant feedback on your assignments.
Document Page
Interpretation: Above results presents that for the male participants, sig value under both the K-S and S-W test is founded to 0.200 and
0.761 above 0.05 which clearly presents that data has been drawn from the normally distribution population. However, for the female,
the values were reported to 0.044 and 0.002 below 0.05 indicates that it is not normally distributed.
19 Two box plots for the male and female
Document Page
Figure 1 Box plot for the male
Document Page
Figure 2 Box plot for the female
tabler-icon-diamond-filled.svg

Paraphrase This Document

Need a fresh take? Get an instant paraphrase of this document with our AI Paraphraser
Document Page
20
Document Page
Interpretations: From the results, it can be seen that under the group 1, average pain rating is reported to 5 thus, it can be stated
that they feel a tolerable pain. Moreover, its standard deviation is 2.17 which is not very high indicates low dispersion. In contrast, for
the female, mean ranking was given to 2 means they experienced a little bit chronic pain at a standard deviation of 2.13. At 95% CI,
lower and upper bound for both the groups are founded to 4.0525 to 6.1175 and 1.1511 to 3.1489 respectively. Further, normality graph
on QQ plot reported that for the male participants, all the circles lies near the line shows normal distribution whilst for female there are
Document Page
outliers exists indicates data are not normally distributed.
21 Independent sample T-test
Interpretations: From the outcome of the group statistics, it is clear that out of 100 people studied, equal number of people was
from controlled and experiment group to 50 at a standard deviation of 1.97990 and 1.64441. However, mean improvement in their IQ
was reported greater for the placebo group to 6.72 whilst for the neutral group, it is reported lower to 1.6441. However, as per the
independent sample Test results, the outcome showcase that sig value is founded to 0.000 at an equal mean difference of 4.82 and
standard error difference of 0.36398 (Ross and et.al., 2016). The sig value is below the acceptable limit of 0.05 which accepts the
tabler-icon-diamond-filled.svg

Secure Best Marks with AI Grader

Need help grading? Try our AI Grader for instant feedback on your assignments.
Document Page
alternative hypothesis and stats that there is significant difference between IQ score of the people with brain training activities and
neutral group. Thus, it can be interpreted that brain training activities plays a significant role in improving intelligence of the
participants.
Descriptive statistics:
Document Page
Interpretation: The results showed above presents a mean score of 6.72 for the placebo group which is comparatively higher than
the mean IQ score for the neutral participants to 1.90. However, standard deviation of both the groups was not very high as the results
Document Page
revals the value of 1.97 and 1.64.
22
From the results of the test applied, it can be concluded that brain training activities really helpful for the people to maximize their
intelligence upward as the data spotted that people with the placebo effects reported high average IQ score in comparison to the people
under neutral group (Black & et.al., 2013). Moreover, the application of the t-test showcase that there is significant difference exists
between the IQ scores of the people with the placebo and neutral. It means that people who undertook the training sessions are more
intelligent than the other group participants.
23
H0: People with the bullying experiences are no more or less likely to take highest uptake of health harming behaviours.
H1: People with the bullying experiences are more likely to take highest uptake of health harming behaviours
24 One-tailed (Directional) experiment
25 Bullying and victimisation
26 Health harming behaviours i.e. smoking, illicit substance usage and others
27 Ordinal category data
28 Between groups because there was controlled and experimental groups involved in the study.
29
Harassment or bullying experiences or frequency is a cofounding variable because people harassed majority of the times raise the risk of
victims or health harming behaviour
30 Interpretation: From the findings of the ANOVA table, it is visualized that mean score of the control, bully-group, victim-group and
bully victim group were founded to 2.30, 8.70, 14.60 and 14.70 respectively. However, as per the ANOVA table, the results reflects that
sig value is founded to 0.000 which is below 0.05 thus, indicates that bully victims have a significant impact on the of the highest uptake
of health harming behaviours like smoking, illicit substance usage, alcoholic habit and in the adulthood. Thus, by this way, alternative
hypothesis proven true and null hypothesis rejected (Lai, Zhu & Williams, 2017). However, the CI at 95% for each group is founded to
tabler-icon-diamond-filled.svg

Paraphrase This Document

Need a fresh take? Get an instant paraphrase of this document with our AI Paraphraser
Document Page
0.91 to 3.69, 7.48 to 9.92, 13.16 to 16.04 and 13.08 to 16.32 respectively.
31
As per the hypothesis testing rule, sig value is below the acceptable value of 0.05 which indicates that bullying and victims experience
have a significant impact on the highest uptake of health harming behaviours like smoking, illicit substance usage, alcoholic habit in the
adulthood. Thus, by this way, alternative hypothesis proven true and null hypothesis rejected.
32
H0; There is no relationship exists between the amount of time and reaction time.
H1: There is significant level of relationship exists between the amount of time and reaction time.
33 Two-tailed (Non-directional)
34 Scatter plot
Document Page
Figure 3 Scatter plot with the time playing video games and reaction time scores
Document Page
35 Here the current statistical figure that is time spent and response time are the interval/ratio variables therefore, spearman’s ranking test
is founded suitable for examining the correlation, so as to examine the strength & direction of the relationship between two correlated
variables. It is considered suitable for testing the relationship between the reaction time and time to play video games because it is a non-
parametric measure.
Interpretations: From the outcome, it seems clear that spearman’s correlation test founded that there is high level of negative
correlation exists between the time devoted by the people in playing video games and their reaction time because, the r value is founded
to -0.773 which is above 0.75 (Newbold, Carlson & Thorne, 2012). It showcase their higher the time devoted in video games players
results in declining the reaction time or vice-versa.
Regression test
tabler-icon-diamond-filled.svg

Secure Best Marks with AI Grader

Need help grading? Try our AI Grader for instant feedback on your assignments.
Document Page
36
From the results, it can be concluded that sig value of 0.05 is below the alpha of 0.05 hence, there is no proper evidence available to
support null hypothesis and thereby alternative hypothesis accepting presenting that there is significant level of relationship exists
between the time to play video games and their reaction time (Lai, Zhu & Williams, 2017). Here, with the stated scenario, alternative
hypothesis has been accepted because exceeding the time devoted by the people in video games playing results in declining the
reaction time hence negative correlation has been founded.
37 One possible alternative explanation is that people who devoted less time in playing video games were reaction time is faster in
comparison to those who put a lot of time in playing video games.
chevron_up_icon
1 out of 23
circle_padding
hide_on_mobile
zoom_out_icon
logo.png

Your All-in-One AI-Powered Toolkit for Academic Success.

Available 24*7 on WhatsApp / Email

[object Object]