Analysis and Correction of Errors in a Psychology Research Report
VerifiedAdded on 2020/06/04
|10
|2133
|52
Report
AI Summary
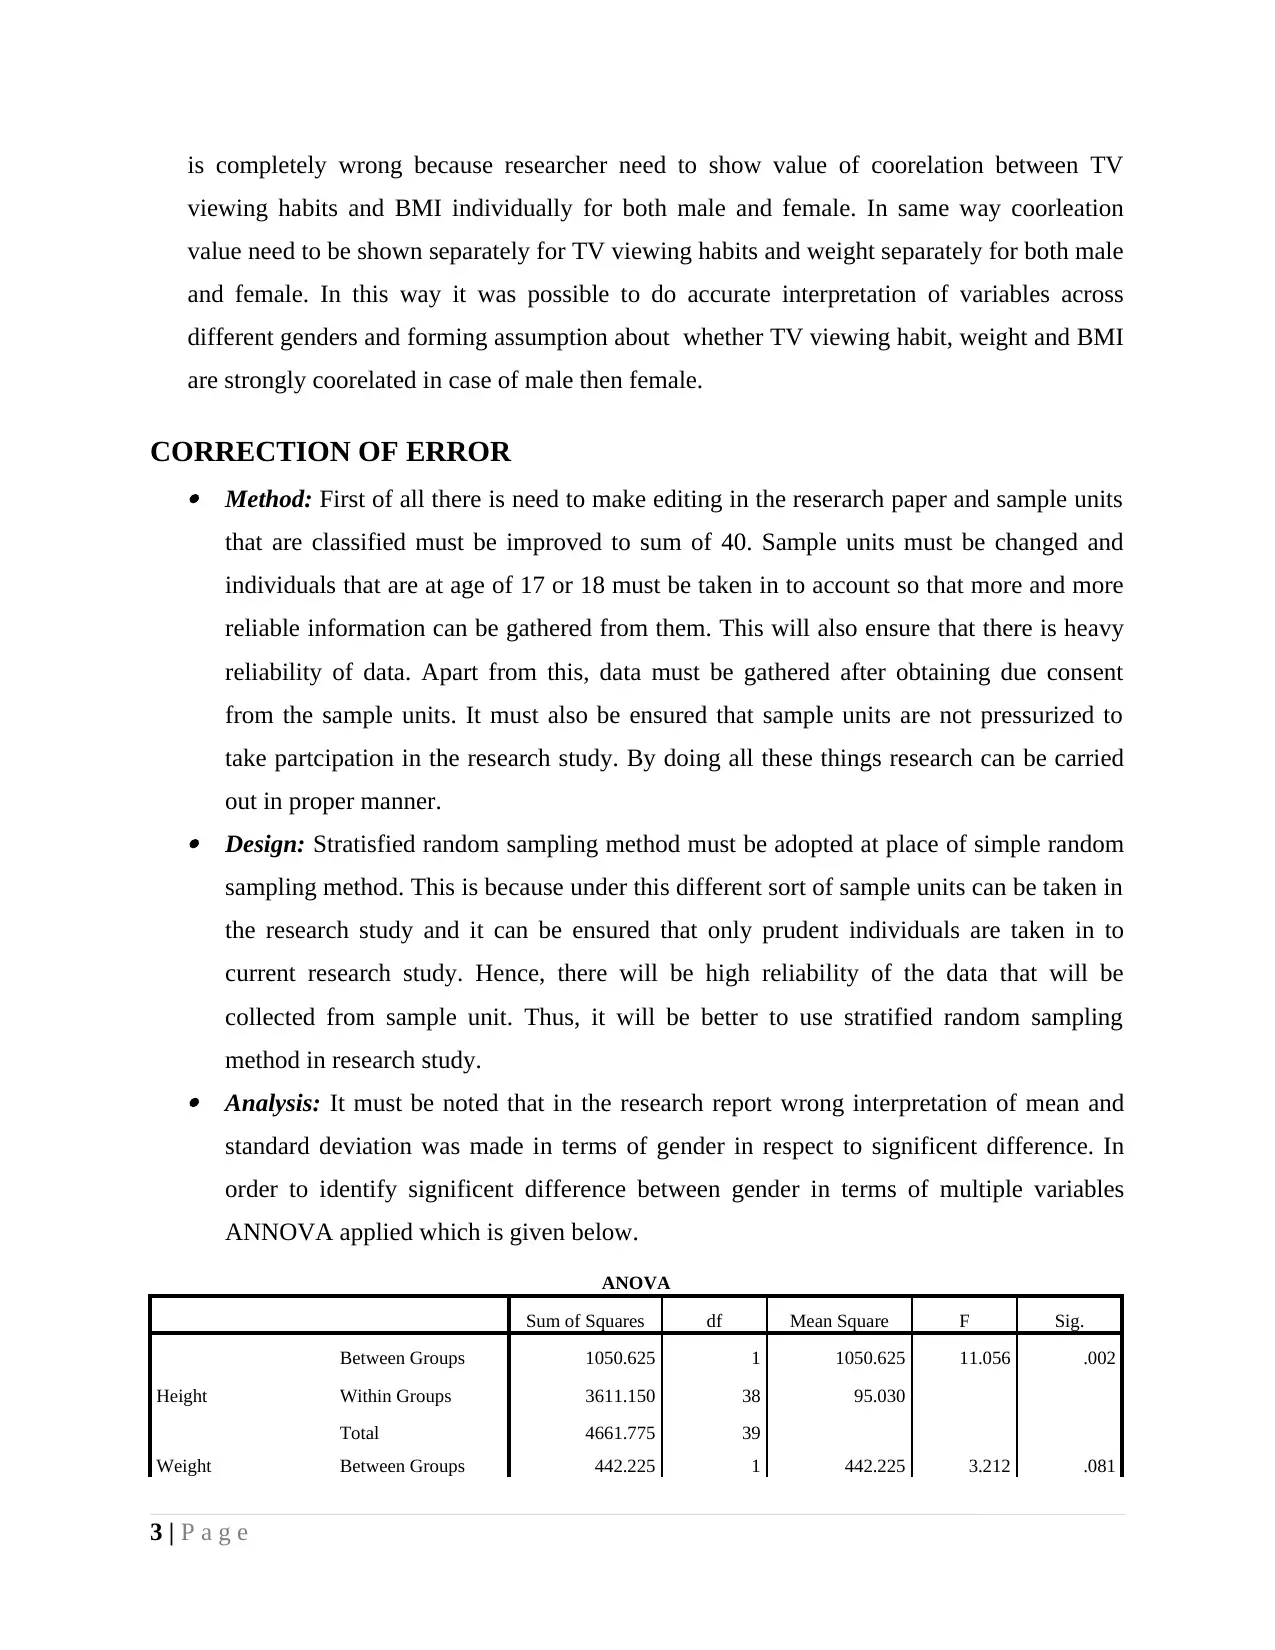
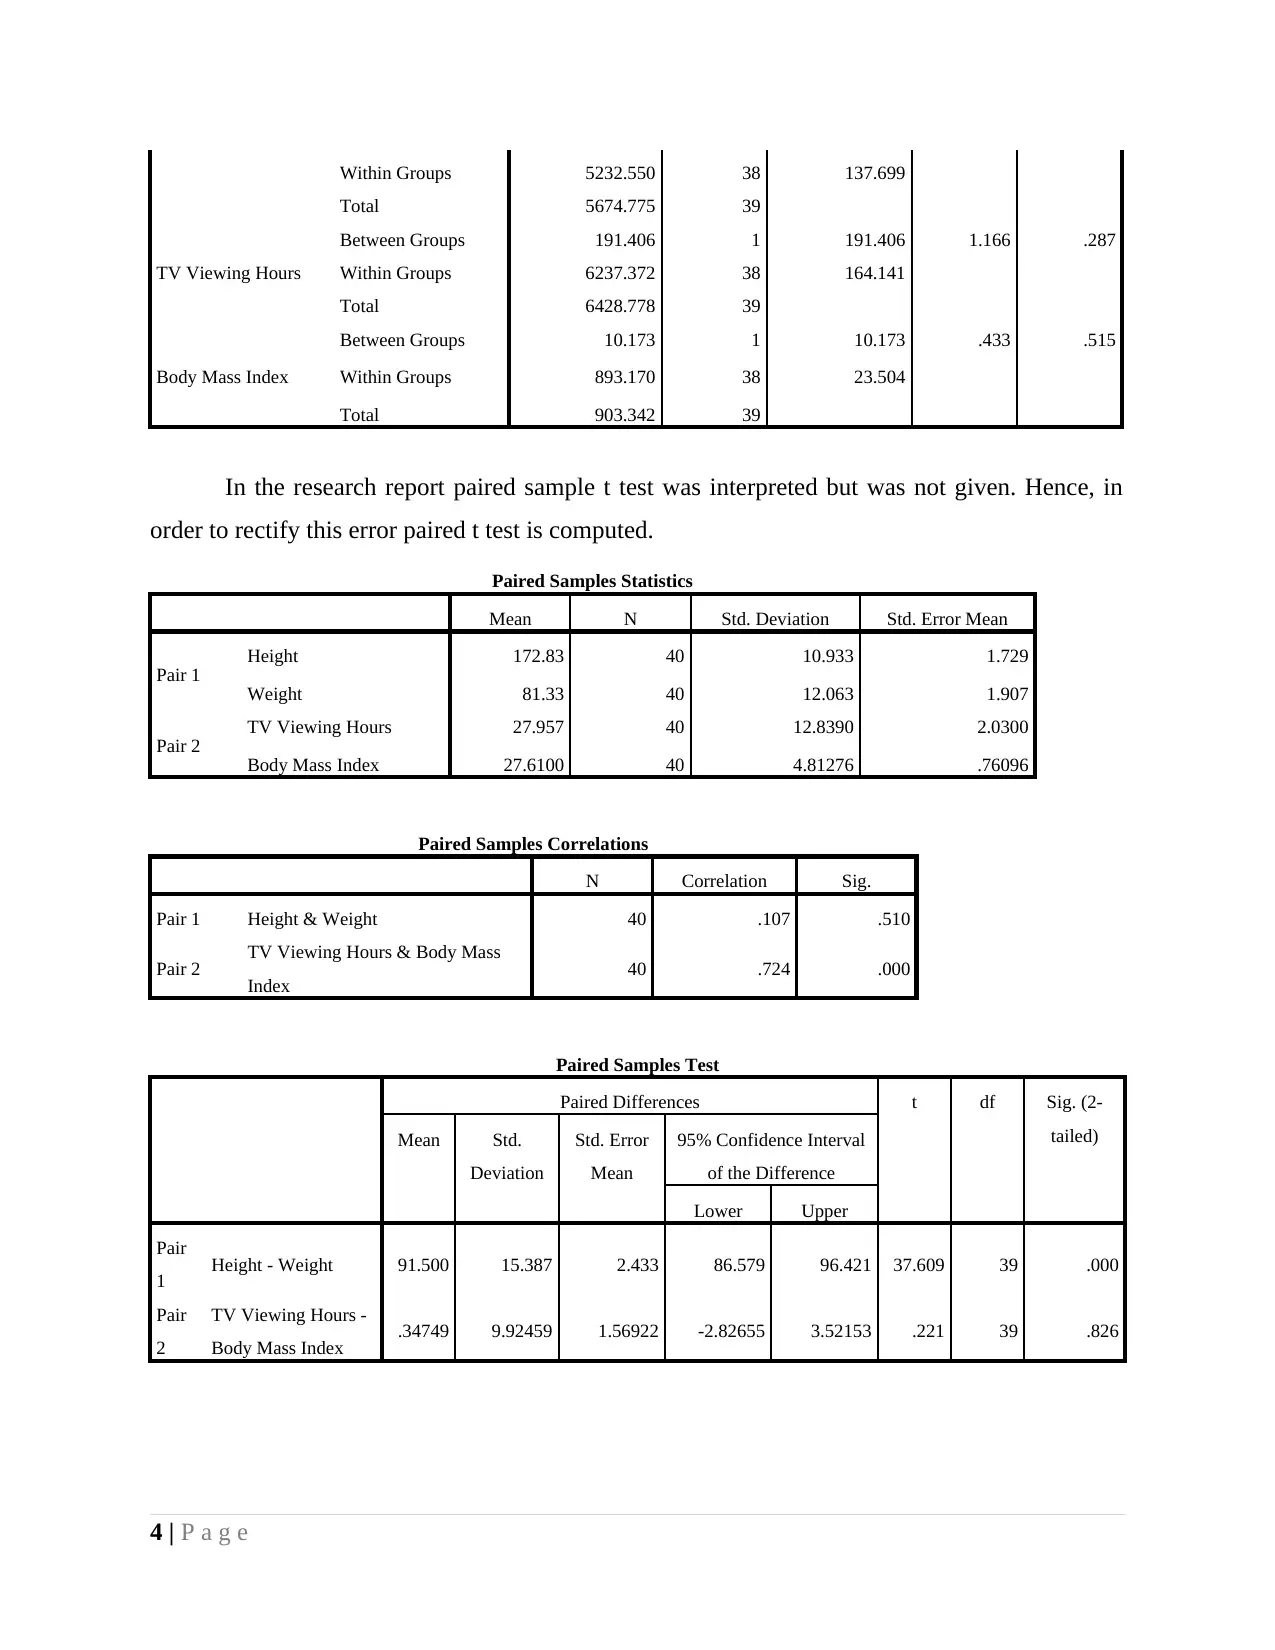
This report critically analyzes a psychology research study, identifying multiple errors in the methodology, design, analysis, and interpretation of the data. The report begins by pinpointing errors in the method section, such as incorrect sample size, inappropriate participant age, lack of informed con...

PSYCHOLOGY: AN EVIDENCE
BASED APPROACH 2
BASED APPROACH 2
Paraphrase This Document
Need a fresh take? Get an instant paraphrase of this document with our AI Paraphraser

TABLE OF CONTENTS
INTRODUCTION...........................................................................................................................1
Identification of errors.....................................................................................................................1
Correction of errors..........................................................................................................................3
CONCLUSION................................................................................................................................7

INTRODUCTION
In the current report review of research paper is done and errors in same are identified.
With respect to these errors, steps that can be taken are recommended. Apart from this, again
statistical tools are applied and areas where wrong interpretation made are rectified and in this
way, entire research work is carried out in the research study.
IDENTIFICATION OF ERRORS
Method: There are number of errors in the method section of the research report. It can be
seen from research report that there are 50 young adolescents in the research. Research
wrongly bifurcate and stated that there are 30 male and 30 female in sample. Thus, it can be
said that total that is made by the researcher was wrong and it need to ensure that total is
wrongly made in he report. Secondly, in the sample that is taken in the present research study
sample taken is not highly relevant in nature. Means that mean age of sample units is 13.4
which means that on an average childrens that are age of 13 to 14 are taken in the research
study which is not good. This is because childrens does not understand lots of things that are
covered in research and may give wrong answers. This may carry out research in wrong
direction and wrong results can be obtained. Third mistake that is observed in design section
of the report is that written concent is not obtained from the students and their family
members. As per rules it is very important to ensure that parents or children give full concent
for research purpose but this condition was not fulfilled and on this basis it can be said that
error was not identified by the researcher. Fourth mistake is that softly sample units were
threatened as they were said that if same will not participate in research then in that case
same have to writer article on given topic. As per rules no person can be threatened even
softly to partcipate in the research. Hence, this is fourth error in research topic.
Design: In the research simple random sampling method was used which can not be
considered right. This is because all students can not take sound decisions and can not give
accurate answers to asked question. Hence, instead of chossing simple random sampling
there was need to select any other sampling method in the research study. It is possible that
some of students or sample units give correct answer and it is not possible that some may
give wrong answer. Hence, it is necessary to follow appropriate research design so that study
can be carried out in right direction. Before selecting sample units it is very important to
1 | P a g e
⊘ This is a preview!⊘
Do you want full access?
Subscribe today to unlock all pages.

Trusted by 1+ million students worldwide

identify that which sort of people are available as sample unit in option and to what extent
they can support entire research study. By doing so it can be identified whether in research
appropriate sample units are taken or there is need to change research design method in rhe
research study. It can be said that there is huge importance of design section in any research
study.
Analysis: Like other sections of the report in this section also there are few of mistakes and
one of them is that in report it is clearly mentioned that there is signifcent mean difference
between male and female age group and other factos across both gender categories. It must
be noted that in table 1 no where level of significence is given and researcher directly state
that there is significent mean different among gender in different categories. Thus, analysis
that is done is wrong actually for identifying whether there is mean difference between male
and female in terms of height, weight and BMI ANNOVA can be used. Researcher simply
consider mean and standard deviation to identify difference between male and female on
different parameters and this approach is not correct. Second, big mistake that is made in
analysis is that researcher is clearly indicating that paired sample t test is conducted but it is
not reflecting that where in the research there is table of t test. Hence, it can be said that
simple interpretation is made but as part of verification paired t test table is not added in the
report. Hence, there is need to make relevant changes in the report.
Interpretation:Some serious mistakes are made in interpretation of data as it can be seen that
researcher simply by looking and identifying difference between mean and standard
deviation value make assumption that there is significent difference between gender which is
not good. There is need to make changes in interpretation as simply it is descriptive statistics
application and not application of any test. Hence, it can be said that interpretation is wrongly
made by researcher. There are many other mistakes in the interpretation section of the report
as it can be observed that it is clearly stated that there is strong coorleation between weight
and BMI in case of male then female. It can be seen from table that coorelation value
between weight and BMI is 0.55 for male and same for female is 0.87. Thus, it can be said
that interpretaion is wrongly made in the research report. Correct interpretation is that high
degree of coorelation is observed in case of females then male. Hence, mistakes are made in
interpretation of data. In interpretation it is stated that television viewing hours have positive
coorelation between weight as well as BMI for male then female. This way of interpretation
2 | P a g e
Paraphrase This Document
Need a fresh take? Get an instant paraphrase of this document with our AI Paraphraser

is completely wrong because researcher need to show value of coorelation between TV
viewing habits and BMI individually for both male and female. In same way coorleation
value need to be shown separately for TV viewing habits and weight separately for both male
and female. In this way it was possible to do accurate interpretation of variables across
different genders and forming assumption about whether TV viewing habit, weight and BMI
are strongly coorelated in case of male then female.
CORRECTION OF ERROR Method: First of all there is need to make editing in the reserarch paper and sample units
that are classified must be improved to sum of 40. Sample units must be changed and
individuals that are at age of 17 or 18 must be taken in to account so that more and more
reliable information can be gathered from them. This will also ensure that there is heavy
reliability of data. Apart from this, data must be gathered after obtaining due consent
from the sample units. It must also be ensured that sample units are not pressurized to
take partcipation in the research study. By doing all these things research can be carried
out in proper manner. Design: Stratisfied random sampling method must be adopted at place of simple random
sampling method. This is because under this different sort of sample units can be taken in
the research study and it can be ensured that only prudent individuals are taken in to
current research study. Hence, there will be high reliability of the data that will be
collected from sample unit. Thus, it will be better to use stratified random sampling
method in research study. Analysis: It must be noted that in the research report wrong interpretation of mean and
standard deviation was made in terms of gender in respect to significent difference. In
order to identify significent difference between gender in terms of multiple variables
ANNOVA applied which is given below.
ANOVA
Sum of Squares df Mean Square F Sig.
Height
Between Groups 1050.625 1 1050.625 11.056 .002
Within Groups 3611.150 38 95.030
Total 4661.775 39
Weight Between Groups 442.225 1 442.225 3.212 .081
3 | P a g e

Within Groups 5232.550 38 137.699
Total 5674.775 39
TV Viewing Hours
Between Groups 191.406 1 191.406 1.166 .287
Within Groups 6237.372 38 164.141
Total 6428.778 39
Body Mass Index
Between Groups 10.173 1 10.173 .433 .515
Within Groups 893.170 38 23.504
Total 903.342 39
In the research report paired sample t test was interpreted but was not given. Hence, in
order to rectify this error paired t test is computed.
Paired Samples Statistics
Mean N Std. Deviation Std. Error Mean
Pair 1 Height 172.83 40 10.933 1.729
Weight 81.33 40 12.063 1.907
Pair 2 TV Viewing Hours 27.957 40 12.8390 2.0300
Body Mass Index 27.6100 40 4.81276 .76096
Paired Samples Correlations
N Correlation Sig.
Pair 1 Height & Weight 40 .107 .510
Pair 2 TV Viewing Hours & Body Mass
Index 40 .724 .000
Paired Samples Test
Paired Differences t df Sig. (2-
tailed)Mean Std.
Deviation
Std. Error
Mean
95% Confidence Interval
of the Difference
Lower Upper
Pair
1 Height - Weight 91.500 15.387 2.433 86.579 96.421 37.609 39 .000
Pair
2
TV Viewing Hours -
Body Mass Index .34749 9.92459 1.56922 -2.82655 3.52153 .221 39 .826
4 | P a g e
⊘ This is a preview!⊘
Do you want full access?
Subscribe today to unlock all pages.

Trusted by 1+ million students worldwide

Correlation value was wrongly interpreted and due to this reason again correlation table is
produced and same will be interpreted in proper manner.
5 | P a g e
produced and same will be interpreted in proper manner.
5 | P a g e
Paraphrase This Document
Need a fresh take? Get an instant paraphrase of this document with our AI Paraphraser

6 | P a g e

Interpretation: Mean and standard deviation for height is (M=172.83, SD=10.93) and same
for weight is (M=81.33, SD=12.06) as well as TV viewing hours is (M=27.95, SD=12.83).
On other hand, for body mass index (M=27.16, SD=4.81). In case of paired sample t test coorelation in case of height and weight is (0.107, Sig=0.510)
which reflect that there is low coorelation and there is no significent relationship between
both variables. On other hand, in case of TV viewing hours and body mass index coorleation
value is (0.724, Sig= 0.00) and this means that there is significent relationship between both
variables as both these variables are strongly coorelated to each other. Value of level of significence in case of height and weight is (Sig=0.00<0.05) which means
that there is significent mean difference between both variables. TV viewing hours and body
mass index value of level of significence is (Sig= 0.826>0.05) and this means that there is no
significent mean difference between independent variables. Hence, it can be said that body
mass index and TV viewing hours change at same rate but height and weight change at
different rate. Correlation of height and weight is (0.107, Sig= 0.510) which means that there is low and no
significent relationship between both variables. On other hand, coorelation value between
height and TV viewing hours is (-0.249, Sig=0.121>0.05) which means that there is no
significent relationship between both variables. Correlation between height and BMI is (-
0.535, Sig= 0.00) which means that there is relationship between both variables and height
have impact on value of BMI. It can be seen that coorelation of BMI and weight in case of male is (0.555,Sig= 0.01>0.05)
and same in case of female is (0.872, Sig=0.00<0.05) which means that there is high
coorelation of weight and BMI in case of female then male. Coorelation of TV to weight
(0.780, Sig= 0.00<0.05) and for BMI (0.606, Sig= 0.00<0.05) for male. In case of female
coorelation of TV to weight (0.694 Sig= 0.01<0.05) and for BMI (0.797, Sig= 0.00<0.05).
Hence, it can be said that there is high corelation of TV to weight in case of male high
coorelation of TV to BMI in case of females.
CONCLUSION
On the basis of above discussion it is concluded that while preparing report lots of things
must be considered and thereafter research must be carried out so that it can be ensured that it is
7 | P a g e
⊘ This is a preview!⊘
Do you want full access?
Subscribe today to unlock all pages.

Trusted by 1+ million students worldwide

going on in right direction. While applying statistical tools it must be identified that for what
purpose it is used and what is current research requrements. Accoridngly, specific tool must be
used in research.
8 | P a g e
purpose it is used and what is current research requrements. Accoridngly, specific tool must be
used in research.
8 | P a g e
1 out of 10
Related Documents

Your All-in-One AI-Powered Toolkit for Academic Success.
+13062052269
info@desklib.com
Available 24*7 on WhatsApp / Email
Unlock your academic potential
© 2024 | Zucol Services PVT LTD | All rights reserved.