Identifying Risks and Hazards Analysis: PUBH 6033 Week 10 Assignment 2

Verified

Added on  2020/04/21

|5
|816
|153
Homework Assignment
AI Summary
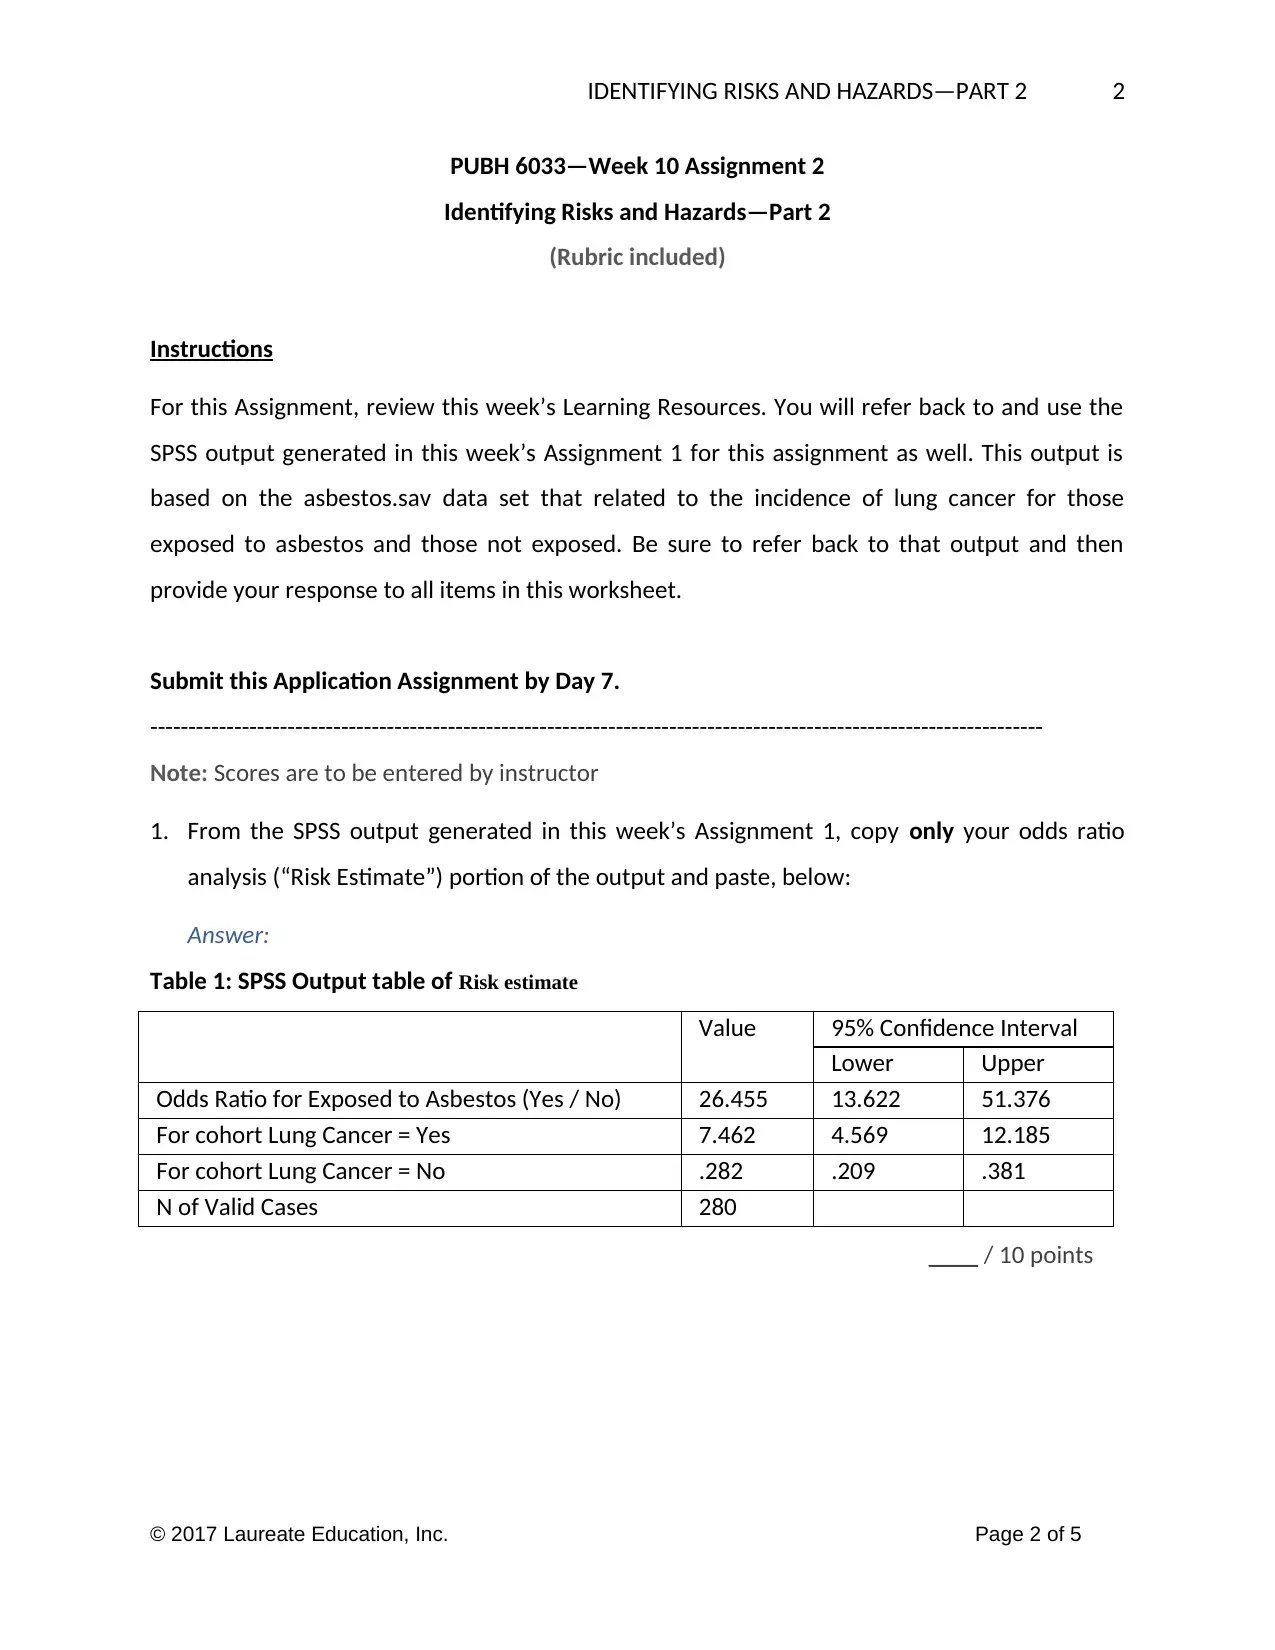
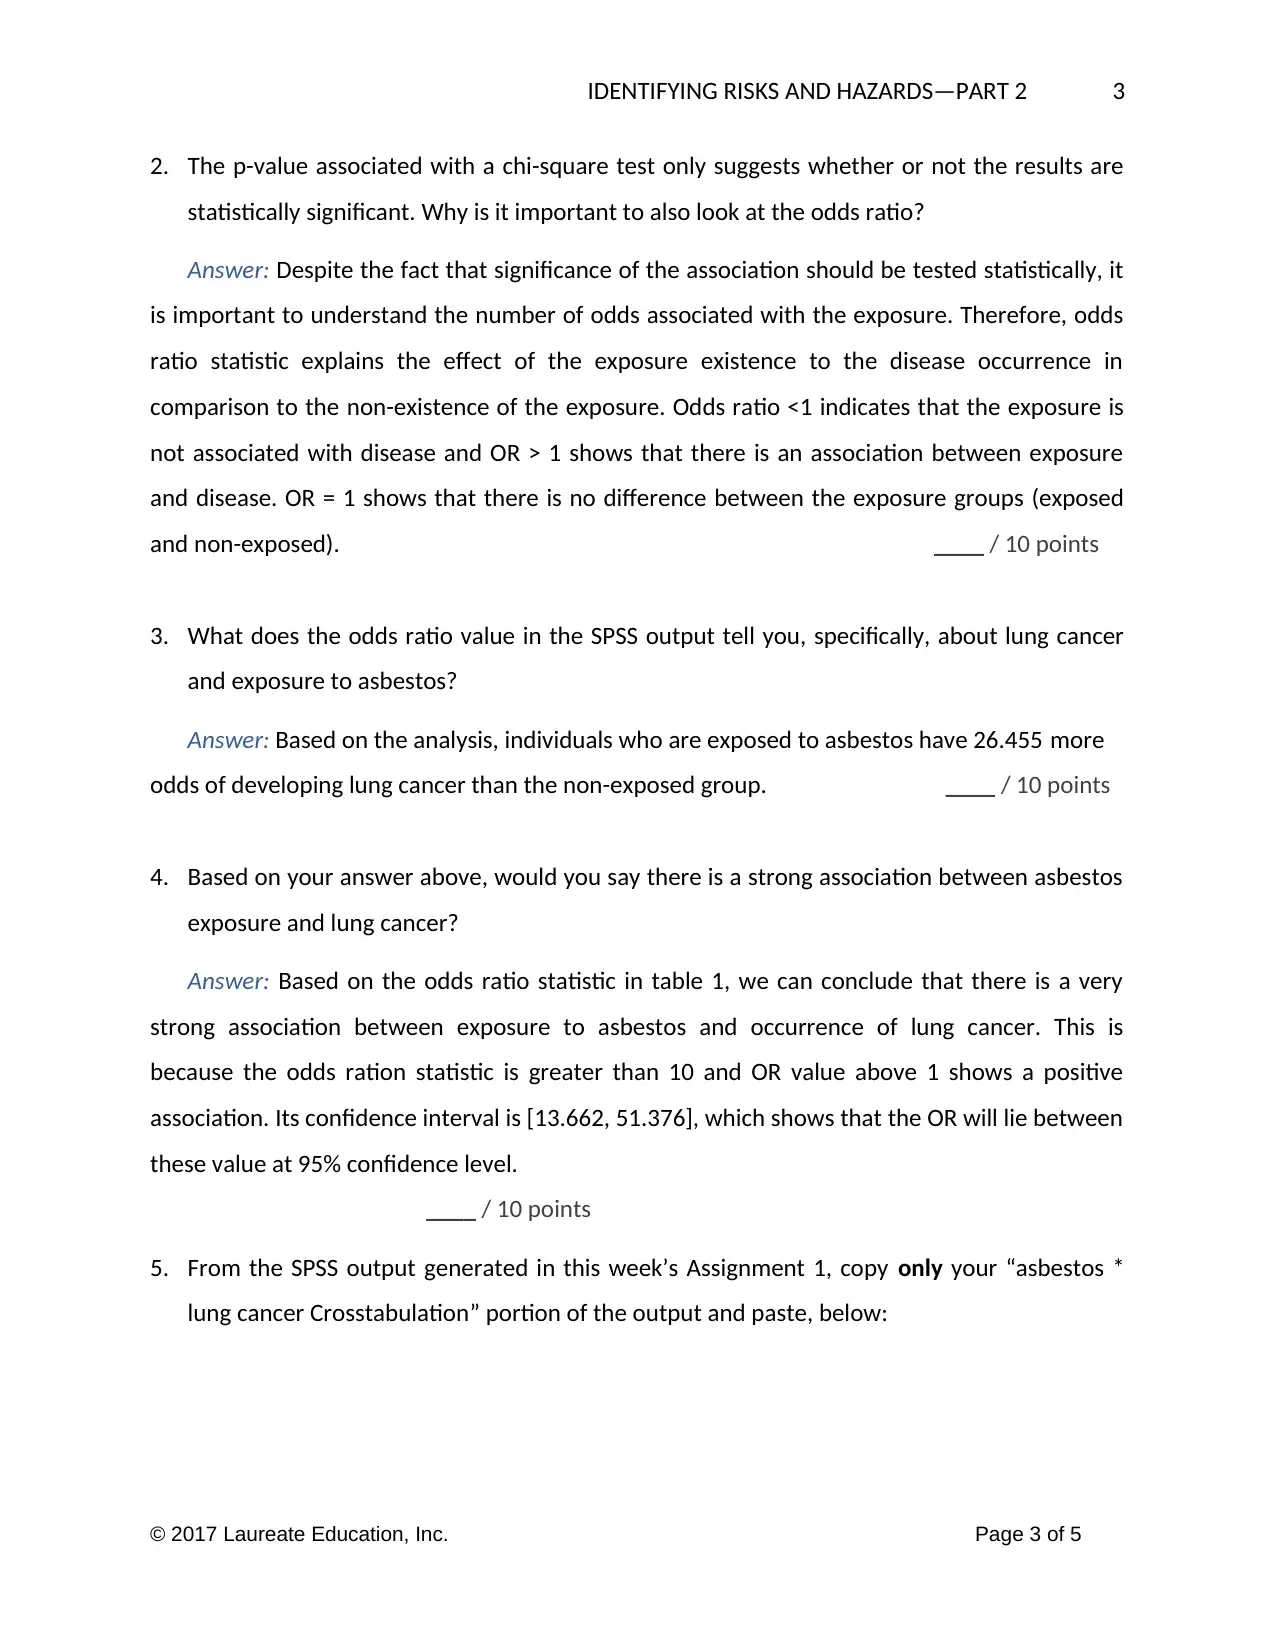
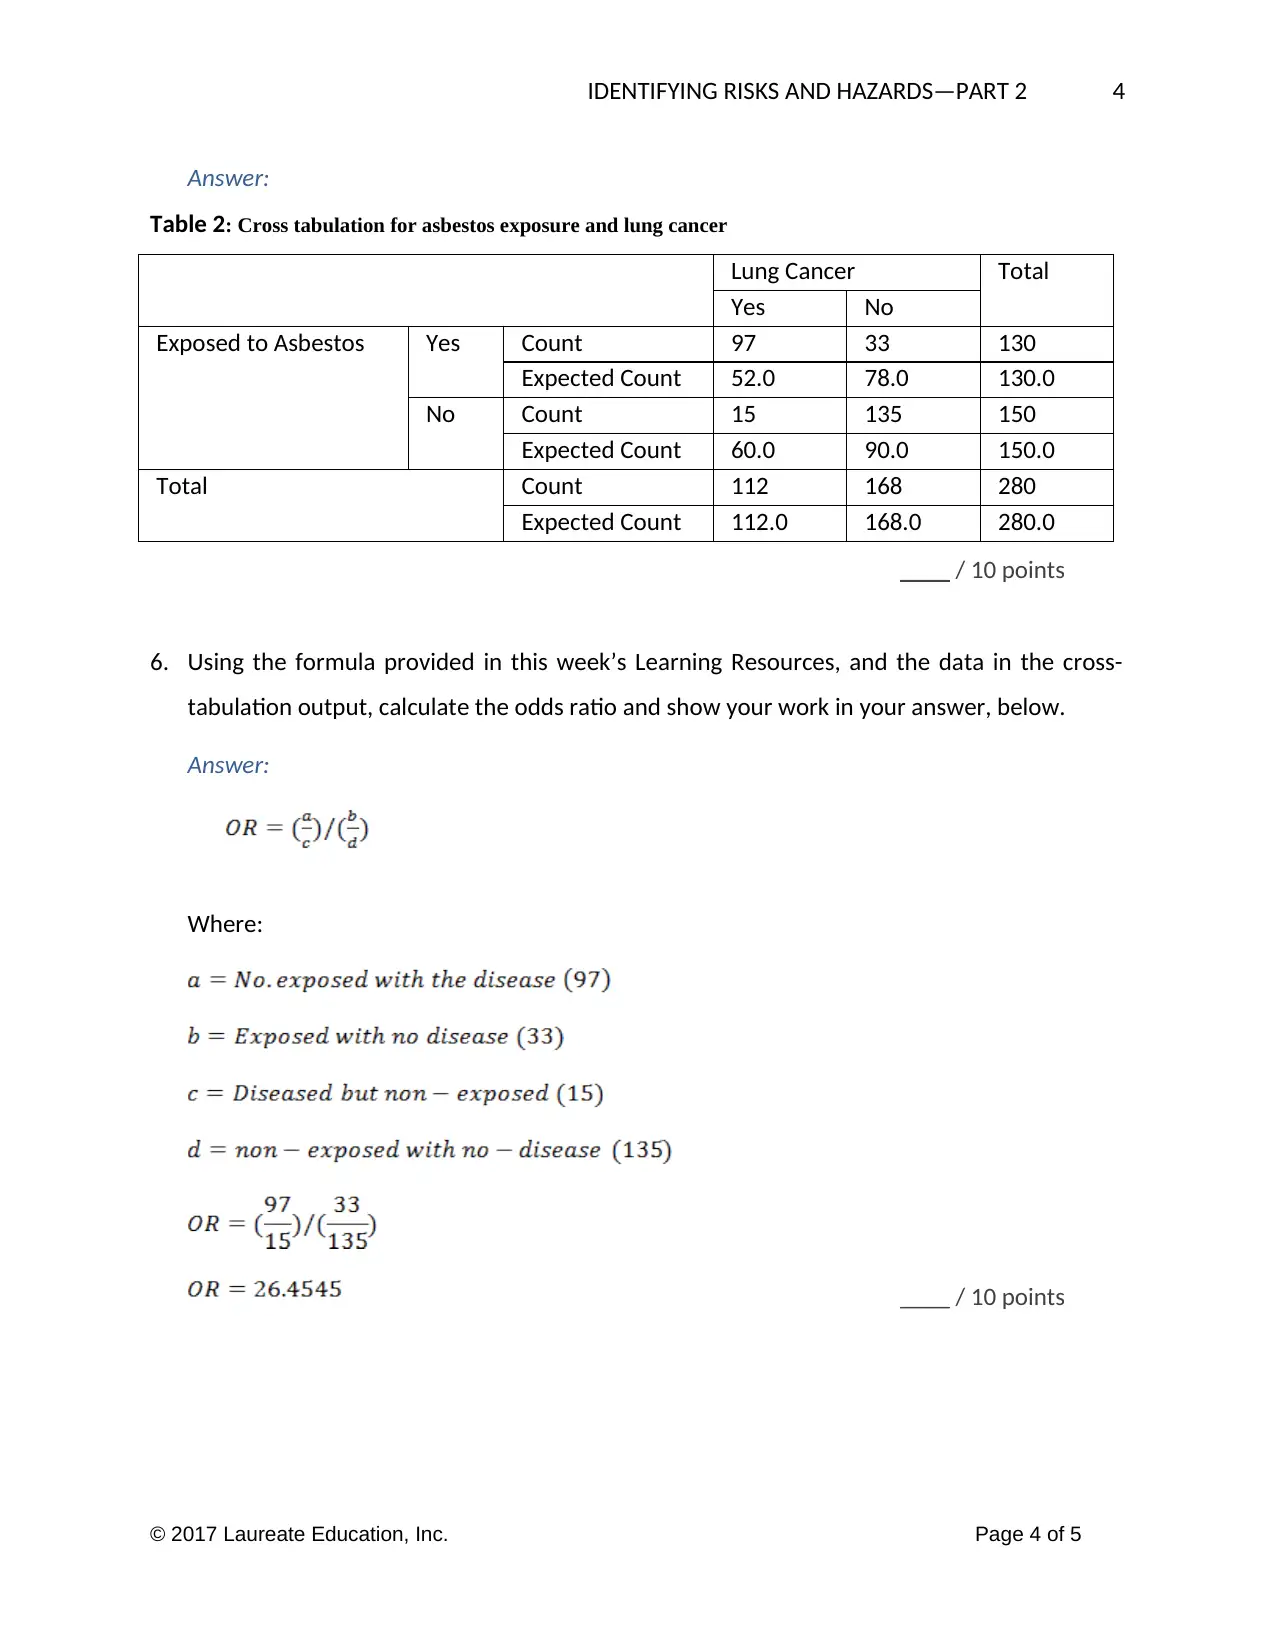
This homework assignment for PUBH 6033 focuses on identifying and analyzing risks and hazards, specifically examining the relationship between asbestos exposure and lung cancer. The assignment requires students to interpret SPSS output, calculate odds ratios, and explain the statistical significance of findings. The student provides the odds ratio analysis and cross-tabulation data from SPSS, then calculates the odds ratio using the provided formula. The analysis demonstrates a strong association between asbestos exposure and the occurrence of lung cancer, emphasizing the importance of considering both statistical significance and the magnitude of the odds ratio. The assignment also highlights the importance of understanding the odds ratio in assessing the effect of exposure on disease occurrence.
Document Page
Running head: IDENTIFYING RISKS AND HAZARDS—PART 2
Identifying Risks and Hazards—Part 2
Name
Course Number
Date
Faculty Name
tabler-icon-diamond-filled.svg

Paraphrase This Document

Need a fresh take? Get an instant paraphrase of this document with our AI Paraphraser
Document Page
IDENTIFYING RISKS AND HAZARDS—PART 2 2
PUBH 6033—Week 10 Assignment 2
Identifying Risks and Hazards—Part 2
(Rubric included)
Instructions
For this Assignment, review this week’s Learning Resources. You will refer back to and use the
SPSS output generated in this week’s Assignment 1 for this assignment as well. This output is
based on the asbestos.sav data set that related to the incidence of lung cancer for those
exposed to asbestos and those not exposed. Be sure to refer back to that output and then
provide your response to all items in this worksheet.
Submit this Application Assignment by Day 7.
---------------------------------------------------------------------------------------------------------------------
Note: Scores are to be entered by instructor
1. From the SPSS output generated in this week’s Assignment 1, copy only your odds ratio
analysis (“Risk Estimate”) portion of the output and paste, below:
Answer:
Table 1: SPSS Output table of Risk estimate
Value 95% Confidence Interval
Lower Upper
Odds Ratio for Exposed to Asbestos (Yes / No) 26.455 13.622 51.376
For cohort Lung Cancer = Yes 7.462 4.569 12.185
For cohort Lung Cancer = No .282 .209 .381
N of Valid Cases 280
____ / 10 points
© 2017 Laureate Education, Inc. Page 2 of 5
Document Page
IDENTIFYING RISKS AND HAZARDS—PART 2 3
2. The p-value associated with a chi-square test only suggests whether or not the results are
statistically significant. Why is it important to also look at the odds ratio?
Answer: Despite the fact that significance of the association should be tested statistically, it
is important to understand the number of odds associated with the exposure. Therefore, odds
ratio statistic explains the effect of the exposure existence to the disease occurrence in
comparison to the non-existence of the exposure. Odds ratio <1 indicates that the exposure is
not associated with disease and OR > 1 shows that there is an association between exposure
and disease. OR = 1 shows that there is no difference between the exposure groups (exposed
and non-exposed). ____ / 10 points
3. What does the odds ratio value in the SPSS output tell you, specifically, about lung cancer
and exposure to asbestos?
Answer: Based on the analysis, individuals who are exposed to asbestos have 26.455 more
odds of developing lung cancer than the non-exposed group. ____ / 10 points
4. Based on your answer above, would you say there is a strong association between asbestos
exposure and lung cancer?
Answer: Based on the odds ratio statistic in table 1, we can conclude that there is a very
strong association between exposure to asbestos and occurrence of lung cancer. This is
because the odds ration statistic is greater than 10 and OR value above 1 shows a positive
association. Its confidence interval is [13.662, 51.376], which shows that the OR will lie between
these value at 95% confidence level.
____ / 10 points
5. From the SPSS output generated in this week’s Assignment 1, copy only your “asbestos *
lung cancer Crosstabulation portion of the output and paste, below:
© 2017 Laureate Education, Inc. Page 3 of 5
Document Page
IDENTIFYING RISKS AND HAZARDS—PART 2 4
Answer:
Table 2: Cross tabulation for asbestos exposure and lung cancer
Lung Cancer Total
Yes No
Exposed to Asbestos Yes Count 97 33 130
Expected Count 52.0 78.0 130.0
No Count 15 135 150
Expected Count 60.0 90.0 150.0
Total Count 112 168 280
Expected Count 112.0 168.0 280.0
____ / 10 points
6. Using the formula provided in this week’s Learning Resources, and the data in the cross-
tabulation output, calculate the odds ratio and show your work in your answer, below.
Answer:
Where:
____ / 10 points
© 2017 Laureate Education, Inc. Page 4 of 5
tabler-icon-diamond-filled.svg

Paraphrase This Document

Need a fresh take? Get an instant paraphrase of this document with our AI Paraphraser
Document Page
IDENTIFYING RISKS AND HAZARDS—PART 2 5
Section below (scoring) is to be completed by Instructor
Scoring Rubric for Week 10 Assignment 2
Identifying Risks and Hazards—Part 2 (60 points)
Initial Score (60 possible points):
Timeliness Factor (late points deducted):
Total Score (60 possible points):
Instructor comments:
© 2017 Laureate Education, Inc. Page 5 of 5
chevron_up_icon
1 out of 5
circle_padding
hide_on_mobile
zoom_out_icon
[object Object]