Health Inequality Audit Report for PUBH610: Stormsland, Victoria
VerifiedAdded on 2022/09/11
|16
|3513
|24
Report
AI Summary
This report presents a health inequality audit conducted for Stormsland, Victoria, Australia, assessing various factors such as age distribution, indigenous status, birthplace, education, and disease-related data across 15 sub-zones. The audit utilizes the Social Health Atlas of Australia and other data sources to analyze health disparities and inequities. Key findings highlight differences in male and female population distribution, indigenous population density, education levels, and disease screening rates across the sub-zones. The discussion frames the audit results within public health principles, emphasizing the impact of social determinants on health outcomes and the need for equitable healthcare access. The report concludes by underscoring the presence of health inequalities and inequities in Stormsland and the need for targeted interventions to address these disparities and promote social justice.
Running Head: HISTORY AND PRINCIPLES OF PUBLIC HEALTH
HISTORY AND PRINCIPLES OF PUBLIC HEALTH
Name of the Student:
Name of the University:
Author’s Note:
HISTORY AND PRINCIPLES OF PUBLIC HEALTH
Name of the Student:
Name of the University:
Author’s Note:
Paraphrase This Document
Need a fresh take? Get an instant paraphrase of this document with our AI Paraphraser
1HISTORY AND PRINCIPLES OF PUBLIC HEALTH
Introduction and rationale
Health inequality is described as the differences in the health outcomes and
experience between different population groups in accordance with geographic location,
socio-economic status, age, gender, disability or ethnicity (Bartley, 2016). Conversely, health
inequity is stated to the difference in the health outcome between population groups that had
resulted due to the distribution of resources, inequitable access and lack of access to the
health determinants. Health equity audit is a self-assessment tool that examines the provision
of allocation of resources in a fair manner in relation to the need of varied groups. It involves
a systematic review of the health inequalities and access to different types of services by a
particular group in a defined geographic area (Kallfa et al., 2019). The population health
indicators are analysed and evidence-based practice is applied to establish a relationship
between them. This will help in understanding the area lacking with respect to health status
and the areas that require focusing in order to improve the health status and outcome of the
specific location. The aim of this report is to conduct a health inequality audit for a specific
geographic region in Victoria, which is chosen to be Stormsland. Various aspects such as age,
indigenous status, birthplace, education, early child development, family, housing, transport
and disease-related data would be assessed.
Data analysis/application of the audit tool
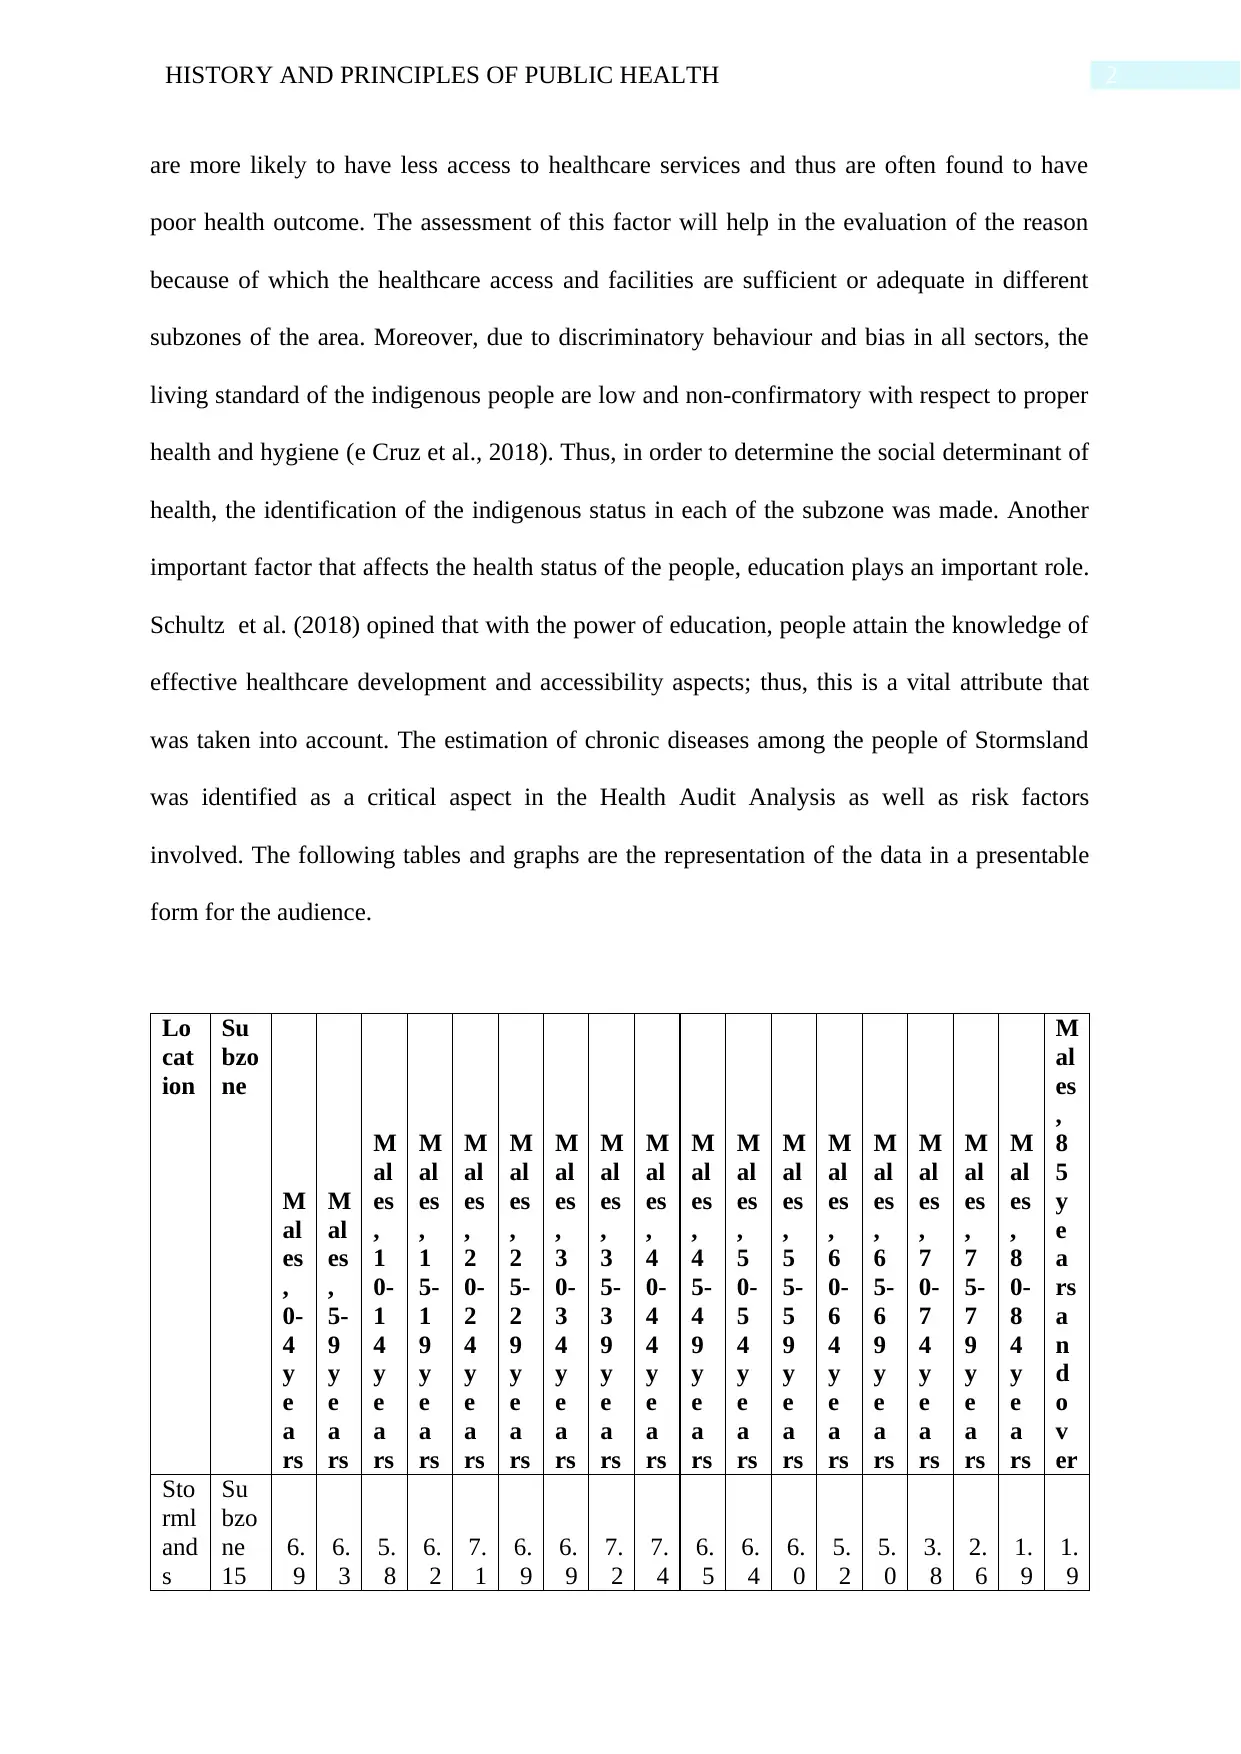
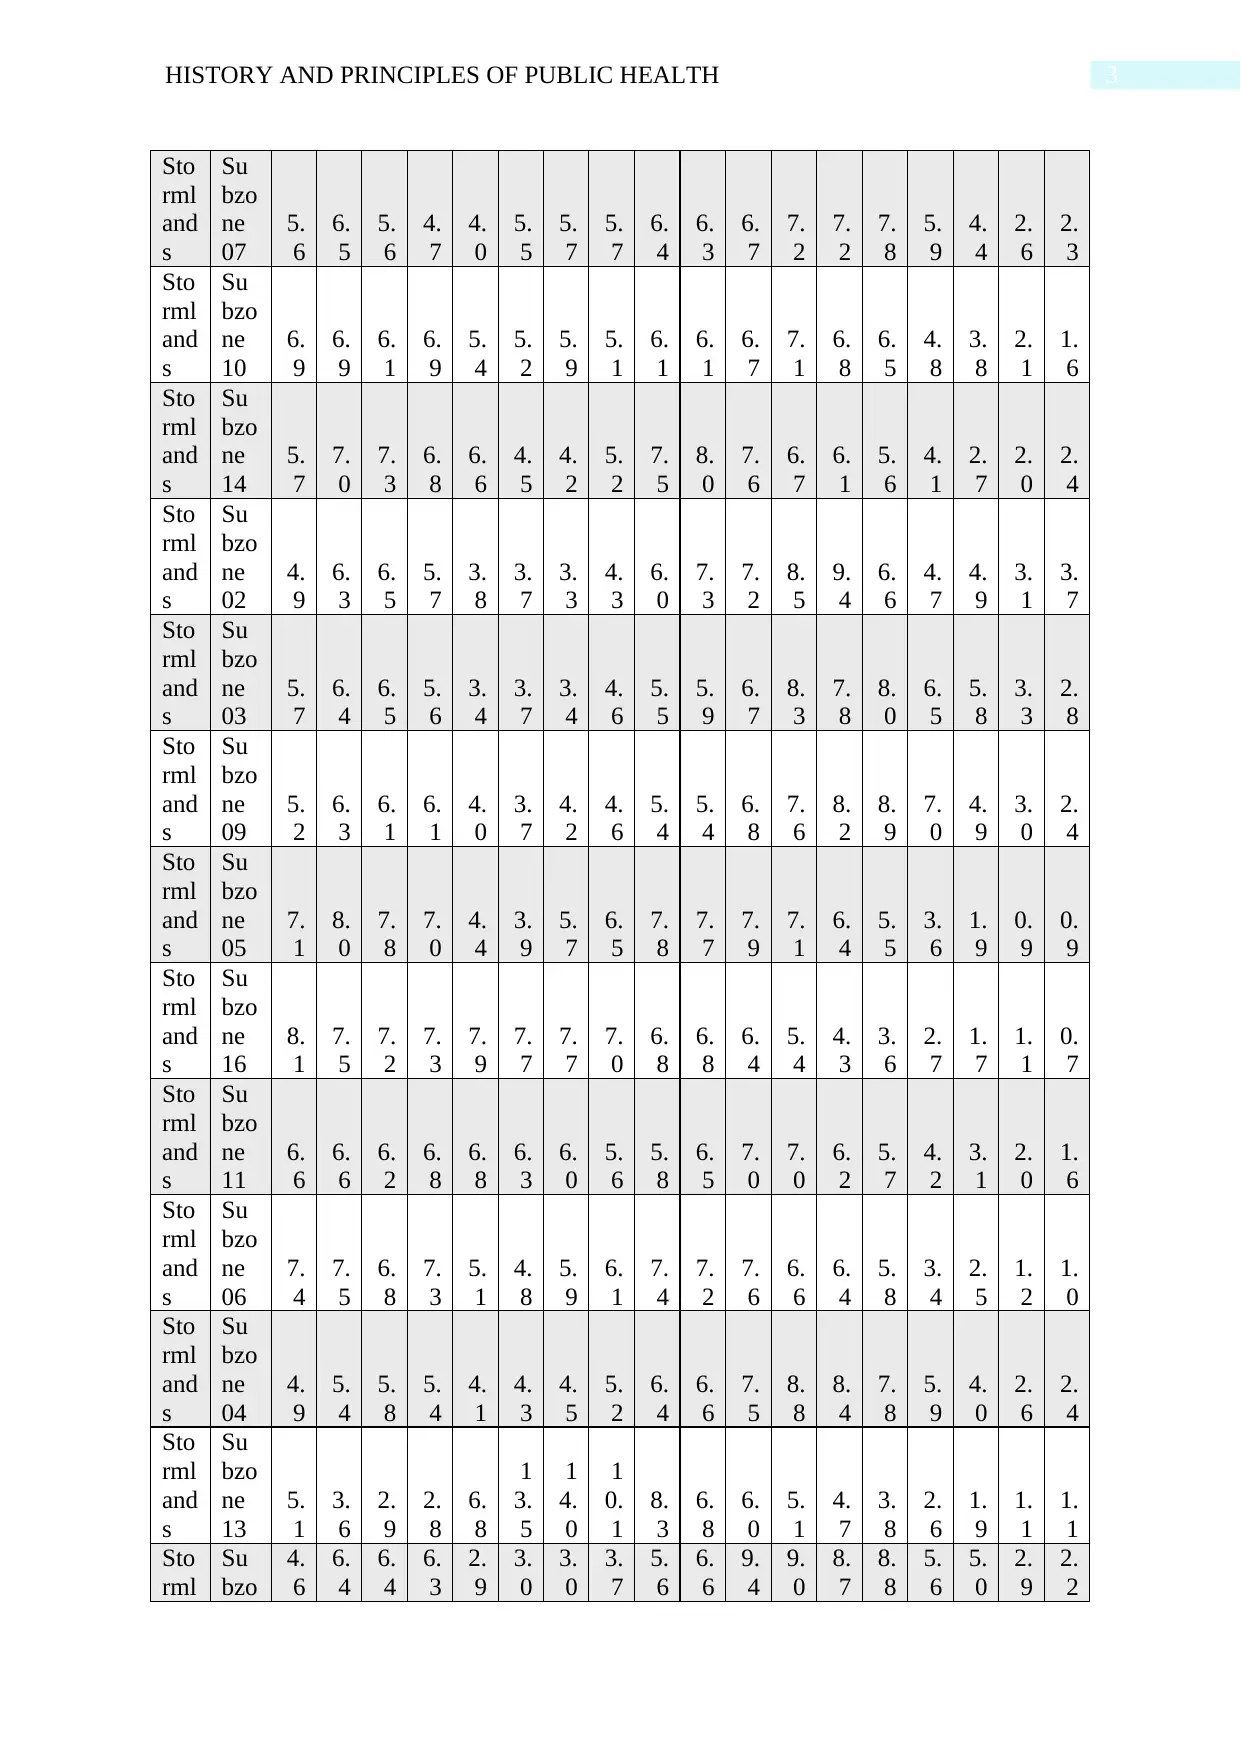
With the help of the Social Health Atlas of Australia that involves data related to
different area and subzone of 2016, the National Audit was conducted. The factors that had
been taken into consideration include age distribution of male and age distribution of females
that helped in gaining an understanding of the population of the area, Stormsland as well as
the community in 15 different sub-zones of the area. The indigenous status of each zone was
assessed that is an important factor in the health audit assessment. According to the study
conducted by Shepherd et al. (2017), it can be stated that the indigenous people in Australia
Introduction and rationale
Health inequality is described as the differences in the health outcomes and
experience between different population groups in accordance with geographic location,
socio-economic status, age, gender, disability or ethnicity (Bartley, 2016). Conversely, health
inequity is stated to the difference in the health outcome between population groups that had
resulted due to the distribution of resources, inequitable access and lack of access to the
health determinants. Health equity audit is a self-assessment tool that examines the provision
of allocation of resources in a fair manner in relation to the need of varied groups. It involves
a systematic review of the health inequalities and access to different types of services by a
particular group in a defined geographic area (Kallfa et al., 2019). The population health
indicators are analysed and evidence-based practice is applied to establish a relationship
between them. This will help in understanding the area lacking with respect to health status
and the areas that require focusing in order to improve the health status and outcome of the
specific location. The aim of this report is to conduct a health inequality audit for a specific
geographic region in Victoria, which is chosen to be Stormsland. Various aspects such as age,
indigenous status, birthplace, education, early child development, family, housing, transport
and disease-related data would be assessed.
Data analysis/application of the audit tool
With the help of the Social Health Atlas of Australia that involves data related to
different area and subzone of 2016, the National Audit was conducted. The factors that had
been taken into consideration include age distribution of male and age distribution of females
that helped in gaining an understanding of the population of the area, Stormsland as well as
the community in 15 different sub-zones of the area. The indigenous status of each zone was
assessed that is an important factor in the health audit assessment. According to the study
conducted by Shepherd et al. (2017), it can be stated that the indigenous people in Australia
2HISTORY AND PRINCIPLES OF PUBLIC HEALTH
are more likely to have less access to healthcare services and thus are often found to have
poor health outcome. The assessment of this factor will help in the evaluation of the reason
because of which the healthcare access and facilities are sufficient or adequate in different
subzones of the area. Moreover, due to discriminatory behaviour and bias in all sectors, the
living standard of the indigenous people are low and non-confirmatory with respect to proper
health and hygiene (e Cruz et al., 2018). Thus, in order to determine the social determinant of
health, the identification of the indigenous status in each of the subzone was made. Another
important factor that affects the health status of the people, education plays an important role.
Schultz et al. (2018) opined that with the power of education, people attain the knowledge of
effective healthcare development and accessibility aspects; thus, this is a vital attribute that
was taken into account. The estimation of chronic diseases among the people of Stormsland
was identified as a critical aspect in the Health Audit Analysis as well as risk factors
involved. The following tables and graphs are the representation of the data in a presentable
form for the audience.
Lo
cat
ion
Su
bzo
ne
M
al
es
,
0-
4
y
e
a
rs
M
al
es
,
5-
9
y
e
a
rs
M
al
es
,
1
0-
1
4
y
e
a
rs
M
al
es
,
1
5-
1
9
y
e
a
rs
M
al
es
,
2
0-
2
4
y
e
a
rs
M
al
es
,
2
5-
2
9
y
e
a
rs
M
al
es
,
3
0-
3
4
y
e
a
rs
M
al
es
,
3
5-
3
9
y
e
a
rs
M
al
es
,
4
0-
4
4
y
e
a
rs
M
al
es
,
4
5-
4
9
y
e
a
rs
M
al
es
,
5
0-
5
4
y
e
a
rs
M
al
es
,
5
5-
5
9
y
e
a
rs
M
al
es
,
6
0-
6
4
y
e
a
rs
M
al
es
,
6
5-
6
9
y
e
a
rs
M
al
es
,
7
0-
7
4
y
e
a
rs
M
al
es
,
7
5-
7
9
y
e
a
rs
M
al
es
,
8
0-
8
4
y
e
a
rs
M
al
es
,
8
5
y
e
a
rs
a
n
d
o
v
er
Sto
rml
and
s
Su
bzo
ne
15
6.
9
6.
3
5.
8
6.
2
7.
1
6.
9
6.
9
7.
2
7.
4
6.
5
6.
4
6.
0
5.
2
5.
0
3.
8
2.
6
1.
9
1.
9
⊘ This is a preview!⊘
Do you want full access?
Subscribe today to unlock all pages.
Trusted by 1+ million students worldwide
3HISTORY AND PRINCIPLES OF PUBLIC HEALTH
Sto
rml
and
s
Su
bzo
ne
07
5.
6
6.
5
5.
6
4.
7
4.
0
5.
5
5.
7
5.
7
6.
4
6.
3
6.
7
7.
2
7.
2
7.
8
5.
9
4.
4
2.
6
2.
3
Sto
rml
and
s
Su
bzo
ne
10
6.
9
6.
9
6.
1
6.
9
5.
4
5.
2
5.
9
5.
1
6.
1
6.
1
6.
7
7.
1
6.
8
6.
5
4.
8
3.
8
2.
1
1.
6
Sto
rml
and
s
Su
bzo
ne
14
5.
7
7.
0
7.
3
6.
8
6.
6
4.
5
4.
2
5.
2
7.
5
8.
0
7.
6
6.
7
6.
1
5.
6
4.
1
2.
7
2.
0
2.
4
Sto
rml
and
s
Su
bzo
ne
02
4.
9
6.
3
6.
5
5.
7
3.
8
3.
7
3.
3
4.
3
6.
0
7.
3
7.
2
8.
5
9.
4
6.
6
4.
7
4.
9
3.
1
3.
7
Sto
rml
and
s
Su
bzo
ne
03
5.
7
6.
4
6.
5
5.
6
3.
4
3.
7
3.
4
4.
6
5.
5
5.
9
6.
7
8.
3
7.
8
8.
0
6.
5
5.
8
3.
3
2.
8
Sto
rml
and
s
Su
bzo
ne
09
5.
2
6.
3
6.
1
6.
1
4.
0
3.
7
4.
2
4.
6
5.
4
5.
4
6.
8
7.
6
8.
2
8.
9
7.
0
4.
9
3.
0
2.
4
Sto
rml
and
s
Su
bzo
ne
05
7.
1
8.
0
7.
8
7.
0
4.
4
3.
9
5.
7
6.
5
7.
8
7.
7
7.
9
7.
1
6.
4
5.
5
3.
6
1.
9
0.
9
0.
9
Sto
rml
and
s
Su
bzo
ne
16
8.
1
7.
5
7.
2
7.
3
7.
9
7.
7
7.
7
7.
0
6.
8
6.
8
6.
4
5.
4
4.
3
3.
6
2.
7
1.
7
1.
1
0.
7
Sto
rml
and
s
Su
bzo
ne
11
6.
6
6.
6
6.
2
6.
8
6.
8
6.
3
6.
0
5.
6
5.
8
6.
5
7.
0
7.
0
6.
2
5.
7
4.
2
3.
1
2.
0
1.
6
Sto
rml
and
s
Su
bzo
ne
06
7.
4
7.
5
6.
8
7.
3
5.
1
4.
8
5.
9
6.
1
7.
4
7.
2
7.
6
6.
6
6.
4
5.
8
3.
4
2.
5
1.
2
1.
0
Sto
rml
and
s
Su
bzo
ne
04
4.
9
5.
4
5.
8
5.
4
4.
1
4.
3
4.
5
5.
2
6.
4
6.
6
7.
5
8.
8
8.
4
7.
8
5.
9
4.
0
2.
6
2.
4
Sto
rml
and
s
Su
bzo
ne
13
5.
1
3.
6
2.
9
2.
8
6.
8
1
3.
5
1
4.
0
1
0.
1
8.
3
6.
8
6.
0
5.
1
4.
7
3.
8
2.
6
1.
9
1.
1
1.
1
Sto
rml
Su
bzo
4.
6
6.
4
6.
4
6.
3
2.
9
3.
0
3.
0
3.
7
5.
6
6.
6
9.
4
9.
0
8.
7
8.
8
5.
6
5.
0
2.
9
2.
2
Sto
rml
and
s
Su
bzo
ne
07
5.
6
6.
5
5.
6
4.
7
4.
0
5.
5
5.
7
5.
7
6.
4
6.
3
6.
7
7.
2
7.
2
7.
8
5.
9
4.
4
2.
6
2.
3
Sto
rml
and
s
Su
bzo
ne
10
6.
9
6.
9
6.
1
6.
9
5.
4
5.
2
5.
9
5.
1
6.
1
6.
1
6.
7
7.
1
6.
8
6.
5
4.
8
3.
8
2.
1
1.
6
Sto
rml
and
s
Su
bzo
ne
14
5.
7
7.
0
7.
3
6.
8
6.
6
4.
5
4.
2
5.
2
7.
5
8.
0
7.
6
6.
7
6.
1
5.
6
4.
1
2.
7
2.
0
2.
4
Sto
rml
and
s
Su
bzo
ne
02
4.
9
6.
3
6.
5
5.
7
3.
8
3.
7
3.
3
4.
3
6.
0
7.
3
7.
2
8.
5
9.
4
6.
6
4.
7
4.
9
3.
1
3.
7
Sto
rml
and
s
Su
bzo
ne
03
5.
7
6.
4
6.
5
5.
6
3.
4
3.
7
3.
4
4.
6
5.
5
5.
9
6.
7
8.
3
7.
8
8.
0
6.
5
5.
8
3.
3
2.
8
Sto
rml
and
s
Su
bzo
ne
09
5.
2
6.
3
6.
1
6.
1
4.
0
3.
7
4.
2
4.
6
5.
4
5.
4
6.
8
7.
6
8.
2
8.
9
7.
0
4.
9
3.
0
2.
4
Sto
rml
and
s
Su
bzo
ne
05
7.
1
8.
0
7.
8
7.
0
4.
4
3.
9
5.
7
6.
5
7.
8
7.
7
7.
9
7.
1
6.
4
5.
5
3.
6
1.
9
0.
9
0.
9
Sto
rml
and
s
Su
bzo
ne
16
8.
1
7.
5
7.
2
7.
3
7.
9
7.
7
7.
7
7.
0
6.
8
6.
8
6.
4
5.
4
4.
3
3.
6
2.
7
1.
7
1.
1
0.
7
Sto
rml
and
s
Su
bzo
ne
11
6.
6
6.
6
6.
2
6.
8
6.
8
6.
3
6.
0
5.
6
5.
8
6.
5
7.
0
7.
0
6.
2
5.
7
4.
2
3.
1
2.
0
1.
6
Sto
rml
and
s
Su
bzo
ne
06
7.
4
7.
5
6.
8
7.
3
5.
1
4.
8
5.
9
6.
1
7.
4
7.
2
7.
6
6.
6
6.
4
5.
8
3.
4
2.
5
1.
2
1.
0
Sto
rml
and
s
Su
bzo
ne
04
4.
9
5.
4
5.
8
5.
4
4.
1
4.
3
4.
5
5.
2
6.
4
6.
6
7.
5
8.
8
8.
4
7.
8
5.
9
4.
0
2.
6
2.
4
Sto
rml
and
s
Su
bzo
ne
13
5.
1
3.
6
2.
9
2.
8
6.
8
1
3.
5
1
4.
0
1
0.
1
8.
3
6.
8
6.
0
5.
1
4.
7
3.
8
2.
6
1.
9
1.
1
1.
1
Sto
rml
Su
bzo
4.
6
6.
4
6.
4
6.
3
2.
9
3.
0
3.
0
3.
7
5.
6
6.
6
9.
4
9.
0
8.
7
8.
8
5.
6
5.
0
2.
9
2.
2
Paraphrase This Document
Need a fresh take? Get an instant paraphrase of this document with our AI Paraphraser
4HISTORY AND PRINCIPLES OF PUBLIC HEALTH
and
s
ne
01
Sto
rml
and
s
Su
bzo
ne
08
6.
3
6.
5
7.
2
7.
8
7.
5
6.
7
6.
0
5.
6
5.
9
6.
5
6.
7
5.
8
5.
4
5.
2
4.
0
2.
9
2.
1
1.
8
Sto
rml
and
s
Su
bzo
ne
12
5.
0
3.
4
2.
9
2.
8
8.
3
1
4.
8
1
5.
1
1
0.
0
7.
6
6.
4
5.
6
4.
6
4.
0
3.
4
2.
3
1.
6
1.
2
1.
1
Stormlands
Stormlands
Stormlands
Stormlands
Stormlands
Stormlands
Stormlands
Stormlands
Stormlands
Stormlands
Stormlands
Stormlands
Stormlands
Stormlands
0
20
40
60
80
100
120
140
160
Series1 Series2 Series3 Series4 Series5 Series6 Series7 Series8 Series9
Series10 Series11 Series12 Series13 Series14 Series15 Series16 Series17 Series18
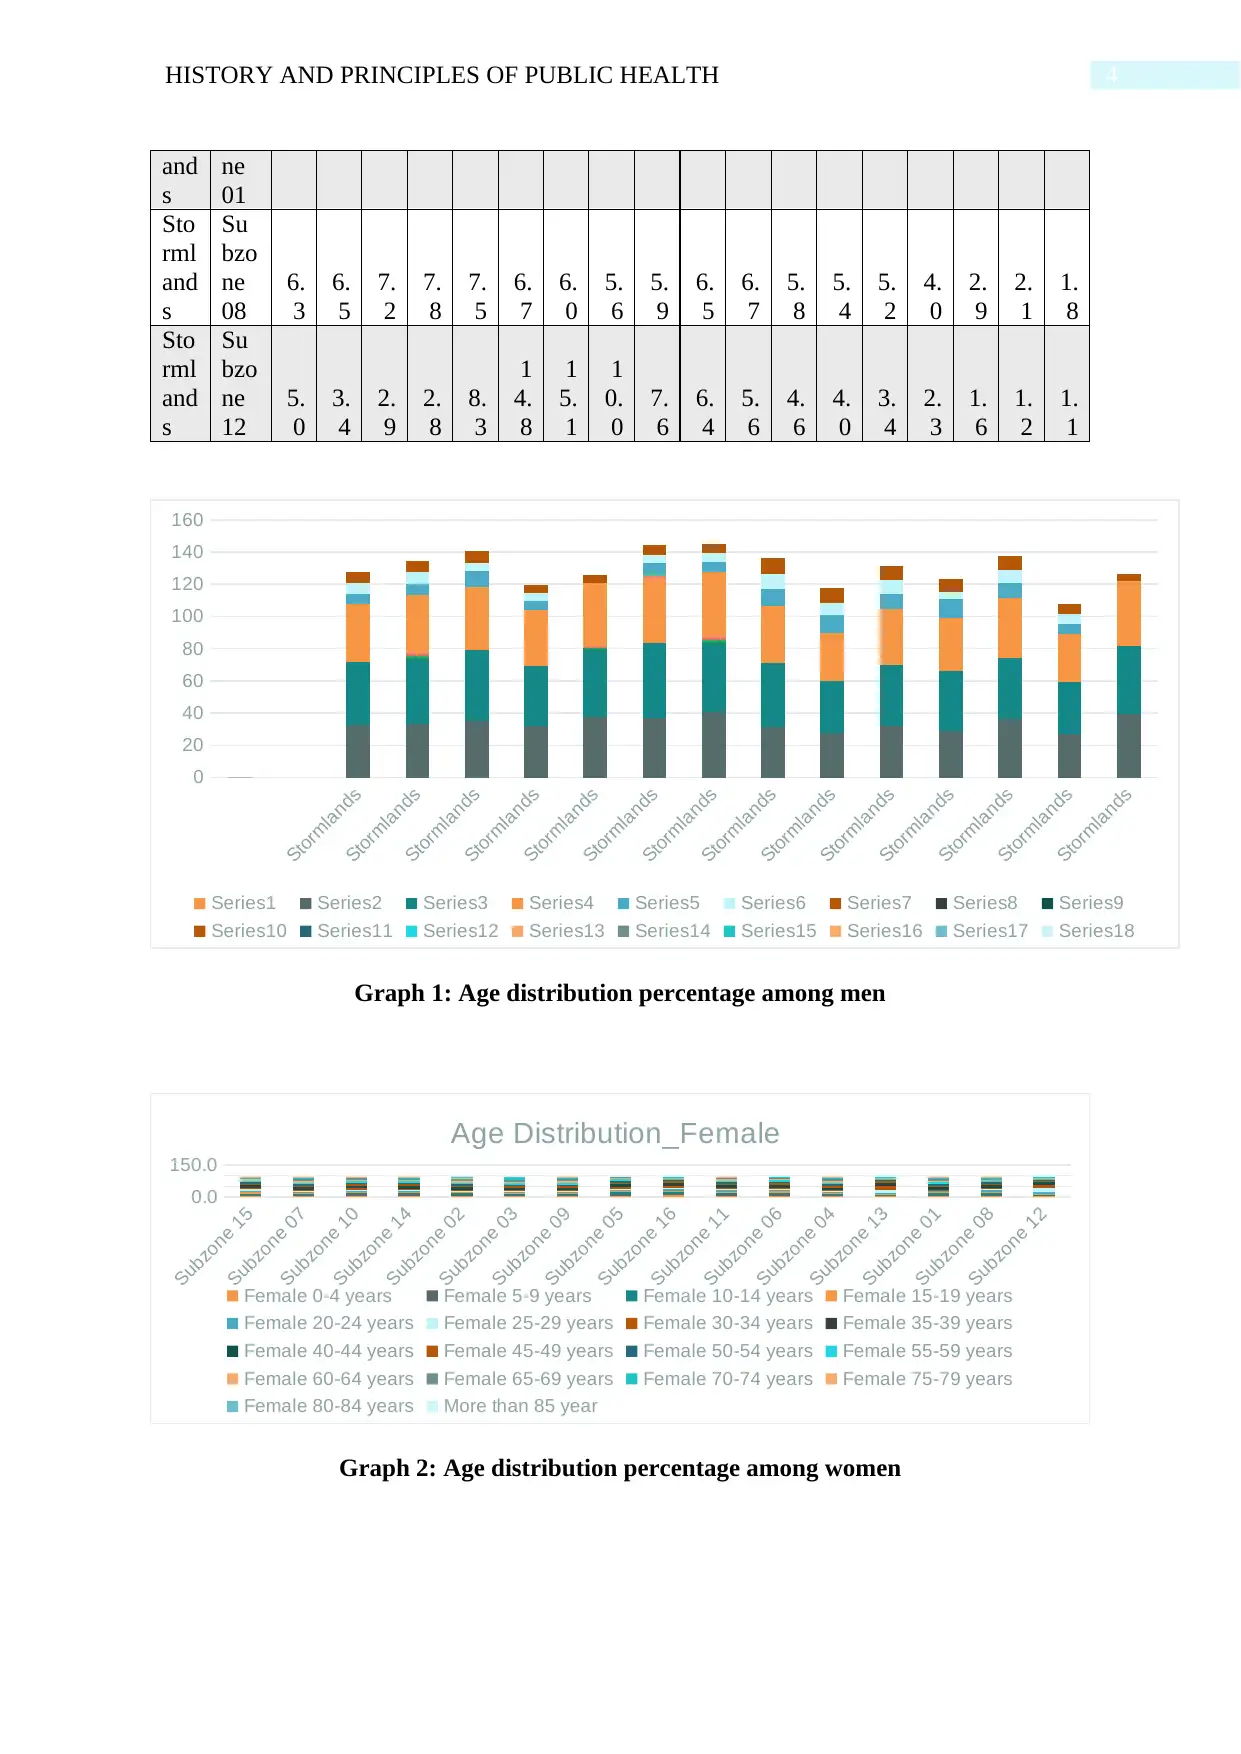
Graph 1: Age distribution percentage among men
Subzone 15
Subzone 07
Subzone 10
Subzone 14
Subzone 02
Subzone 03
Subzone 09
Subzone 05
Subzone 16
Subzone 11
Subzone 06
Subzone 04
Subzone 13
Subzone 01
Subzone 08
Subzone 12
0.0
150.0
Age Distribution_Female
Female 0-4 years Female 5-9 years Female 10-14 years Female 15-19 years
Female 20-24 years Female 25-29 years Female 30-34 years Female 35-39 years
Female 40-44 years Female 45-49 years Female 50-54 years Female 55-59 years
Female 60-64 years Female 65-69 years Female 70-74 years Female 75-79 years
Female 80-84 years More than 85 year
Graph 2: Age distribution percentage among women
and
s
ne
01
Sto
rml
and
s
Su
bzo
ne
08
6.
3
6.
5
7.
2
7.
8
7.
5
6.
7
6.
0
5.
6
5.
9
6.
5
6.
7
5.
8
5.
4
5.
2
4.
0
2.
9
2.
1
1.
8
Sto
rml
and
s
Su
bzo
ne
12
5.
0
3.
4
2.
9
2.
8
8.
3
1
4.
8
1
5.
1
1
0.
0
7.
6
6.
4
5.
6
4.
6
4.
0
3.
4
2.
3
1.
6
1.
2
1.
1
Stormlands
Stormlands
Stormlands
Stormlands
Stormlands
Stormlands
Stormlands
Stormlands
Stormlands
Stormlands
Stormlands
Stormlands
Stormlands
Stormlands
0
20
40
60
80
100
120
140
160
Series1 Series2 Series3 Series4 Series5 Series6 Series7 Series8 Series9
Series10 Series11 Series12 Series13 Series14 Series15 Series16 Series17 Series18
Graph 1: Age distribution percentage among men
Subzone 15
Subzone 07
Subzone 10
Subzone 14
Subzone 02
Subzone 03
Subzone 09
Subzone 05
Subzone 16
Subzone 11
Subzone 06
Subzone 04
Subzone 13
Subzone 01
Subzone 08
Subzone 12
0.0
150.0
Age Distribution_Female
Female 0-4 years Female 5-9 years Female 10-14 years Female 15-19 years
Female 20-24 years Female 25-29 years Female 30-34 years Female 35-39 years
Female 40-44 years Female 45-49 years Female 50-54 years Female 55-59 years
Female 60-64 years Female 65-69 years Female 70-74 years Female 75-79 years
Female 80-84 years More than 85 year
Graph 2: Age distribution percentage among women
5HISTORY AND PRINCIPLES OF PUBLIC HEALTH
% of Indigenous people
Subzone 15 Subzone 07 Subzone 10 Subzone 14
Subzone 02 Subzone 03 Subzone 09 Subzone 05
Subzone 16 Subzone 11 Subzone 06 Subzone 04
Subzone 13 Subzone 01 Subzone 08 Subzone 12
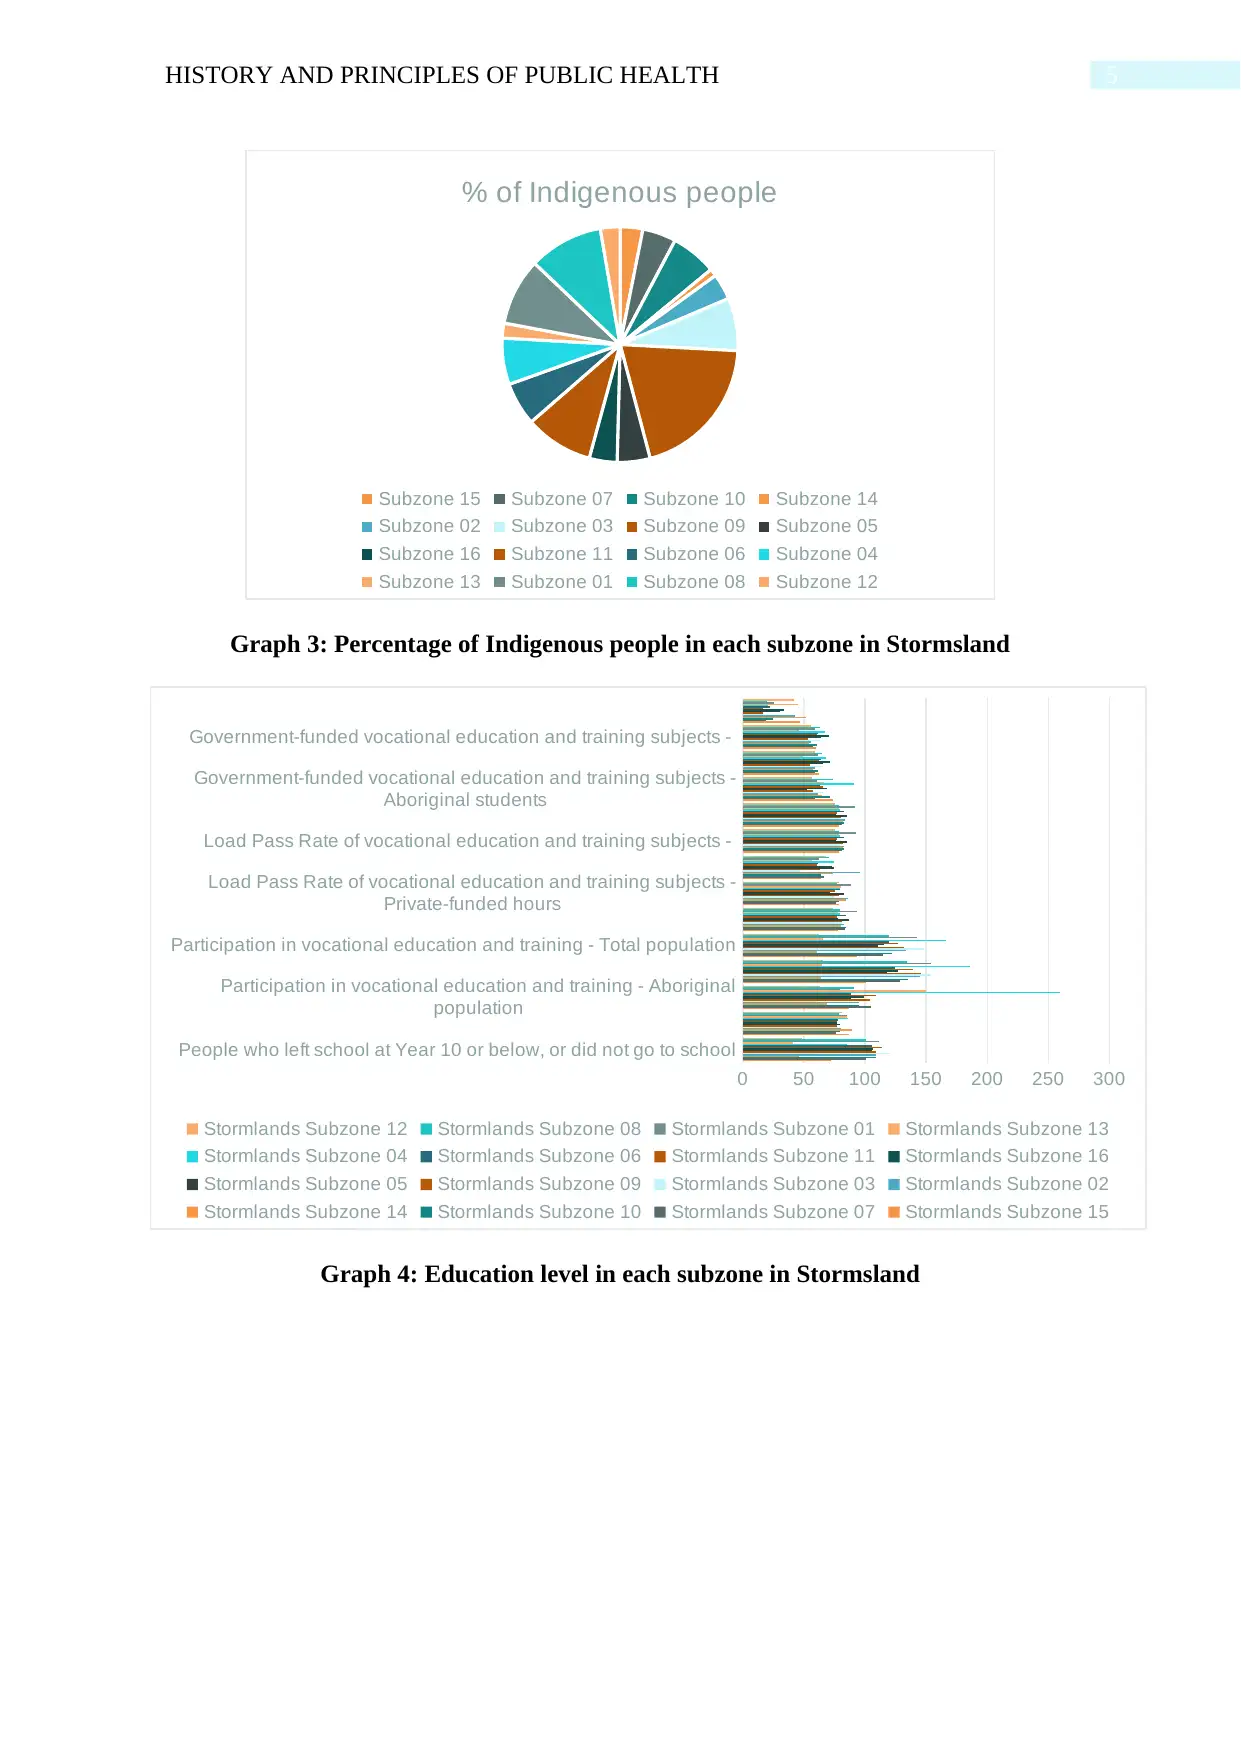
Graph 3: Percentage of Indigenous people in each subzone in Stormsland
People who left school at Year 10 or below, or did not go to school
Participation in vocational education and training - Aboriginal
population
Participation in vocational education and training - Total population
Load Pass Rate of vocational education and training subjects -
Private-funded hours
Load Pass Rate of vocational education and training subjects -
Government-funded vocational education and training subjects -
Aboriginal students
Government-funded vocational education and training subjects -
0 50 100 150 200 250 300
Stormlands Subzone 12 Stormlands Subzone 08 Stormlands Subzone 01 Stormlands Subzone 13
Stormlands Subzone 04 Stormlands Subzone 06 Stormlands Subzone 11 Stormlands Subzone 16
Stormlands Subzone 05 Stormlands Subzone 09 Stormlands Subzone 03 Stormlands Subzone 02
Stormlands Subzone 14 Stormlands Subzone 10 Stormlands Subzone 07 Stormlands Subzone 15
Graph 4: Education level in each subzone in Stormsland
% of Indigenous people
Subzone 15 Subzone 07 Subzone 10 Subzone 14
Subzone 02 Subzone 03 Subzone 09 Subzone 05
Subzone 16 Subzone 11 Subzone 06 Subzone 04
Subzone 13 Subzone 01 Subzone 08 Subzone 12
Graph 3: Percentage of Indigenous people in each subzone in Stormsland
People who left school at Year 10 or below, or did not go to school
Participation in vocational education and training - Aboriginal
population
Participation in vocational education and training - Total population
Load Pass Rate of vocational education and training subjects -
Private-funded hours
Load Pass Rate of vocational education and training subjects -
Government-funded vocational education and training subjects -
Aboriginal students
Government-funded vocational education and training subjects -
0 50 100 150 200 250 300
Stormlands Subzone 12 Stormlands Subzone 08 Stormlands Subzone 01 Stormlands Subzone 13
Stormlands Subzone 04 Stormlands Subzone 06 Stormlands Subzone 11 Stormlands Subzone 16
Stormlands Subzone 05 Stormlands Subzone 09 Stormlands Subzone 03 Stormlands Subzone 02
Stormlands Subzone 14 Stormlands Subzone 10 Stormlands Subzone 07 Stormlands Subzone 15
Graph 4: Education level in each subzone in Stormsland
⊘ This is a preview!⊘
Do you want full access?
Subscribe today to unlock all pages.
Trusted by 1+ million students worldwide
6HISTORY AND PRINCIPLES OF PUBLIC HEALTH
Participation in the
NBCSP, males
Participation in the
NBCSP, females Participation in the NBCSP, persons
NBCSP: positive screening
result, males
NBCSP: positive
screening result,
NBCSP: positive
screening result,
StormlandsSubzone 15 32.6 39.2 36.0 6.0 7.1 6.6
StormlandsSubzone 07 33.1 42.4 37.8 6.5 7.5 7.1
StormlandsSubzone 10 35.1 43.8 39.5 9.6 5.4 7.3
StormlandsSubzone 14 32.0 37.2 34.6 6.1 4.5 5.2
StormlandsSubzone 02 37.5 42.9 40.2 .. .. 5.2
StormlandsSubzone 03 36.6 46.9 41.7 8.2 4.6 6.3
StormlandsSubzone 09 40.7 44.4 42.6 5.9 5.8 5.8
StormlandsSubzone 05 31.5 39.3 35.4 10.9 9.1 9.9
StormlandsSubzone 16 27.8 32.0 30.0 11.0 7.8 9.3
StormlandsSubzone 11 31.8 37.9 34.9 9.4 8.3 8.8
StormlandsSubzone 06 28.7 37.3 32.9 11.7 4.6 7.8
StormlandsSubzone 04 36.0 38.4 37.2 9.3 7.9 8.6
StormlandsSubzone 13 26.9 32.4 29.6 6.1 6.2 6.2
StormlandsSubzone 01 39.2 42.1 40.6 .. .. 4.5
StormlandsSubzone 08 34.9 40.5 37.8 6.2 6.9 6.6
StormlandsSubzone 12 32.2 36.8 34.5 7.3 4.8 6.0
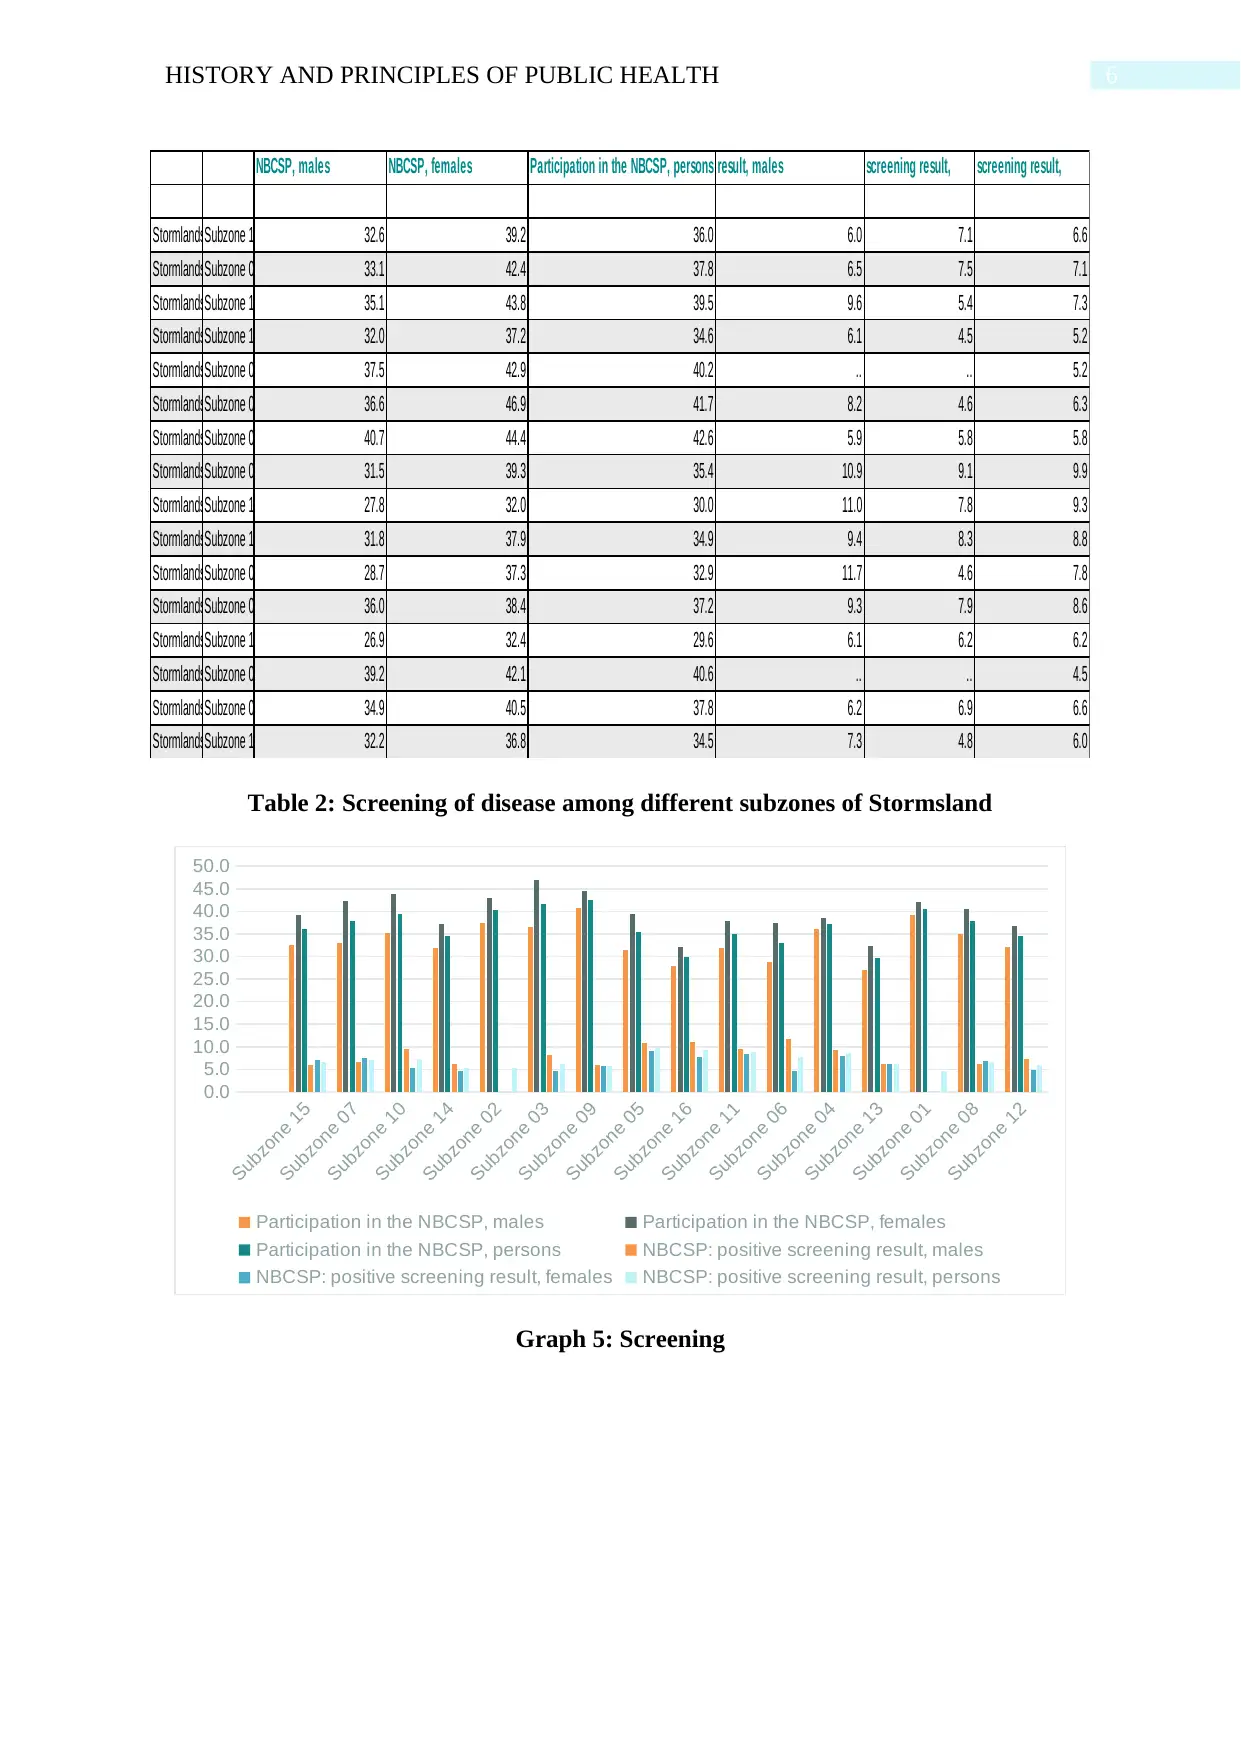
Table 2: Screening of disease among different subzones of Stormsland
Subzone 15
Subzone 07
Subzone 10
Subzone 14
Subzone 02
Subzone 03
Subzone 09
Subzone 05
Subzone 16
Subzone 11
Subzone 06
Subzone 04
Subzone 13
Subzone 01
Subzone 08
Subzone 12
0.0
5.0
10.0
15.0
20.0
25.0
30.0
35.0
40.0
45.0
50.0
Participation in the NBCSP, males Participation in the NBCSP, females
Participation in the NBCSP, persons NBCSP: positive screening result, males
NBCSP: positive screening result, females NBCSP: positive screening result, persons
Graph 5: Screening
Participation in the
NBCSP, males
Participation in the
NBCSP, females Participation in the NBCSP, persons
NBCSP: positive screening
result, males
NBCSP: positive
screening result,
NBCSP: positive
screening result,
StormlandsSubzone 15 32.6 39.2 36.0 6.0 7.1 6.6
StormlandsSubzone 07 33.1 42.4 37.8 6.5 7.5 7.1
StormlandsSubzone 10 35.1 43.8 39.5 9.6 5.4 7.3
StormlandsSubzone 14 32.0 37.2 34.6 6.1 4.5 5.2
StormlandsSubzone 02 37.5 42.9 40.2 .. .. 5.2
StormlandsSubzone 03 36.6 46.9 41.7 8.2 4.6 6.3
StormlandsSubzone 09 40.7 44.4 42.6 5.9 5.8 5.8
StormlandsSubzone 05 31.5 39.3 35.4 10.9 9.1 9.9
StormlandsSubzone 16 27.8 32.0 30.0 11.0 7.8 9.3
StormlandsSubzone 11 31.8 37.9 34.9 9.4 8.3 8.8
StormlandsSubzone 06 28.7 37.3 32.9 11.7 4.6 7.8
StormlandsSubzone 04 36.0 38.4 37.2 9.3 7.9 8.6
StormlandsSubzone 13 26.9 32.4 29.6 6.1 6.2 6.2
StormlandsSubzone 01 39.2 42.1 40.6 .. .. 4.5
StormlandsSubzone 08 34.9 40.5 37.8 6.2 6.9 6.6
StormlandsSubzone 12 32.2 36.8 34.5 7.3 4.8 6.0
Table 2: Screening of disease among different subzones of Stormsland
Subzone 15
Subzone 07
Subzone 10
Subzone 14
Subzone 02
Subzone 03
Subzone 09
Subzone 05
Subzone 16
Subzone 11
Subzone 06
Subzone 04
Subzone 13
Subzone 01
Subzone 08
Subzone 12
0.0
5.0
10.0
15.0
20.0
25.0
30.0
35.0
40.0
45.0
50.0
Participation in the NBCSP, males Participation in the NBCSP, females
Participation in the NBCSP, persons NBCSP: positive screening result, males
NBCSP: positive screening result, females NBCSP: positive screening result, persons
Graph 5: Screening
Paraphrase This Document
Need a fresh take? Get an instant paraphrase of this document with our AI Paraphraser
7HISTORY AND PRINCIPLES OF PUBLIC HEALTH
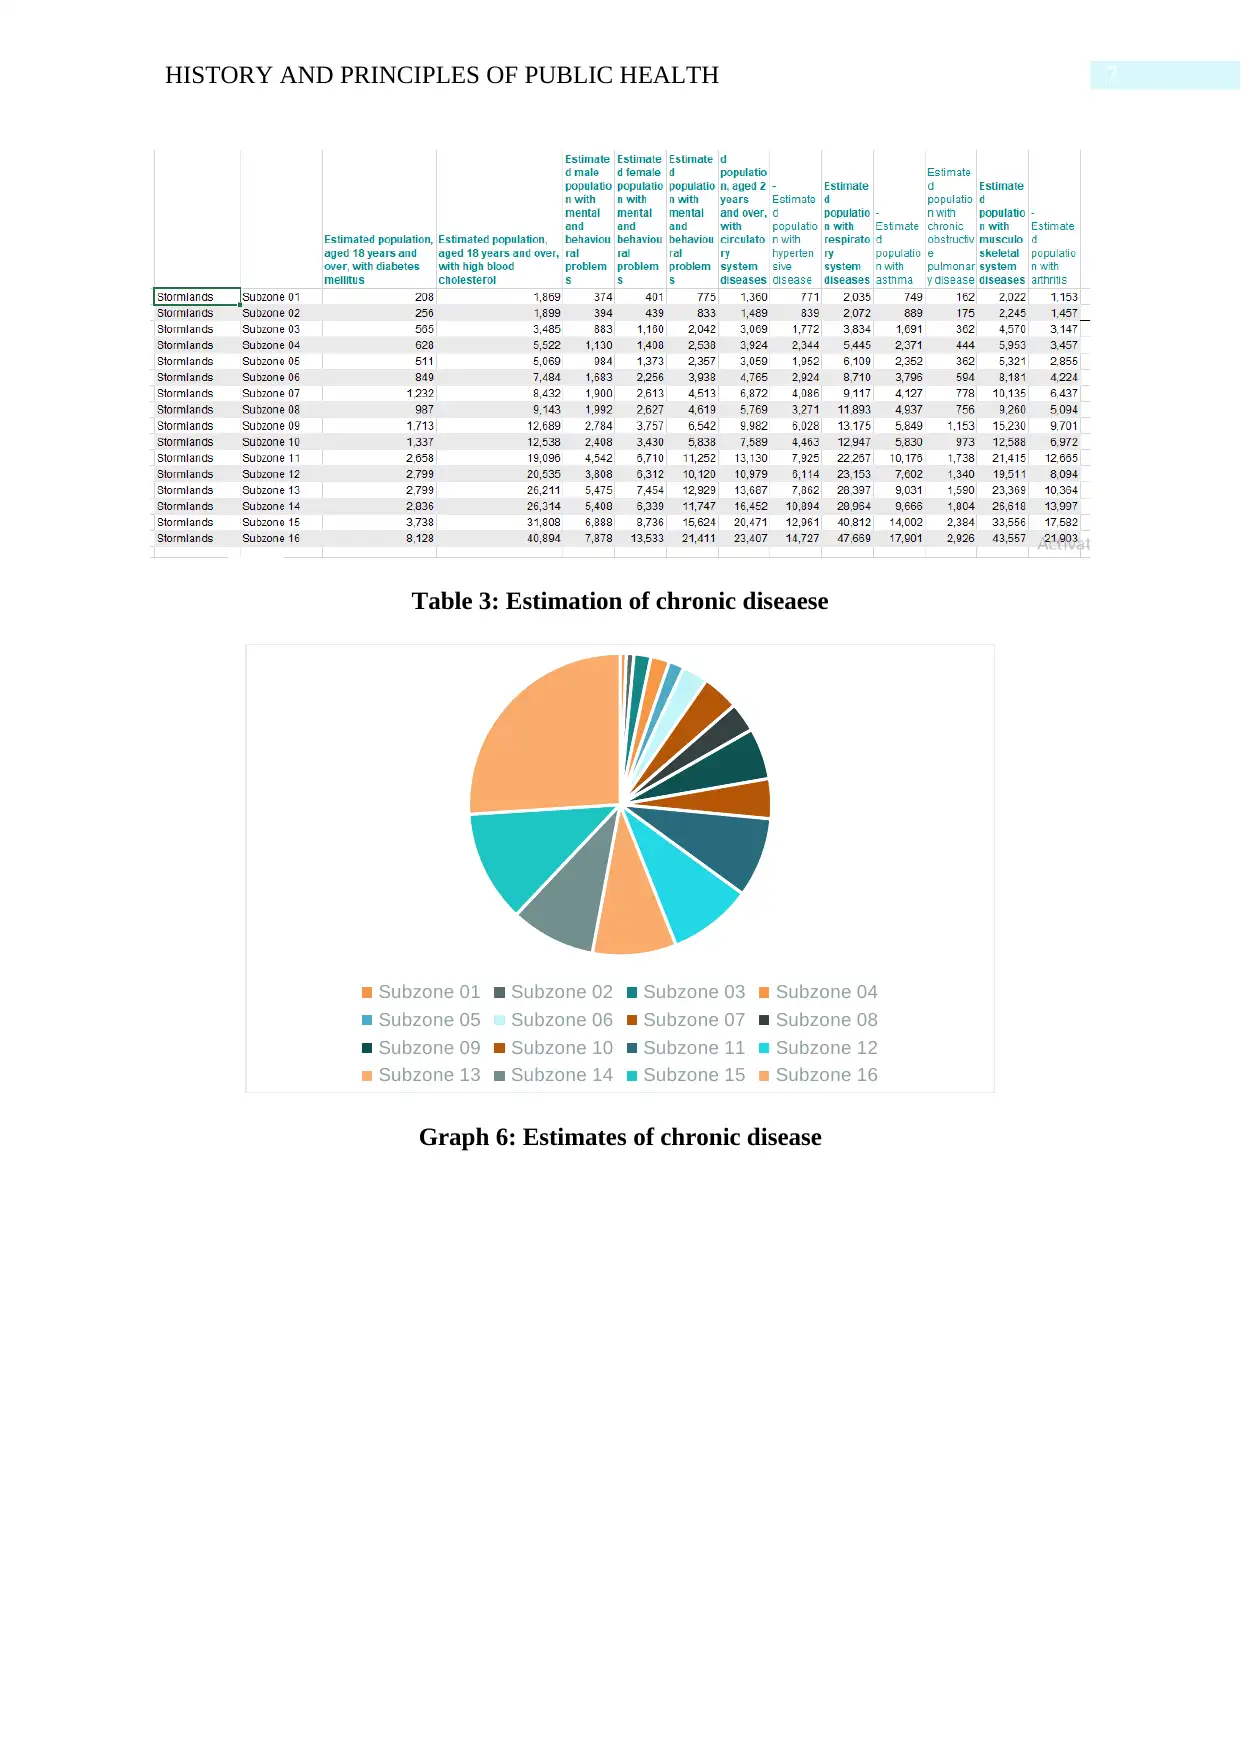
Table 3: Estimation of chronic diseaese
Subzone 01 Subzone 02 Subzone 03 Subzone 04
Subzone 05 Subzone 06 Subzone 07 Subzone 08
Subzone 09 Subzone 10 Subzone 11 Subzone 12
Subzone 13 Subzone 14 Subzone 15 Subzone 16
Graph 6: Estimates of chronic disease
Table 3: Estimation of chronic diseaese
Subzone 01 Subzone 02 Subzone 03 Subzone 04
Subzone 05 Subzone 06 Subzone 07 Subzone 08
Subzone 09 Subzone 10 Subzone 11 Subzone 12
Subzone 13 Subzone 14 Subzone 15 Subzone 16
Graph 6: Estimates of chronic disease
8HISTORY AND PRINCIPLES OF PUBLIC HEALTH
12%
4%
5%
6%
1%
2%
6%
2%
24%
11%
4%
2%
10%
1%
4%
8%
Subzone 15
Subzone 07
Subzone 10
Subzone 14
Subzone 02
Subzone 03
Subzone 09
Subzone 05
Subzone 16
Subzone 11
Subzone 06
Subzone 04
Subzone 13
Subzone 01
Subzone 08
Subzone 12
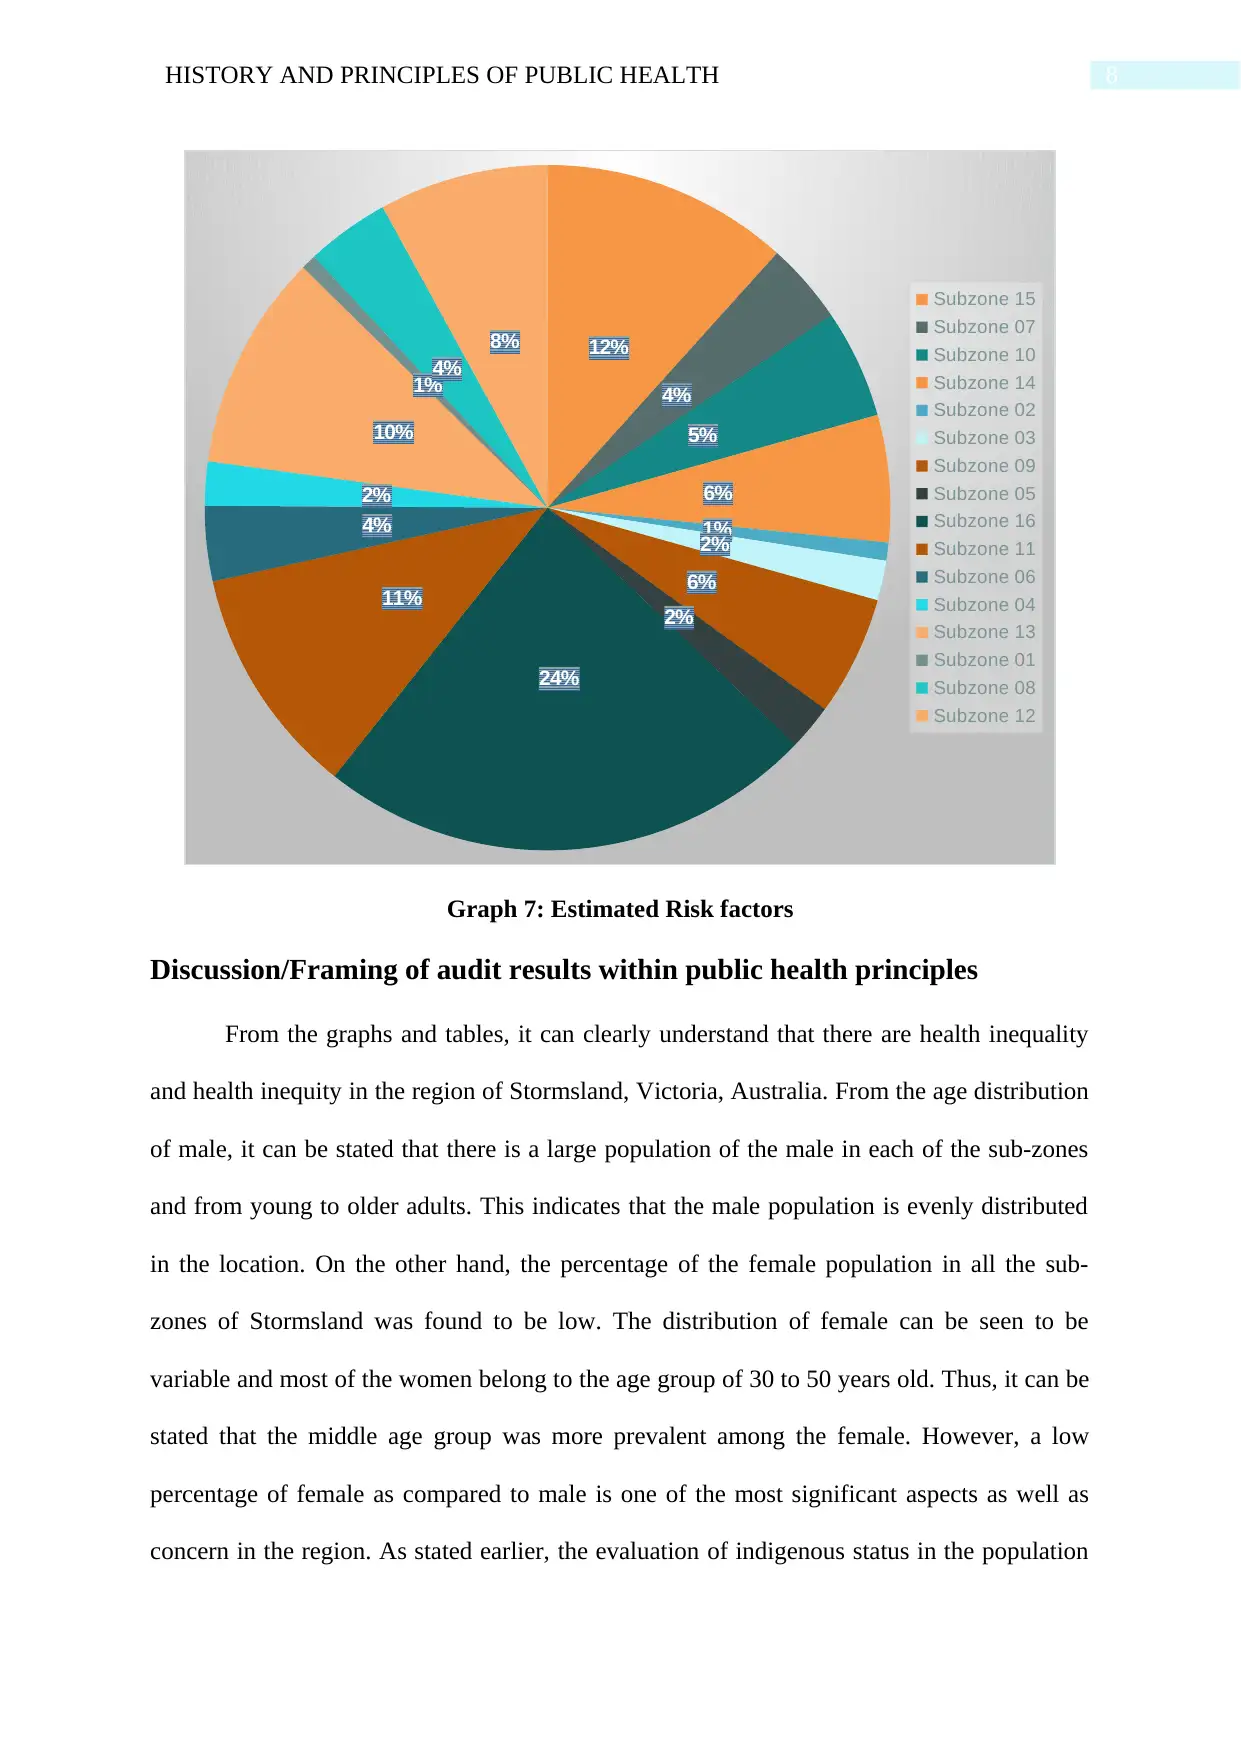
Graph 7: Estimated Risk factors
Discussion/Framing of audit results within public health principles
From the graphs and tables, it can clearly understand that there are health inequality
and health inequity in the region of Stormsland, Victoria, Australia. From the age distribution
of male, it can be stated that there is a large population of the male in each of the sub-zones
and from young to older adults. This indicates that the male population is evenly distributed
in the location. On the other hand, the percentage of the female population in all the sub-
zones of Stormsland was found to be low. The distribution of female can be seen to be
variable and most of the women belong to the age group of 30 to 50 years old. Thus, it can be
stated that the middle age group was more prevalent among the female. However, a low
percentage of female as compared to male is one of the most significant aspects as well as
concern in the region. As stated earlier, the evaluation of indigenous status in the population
12%
4%
5%
6%
1%
2%
6%
2%
24%
11%
4%
2%
10%
1%
4%
8%
Subzone 15
Subzone 07
Subzone 10
Subzone 14
Subzone 02
Subzone 03
Subzone 09
Subzone 05
Subzone 16
Subzone 11
Subzone 06
Subzone 04
Subzone 13
Subzone 01
Subzone 08
Subzone 12
Graph 7: Estimated Risk factors
Discussion/Framing of audit results within public health principles
From the graphs and tables, it can clearly understand that there are health inequality
and health inequity in the region of Stormsland, Victoria, Australia. From the age distribution
of male, it can be stated that there is a large population of the male in each of the sub-zones
and from young to older adults. This indicates that the male population is evenly distributed
in the location. On the other hand, the percentage of the female population in all the sub-
zones of Stormsland was found to be low. The distribution of female can be seen to be
variable and most of the women belong to the age group of 30 to 50 years old. Thus, it can be
stated that the middle age group was more prevalent among the female. However, a low
percentage of female as compared to male is one of the most significant aspects as well as
concern in the region. As stated earlier, the evaluation of indigenous status in the population
⊘ This is a preview!⊘
Do you want full access?
Subscribe today to unlock all pages.
Trusted by 1+ million students worldwide
9HISTORY AND PRINCIPLES OF PUBLIC HEALTH
of Australia is one of the vital assessment in term of Health and wellbeing (Priest et al.,
2016). On close review, it was found that subzone 9 and 11 are densely populated with
indigenous people as compared to others. The indigenous people are observed to reside in all
over Stormsland however, the percentage of these people significantly less in other sub-
zones. From the assessment of education in the area, it was found that the people belonging to
subzone 3 had a large number of people that had Government-funded vocational education
and training subjects, especially among both indigenous and non-indigenous people. In
subzone 2, 4, 14 and 15, the school leaving participants that had not completed higher
education was higher than compared to other zones. Thus, it can be stated that the education
quality or the basic education level in other zones were higher as compared to the four
subzones. This was an important and critical piece of information that highlights the
provision of inadequate healthcare services and limitation to access to healthcare in various
part of the Stormsland. From the study of Jiang et al. (2019), it was noted that there are two
significant reasons that hinder the health equality aspect. The first reason was as stated the
educational level among the population of the region. When people have a minimum degree
or educational qualification, they are more open to the world and thus, are able to know the
primary healthcare facilities that may help them to have an optimal outcome which on the
other hand, cannot be found. The second factor is the belief, attitude and outlook toward
modern healthcare sector, which is not a positive and encouraging in nature. However, this
area is found to be more open and acceptable in term of healthcare.
From screening graph 5, it can be found that the process of screening of various kinds
of disease was not even 50% among all of the subzones in the region. The highest screening
among the total population in each region was found to be 42.1% in subzone 9, whereas the
lowest was 29.6% in subzone 13. Another interesting finding that was observed in this case
that the female screening process was more in comparison to males. Due to the low
Paraphrase This Document
Need a fresh take? Get an instant paraphrase of this document with our AI Paraphraser
10HISTORY AND PRINCIPLES OF PUBLIC HEALTH
percentage of the total screening process, it is evident that the percentage of positive was low
in all the cases. The estimation of chronic disease was one of the fascinating information that
was found in this study. It was found that the number of any disease was low in subzone 1
and subsequently increased in the next subzone. One of the reasons for this fact was the
population that was found to be low in subzone 1 and highest in case of subzone 16. Another
factor that can be taken into consideration was the low amount of screening in subzone 1 that
may have lead to such data; however, it can be proved as the data in screening table indicates
that the lowest screening was done in subzone 13. Thus, further investigation in this data
needs to be done as it is one of the most significant aspects that clearly indicates that
healthcare inequality is more ins subzone 1 and less in subzone 16. From the risk factor
graph, it can be found that the risk factors of various disorders were highest in case of
subzone 6 where the percentage was 24% followed by subzone 15 where the percentage was
12%. The risk factors that may be leading to various kinds of diseases include smoking habit,
drinking habit, active lifestyle, the percentage of old people in the subzone, genetic factors,
lack of healthcare knowledge, low healthcare facilities and services that do not allow the
people to have awareness about health and related information and the community
engagement aspects (Khaled, Makdissi & Yazbeck, 2018). It can be stated from this study
that the Stormsland have a well-balanced healthcare sector, however, due to its large size, it
has not been able to offer high-quality services in all parts of the region. According to
Pollard, Begley and Landrigan (2016), it can be stated that health inequalities are found to be
going against the principles of social justice. This is because in some instances these are
unavoiadable in nature and it occur not because of random occurrence or by chance, they are
occurring due to intention. As found in a study, the discrimination among the indigenous
people in Australia is increase at a high rate. This cannot be stated to be an event that occur
due to mere chance. The non-indigenous people are not comfortable and the discrimination in
11HISTORY AND PRINCIPLES OF PUBLIC HEALTH
this case are found to be in all the areas of life, education, workplace and healthcare (Bourke
& Veerman, 2018). These are stated to be social determined and are largely beyond the
control of an individual (Australian Institute of Health and Welfare, 2018). Thus, it affects
most the disadvantaged people and thus, restrict the possibilities of living a healthier and
longer lives. In a study, it was found that the people belong to indigenous community have a
shorter lifespan as compared to others residing in Australia (Bond & Singh, 2020). This can
be one of the reason because of which, the population rate in the indigenous people was less
as compared to other subzones in Stormsland. This can be the reasons because of which the
subzones with more indigenous people have an higher estimated health risk in comparsion to
other subszones.
From the findings using the Health Equality Audit tool, it can be stated that there are
three fundamental factors that affects the health equality in the Stormsland, Victoria. The first
factor is the fundamentak causse that involve the global economic impact, political aspects,
macro socio-politucal environment, societal values related to fairness and equity, unequal
distribution of power, wealth and income, marginalisation of poverty and discrimination.
Western and Tomaszewski (2016) opined that the second factor is the wide environmental
experience that has an impact on the mindset of the people. These include services available,
economic and work status, physical aspects and social and cultural background. Were et al.
(2018) opined that even though these may be seem to be insignificant in nature as they do not
have a direct impact however, the deep understanding of the attributes being analysed helped
in gaining the impact of these element in health inequality in the region. The third aspect is
individualised experience that include similar elements however on the basis on an
indivdual’s perception. this help in shaping the mindset and the development stages of a
person thaus, the ability and the accessibility to healthcare services and facilities are highly
dependable in this aspect.
⊘ This is a preview!⊘
Do you want full access?
Subscribe today to unlock all pages.
Trusted by 1+ million students worldwide
1 out of 16
Related Documents


Your All-in-One AI-Powered Toolkit for Academic Success.
+13062052269
info@desklib.com
Available 24*7 on WhatsApp / Email
![[object Object]](/_next/static/media/star-bottom.7253800d.svg)
Unlock your academic potential
Copyright © 2020–2026 A2Z Services. All Rights Reserved. Developed and managed by ZUCOL.