PUBH610 Health Inequalities Audit Report: Victoria Subzones Analysis
VerifiedAdded on 2023/04/08
|11
|2972
|371
Report
AI Summary
This report presents a health inequalities audit conducted for 14 subzones within Victoria, Australia, sponsored by the Victorian Government’s Department of Health. The audit utilizes data and tools from the United Kingdom's NHS to monitor and report health inequalities, improve measurement methods, and enhance data accessibility. The report analyzes over ten indicators of health determinants and social status, including age distribution, indigenous status, birthplace, education, and access to services. Findings highlight disparities across subzones and demographic groups, emphasizing the impact of social, economic, and political imbalances on health equity in Victoria. The report aims to inform policy and interventions to reduce health inequalities and promote equitable access to services.
VICTORIA
Health Inequalities Report
Abstract
This article is a report which is sponsored by Victorian government’s department of health. The
main purpose of this project was to perform health inequality audit of 14 geographical subzones
within Victoria. In collaboration with data and information from the United Kingdom and NHS
while also using their health inequalities data tools.
The major aims of this health inequality audit include; monitoring and reporting health
inequalities in Victoria through improved access to information, strengthen the methods of
measurement of this inequalities in the objective making data and development resources easily
accessible.
This reports presents results and charts for over 10 main indictors of determinants of health and
main social status indicators.
Background
Health Inequalities Audit
The Health Inequalities Audit is a useful information that is usually used by professionals,
agencies and governments in understanding the health inequalities agenda which shapes and sets
a foundation for determination of ways of implementation economic, political and social
agendas. This kind of data and analysis is used extensively in setting discussions on policies and
programs within and without health sector in governments which promotes setting of strategies
and action on health inequalities in said populations.
The Health Inequalities Audit, usually, is not a legislative process but this is incorporated
together with other policy areas in reformations and impacts of this policies on health.
The study was done in Victoria for 14 subzones. The report also included borrowed data from
the government of UK such as health inequalities tool and the health audit cycle was sourced
from the NHS database.
This report is going to help in legislation of policies and thereafter implementation of the same
policies in realization of improved health services and reducing social inequalities.
Paraphrase This Document
Need a fresh take? Get an instant paraphrase of this document with our AI Paraphraser
Introduction
Victoria is one of the most developed nation and the Victorians are deemed as among the most
contented and healthiest citizens. However, as this reports and the analysis of the inequality audit
shows the benefits are enjoyed by all citizens. (Sheena Asthana, 2006) These benefits include
access to education, housing, transport, care for the aged, access to services among others.
The inequalities have been always reported even when the country’s annual report showed
promising data and trends. It has been noted that these inequalities have been as a result of pro
longed social, economic and political imbalances in Victoria. These imbalances have impacted
the efforts put forward by both Australian government and Australian themselves in realizing
good health and reducing the gaps witnessed in this audit.
This report puts forward the level and distribution of health inequalities in Victoria and proposes
a range of steps to be taken to advance health equity in Victoria. (David Bencheon, 2006)
Some of the factors that have been used in developing these health inequalities in Victoria
include; education, occupation, indigenous identity, employment, internet access, employment,
age, sex among many others.
Methods
In this report we used;
1. Data from the UK National Health Services, health equity audit tool. (House of
Commons, Health Committee, 2006)
2. VicHealth, Fair foundations framework data.
The final analysis comprised of some calculations and tabulations which helped in determination
of ratios and percentages as it was clearly shown in the excell sheet an tables. This data
comprises of over 50 fields including age, gender, country of birth,access to basic services,
acccess to education, transport among many more. The records includes all persons who took
part in this exercise. The records included in the extract were for all patients who were eligible
for a health at the time of the extract, or who had received a health check within the last five
years. These might include cases who of persons who had since become ineligible for a further
check as a result of a diagnosis or statin prescription or being identified as high risk. The reason
for including the latter was in order not to exclude successful outcomes of the health check
process, and to provide the most representative denominator for calculating proportions for
invitations and
assessments.
Health Equity Audit Cycle
(S. Bewley, 2015)
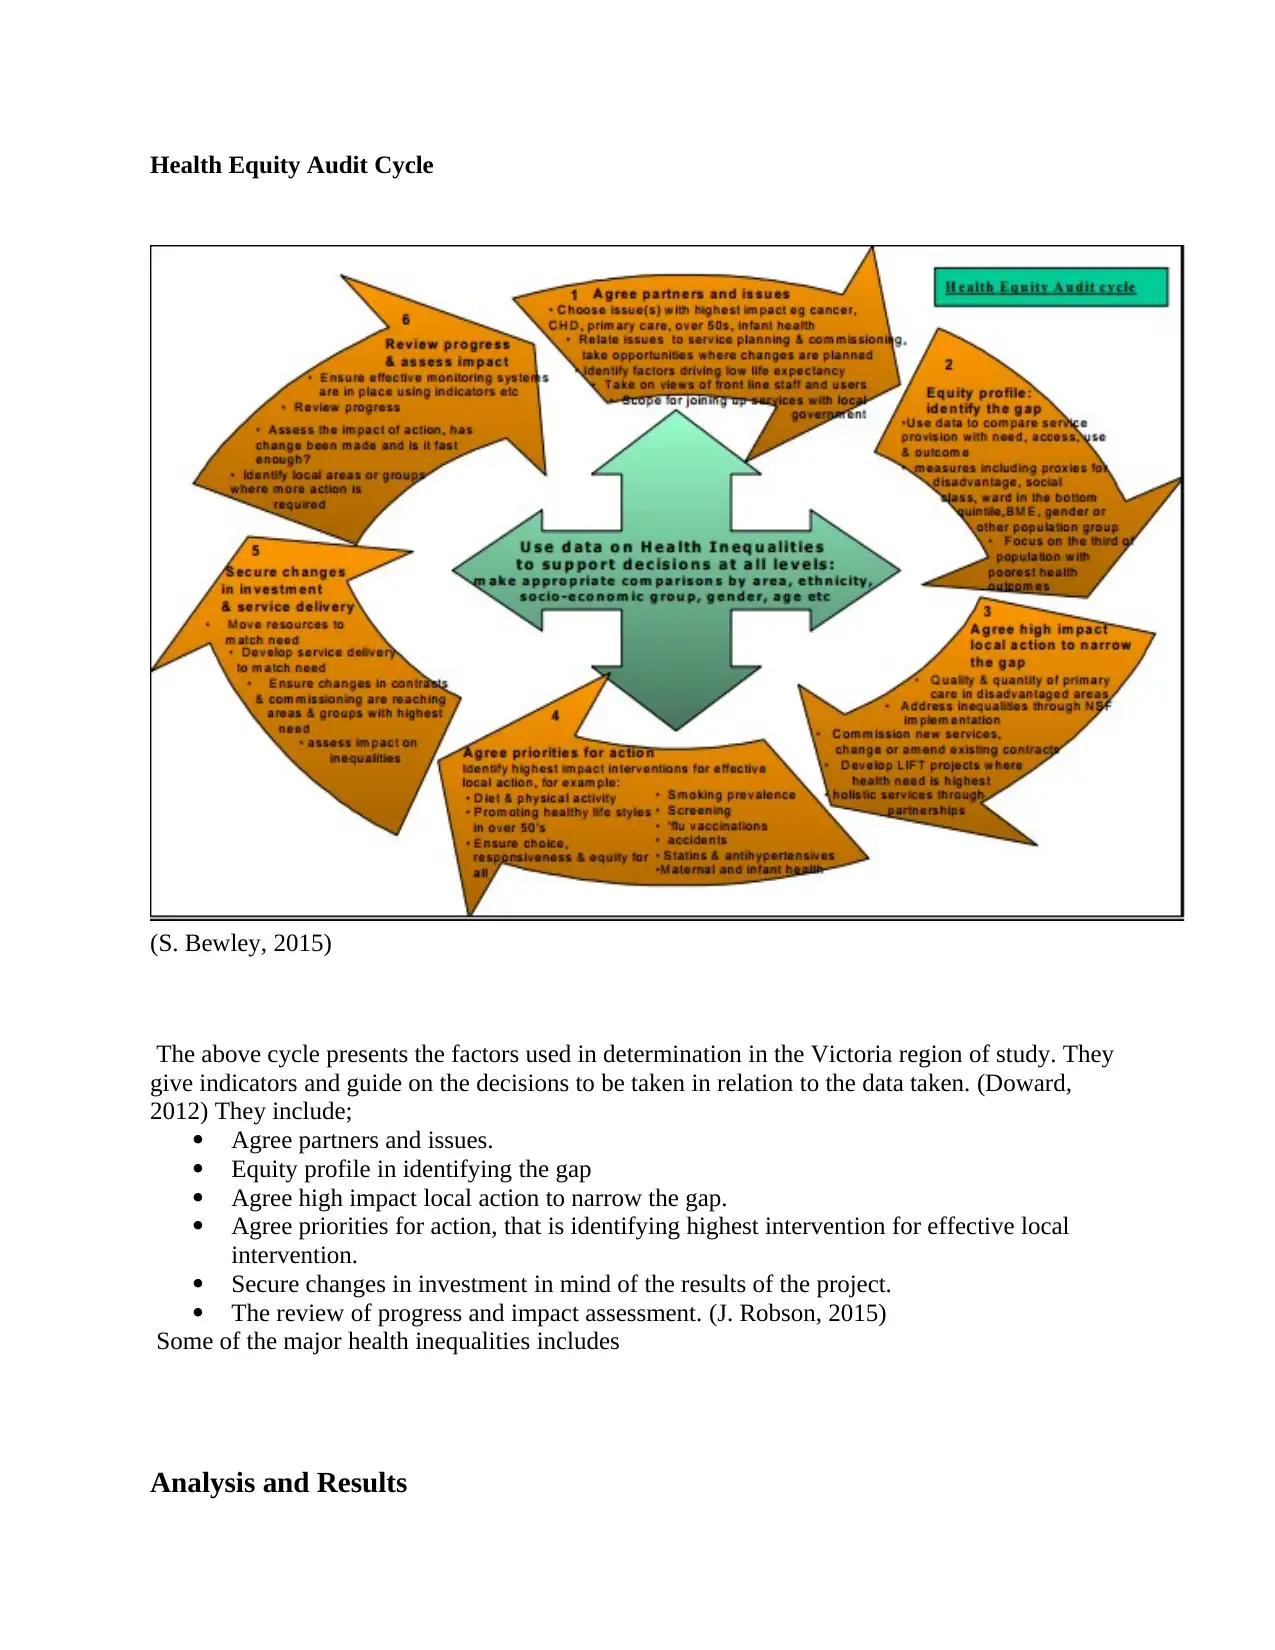
The above cycle presents the factors used in determination in the Victoria region of study. They
give indicators and guide on the decisions to be taken in relation to the data taken. (Doward,
2012) They include;
Agree partners and issues.
Equity profile in identifying the gap
Agree high impact local action to narrow the gap.
Agree priorities for action, that is identifying highest intervention for effective local
intervention.
Secure changes in investment in mind of the results of the project.
The review of progress and impact assessment. (J. Robson, 2015)
Some of the major health inequalities includes
Analysis and Results
(S. Bewley, 2015)
The above cycle presents the factors used in determination in the Victoria region of study. They
give indicators and guide on the decisions to be taken in relation to the data taken. (Doward,
2012) They include;
Agree partners and issues.
Equity profile in identifying the gap
Agree high impact local action to narrow the gap.
Agree priorities for action, that is identifying highest intervention for effective local
intervention.
Secure changes in investment in mind of the results of the project.
The review of progress and impact assessment. (J. Robson, 2015)
Some of the major health inequalities includes
Analysis and Results
⊘ This is a preview!⊘
Do you want full access?
Subscribe today to unlock all pages.
Trusted by 1+ million students worldwide
Subzone 02
Subzone 15
Subzone 14
Subzone 16
Subzone 09
Subzone 07
Subzone 09
Subzone 13
Subzone 11
Subzone 10
Subzone 10
Subzone 06
Subzone 11
Subzone 13
Subzone 11
Subzone 09
Subzone 15
Subzone 14
Subzone 04
Subzone 02
Subzone 01
Subzone 10
Subzone 04
Subzone 08
Subzone 16
Subzone 14
Subzone 02
0
50,000
100,000
150,000
200,000
250,000
300,000
350,000
Age Distribution Of Persons (Broad)
Persons, 0-14 years 2015 ERP Number Persons, 0-14 years 2015 ERP Total persons
Persons, 0-14 years 2015 ERP %
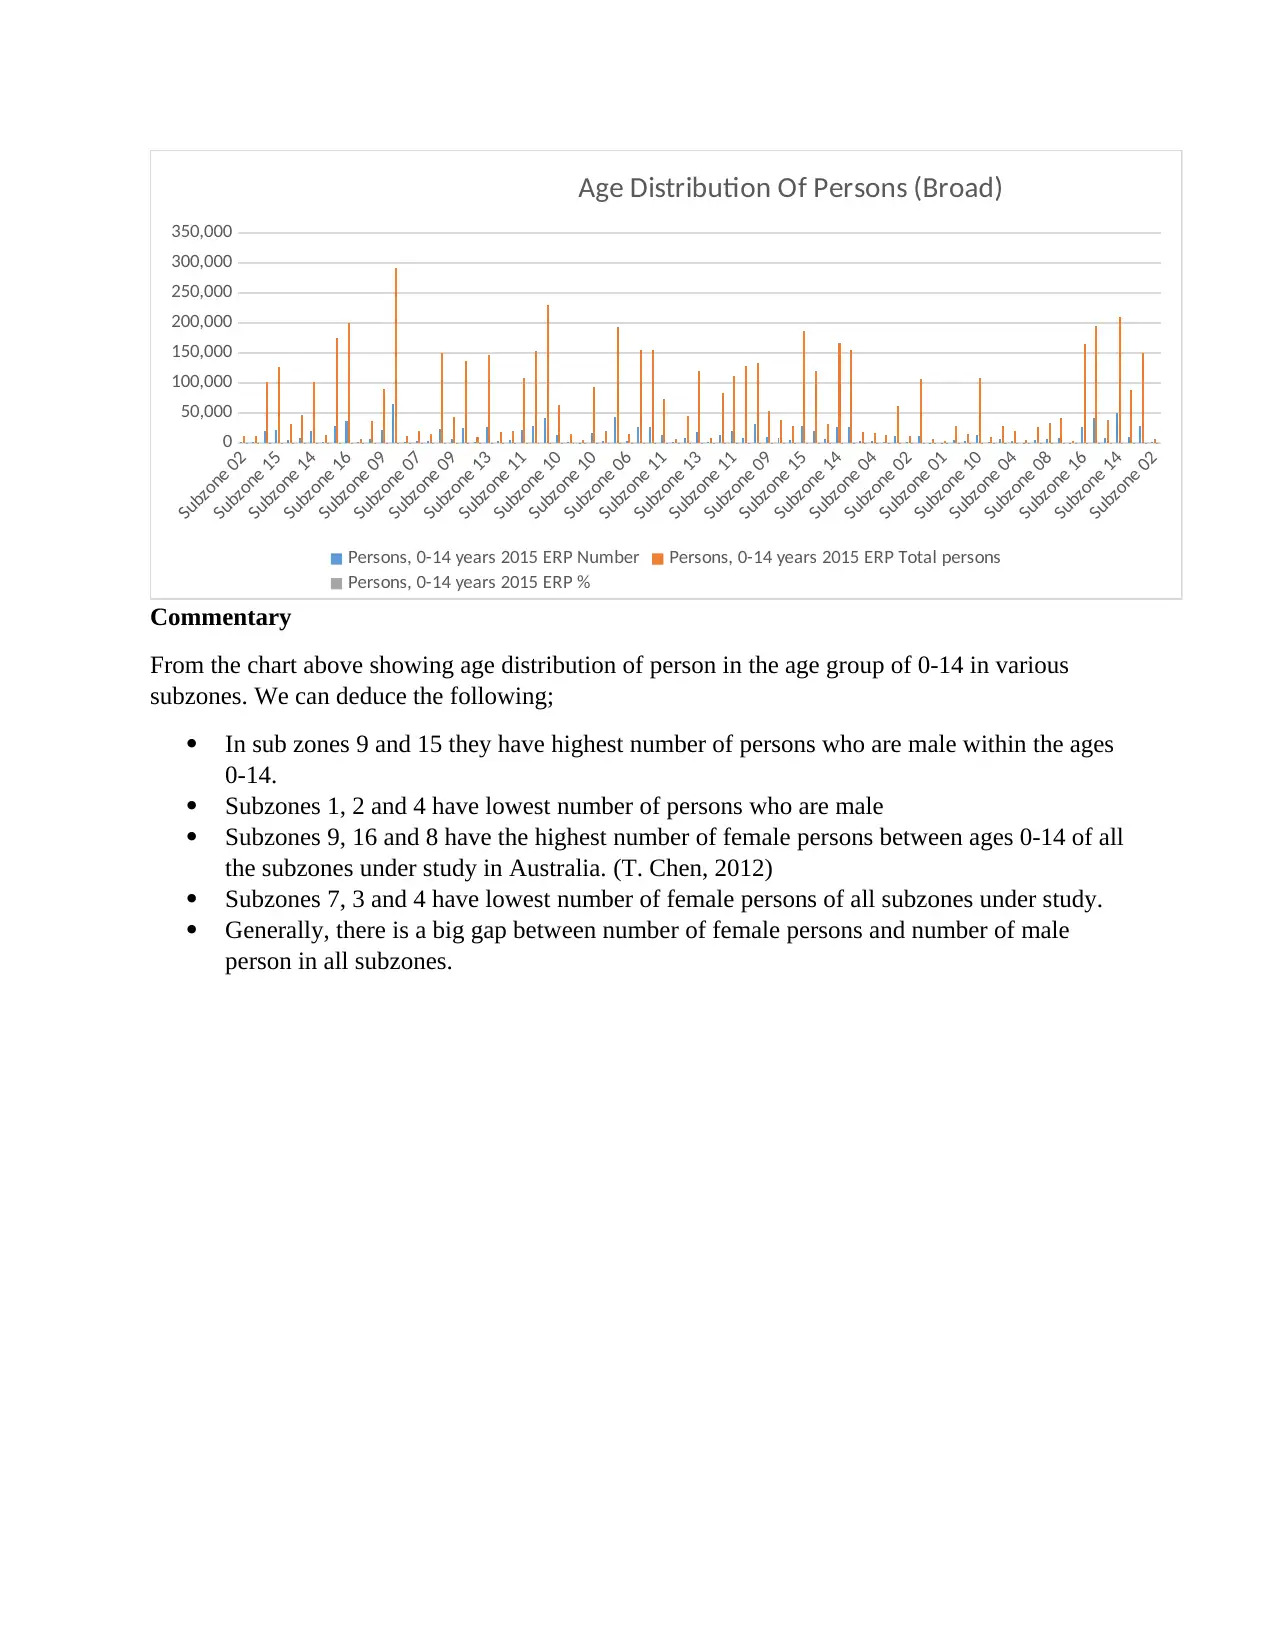
Commentary
From the chart above showing age distribution of person in the age group of 0-14 in various
subzones. We can deduce the following;
In sub zones 9 and 15 they have highest number of persons who are male within the ages
0-14.
Subzones 1, 2 and 4 have lowest number of persons who are male
Subzones 9, 16 and 8 have the highest number of female persons between ages 0-14 of all
the subzones under study in Australia. (T. Chen, 2012)
Subzones 7, 3 and 4 have lowest number of female persons of all subzones under study.
Generally, there is a big gap between number of female persons and number of male
person in all subzones.
Subzone 15
Subzone 14
Subzone 16
Subzone 09
Subzone 07
Subzone 09
Subzone 13
Subzone 11
Subzone 10
Subzone 10
Subzone 06
Subzone 11
Subzone 13
Subzone 11
Subzone 09
Subzone 15
Subzone 14
Subzone 04
Subzone 02
Subzone 01
Subzone 10
Subzone 04
Subzone 08
Subzone 16
Subzone 14
Subzone 02
0
50,000
100,000
150,000
200,000
250,000
300,000
350,000
Age Distribution Of Persons (Broad)
Persons, 0-14 years 2015 ERP Number Persons, 0-14 years 2015 ERP Total persons
Persons, 0-14 years 2015 ERP %
Commentary
From the chart above showing age distribution of person in the age group of 0-14 in various
subzones. We can deduce the following;
In sub zones 9 and 15 they have highest number of persons who are male within the ages
0-14.
Subzones 1, 2 and 4 have lowest number of persons who are male
Subzones 9, 16 and 8 have the highest number of female persons between ages 0-14 of all
the subzones under study in Australia. (T. Chen, 2012)
Subzones 7, 3 and 4 have lowest number of female persons of all subzones under study.
Generally, there is a big gap between number of female persons and number of male
person in all subzones.
Paraphrase This Document
Need a fresh take? Get an instant paraphrase of this document with our AI Paraphraser
1
4
7
10
13
16
19
22
25
28
31
34
37
40
43
46
49
52
55
58
61
64
67
70
73
76
79
0
50,000
100,000
150,000
200,000
250,000
300,000
350,000
Age Distribution of Persons
Number Total persons % Number Total persons %
Number Total persons % Number Total persons %
Number Total persons % Number Total persons %
Number Total persons % Number Total persons %
Commentary
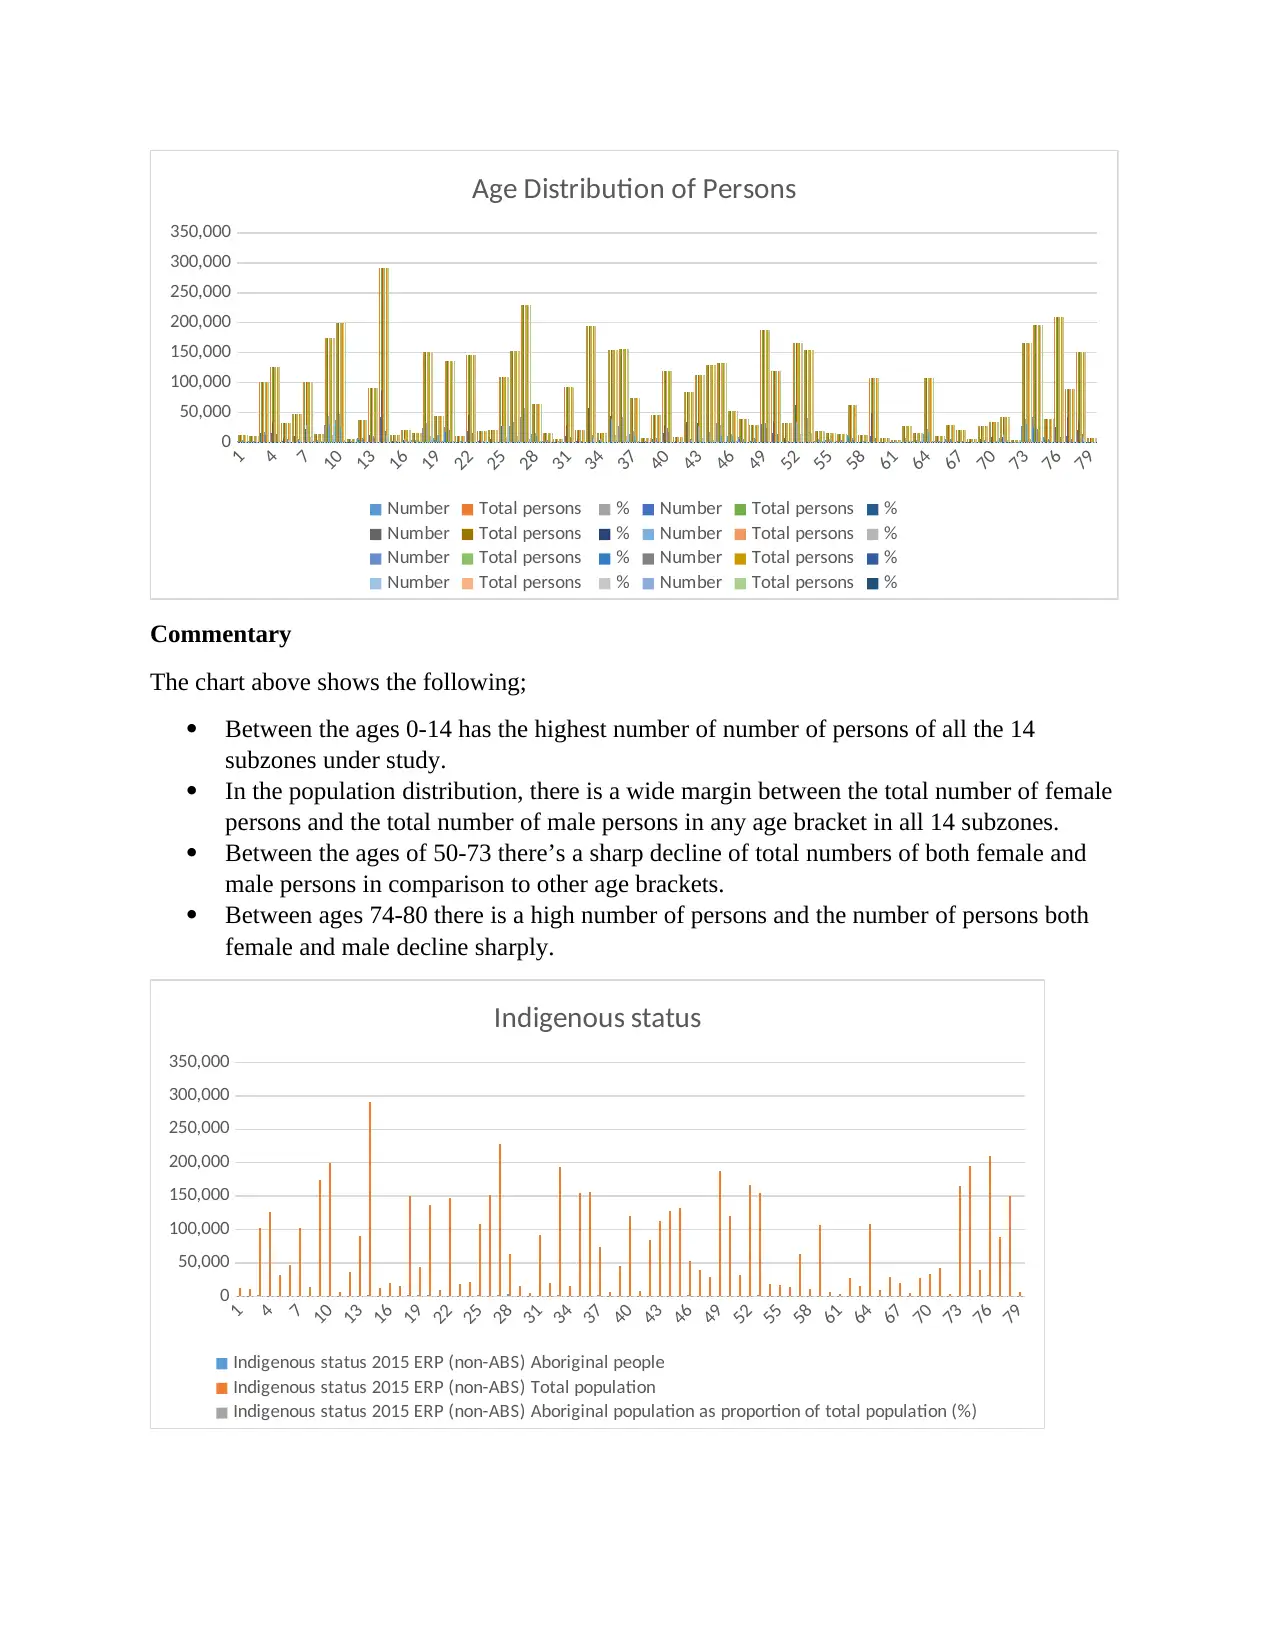
The chart above shows the following;
Between the ages 0-14 has the highest number of number of persons of all the 14
subzones under study.
In the population distribution, there is a wide margin between the total number of female
persons and the total number of male persons in any age bracket in all 14 subzones.
Between the ages of 50-73 there’s a sharp decline of total numbers of both female and
male persons in comparison to other age brackets.
Between ages 74-80 there is a high number of persons and the number of persons both
female and male decline sharply.
1
4
7
10
13
16
19
22
25
28
31
34
37
40
43
46
49
52
55
58
61
64
67
70
73
76
79
0
50,000
100,000
150,000
200,000
250,000
300,000
350,000
Indigenous status
Indigenous status 2015 ERP (non-ABS) Aboriginal people
Indigenous status 2015 ERP (non-ABS) Total population
Indigenous status 2015 ERP (non-ABS) Aboriginal population as proportion of total population (%)
4
7
10
13
16
19
22
25
28
31
34
37
40
43
46
49
52
55
58
61
64
67
70
73
76
79
0
50,000
100,000
150,000
200,000
250,000
300,000
350,000
Age Distribution of Persons
Number Total persons % Number Total persons %
Number Total persons % Number Total persons %
Number Total persons % Number Total persons %
Number Total persons % Number Total persons %
Commentary
The chart above shows the following;
Between the ages 0-14 has the highest number of number of persons of all the 14
subzones under study.
In the population distribution, there is a wide margin between the total number of female
persons and the total number of male persons in any age bracket in all 14 subzones.
Between the ages of 50-73 there’s a sharp decline of total numbers of both female and
male persons in comparison to other age brackets.
Between ages 74-80 there is a high number of persons and the number of persons both
female and male decline sharply.
1
4
7
10
13
16
19
22
25
28
31
34
37
40
43
46
49
52
55
58
61
64
67
70
73
76
79
0
50,000
100,000
150,000
200,000
250,000
300,000
350,000
Indigenous status
Indigenous status 2015 ERP (non-ABS) Aboriginal people
Indigenous status 2015 ERP (non-ABS) Total population
Indigenous status 2015 ERP (non-ABS) Aboriginal population as proportion of total population (%)
Commentary
In the above chart, we can deduce the following;
There is a highest number of indigenous persons in total, both male and female between
the age brackets 0-14.
The lowest number of persons both female and male is seen between the ages 55-73.
The number of male indigenous persons is higher than the number of female indigenous
persons in all subzones of Australia under study.
1
4
7
10
13
16
19
22
25
28
31
34
37
40
43
46
49
52
55
58
61
64
67
70
73
76
79
0
50,000
100,000
150,000
200,000
250,000
300,000
Birthplace NES residents
Australian-born population 2011 People born in AustraliaAustralian-born population 2011 Total populationAustralian-born population 2011 % Australian bornPeople born (overseas) in predominantly English speaking countries 2011 People born (overseas) in English speaking countriesPeople born (overseas) in predominantly English speaking countries 2011 Total populationPeople born (overseas) in predominantly English speaking countries 2011 % born overseas in English speaking countriesPeople born in predominantly non-English speaking countries 2011 People born in non-English speaking countriesPeople born in predominantly non-English speaking countries 2011 Total populationPeople born in predominantly non-English speaking countries 2011 % born in non-English speaking countriesPeople born in a predominantly non-English speaking (NES) country resident in Australia for five years or more 2011 People
born in a NES country resident in Australia for five years or more
People born in a predominantly non-English speaking (NES) country resident in Australia for five years or more 2011 Total
population
People born in a predominantly non-English speaking (NES) country resident in Australia for five years or more 2011 % born in
a NES country resident in Australia for five years or more
People born in a predominantly non-English speaking (NES) country resident in Australia for less than five years 2011 People
born in a NES country resident in Australia for less than five years
People born in a predominantly non-English speaking (NES) country resident in Australia for less than five years 2011 Total
population
People born in a predominantly non-English speaking (NES) country resident in Australia for less than five years 2011 % born in
a NES country resident in Australia for less than five years
People born overseas reporting poor proficiency in English 2011 People born overseas who speak English not well or not at allPeople born overseas reporting poor proficiency in English 2011 % born overseas who speak English not well or not at all
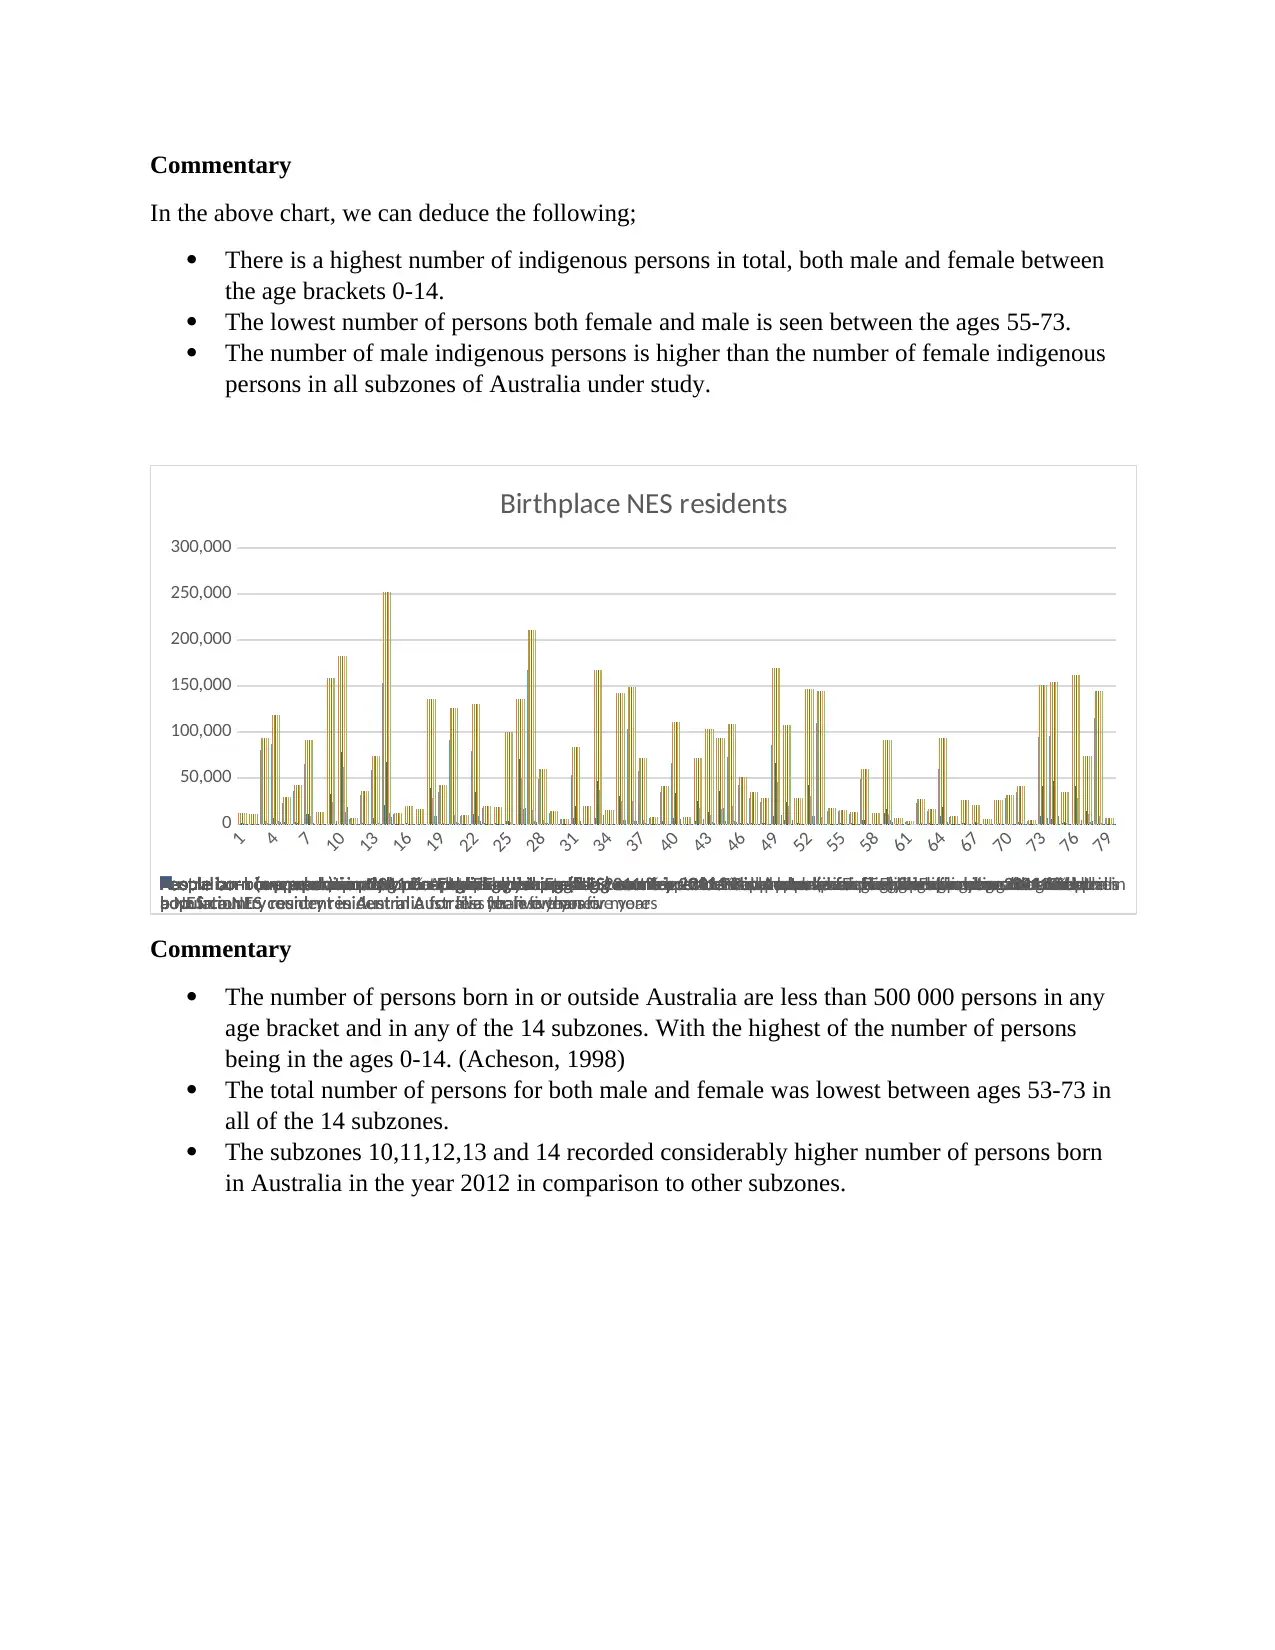
Commentary
The number of persons born in or outside Australia are less than 500 000 persons in any
age bracket and in any of the 14 subzones. With the highest of the number of persons
being in the ages 0-14. (Acheson, 1998)
The total number of persons for both male and female was lowest between ages 53-73 in
all of the 14 subzones.
The subzones 10,11,12,13 and 14 recorded considerably higher number of persons born
in Australia in the year 2012 in comparison to other subzones.
In the above chart, we can deduce the following;
There is a highest number of indigenous persons in total, both male and female between
the age brackets 0-14.
The lowest number of persons both female and male is seen between the ages 55-73.
The number of male indigenous persons is higher than the number of female indigenous
persons in all subzones of Australia under study.
1
4
7
10
13
16
19
22
25
28
31
34
37
40
43
46
49
52
55
58
61
64
67
70
73
76
79
0
50,000
100,000
150,000
200,000
250,000
300,000
Birthplace NES residents
Australian-born population 2011 People born in AustraliaAustralian-born population 2011 Total populationAustralian-born population 2011 % Australian bornPeople born (overseas) in predominantly English speaking countries 2011 People born (overseas) in English speaking countriesPeople born (overseas) in predominantly English speaking countries 2011 Total populationPeople born (overseas) in predominantly English speaking countries 2011 % born overseas in English speaking countriesPeople born in predominantly non-English speaking countries 2011 People born in non-English speaking countriesPeople born in predominantly non-English speaking countries 2011 Total populationPeople born in predominantly non-English speaking countries 2011 % born in non-English speaking countriesPeople born in a predominantly non-English speaking (NES) country resident in Australia for five years or more 2011 People
born in a NES country resident in Australia for five years or more
People born in a predominantly non-English speaking (NES) country resident in Australia for five years or more 2011 Total
population
People born in a predominantly non-English speaking (NES) country resident in Australia for five years or more 2011 % born in
a NES country resident in Australia for five years or more
People born in a predominantly non-English speaking (NES) country resident in Australia for less than five years 2011 People
born in a NES country resident in Australia for less than five years
People born in a predominantly non-English speaking (NES) country resident in Australia for less than five years 2011 Total
population
People born in a predominantly non-English speaking (NES) country resident in Australia for less than five years 2011 % born in
a NES country resident in Australia for less than five years
People born overseas reporting poor proficiency in English 2011 People born overseas who speak English not well or not at allPeople born overseas reporting poor proficiency in English 2011 % born overseas who speak English not well or not at all
Commentary
The number of persons born in or outside Australia are less than 500 000 persons in any
age bracket and in any of the 14 subzones. With the highest of the number of persons
being in the ages 0-14. (Acheson, 1998)
The total number of persons for both male and female was lowest between ages 53-73 in
all of the 14 subzones.
The subzones 10,11,12,13 and 14 recorded considerably higher number of persons born
in Australia in the year 2012 in comparison to other subzones.
⊘ This is a preview!⊘
Do you want full access?
Subscribe today to unlock all pages.
Trusted by 1+ million students worldwide
1
9
17
25
33
41
49
57
65
73
0 2,000,000 4,000,000 6,000,000 8,000,000 10,000,000 12,000,000 14,000,000 16,000,000 18,000,000
Education
School leaver participation in higher education 2013 (excludes Qld) % in higher education
School leaver participation in higher education 2013 (excludes Qld) Persons aged 17 years, 2012
School leaver participation in higher education 2013 (excludes Qld) Enrolled in higher education
Government-funded vocational education and training subjects -
Total students 2015 % government-funded subjects
Government-funded vocational education and training subjects -
Total students 2015 % government-funded subjects
Government-funded vocational education and training subjects -
Total students 2015 Total subjects
Government-funded vocational education and training subjects -
Total students 2015 Government-funded subjects
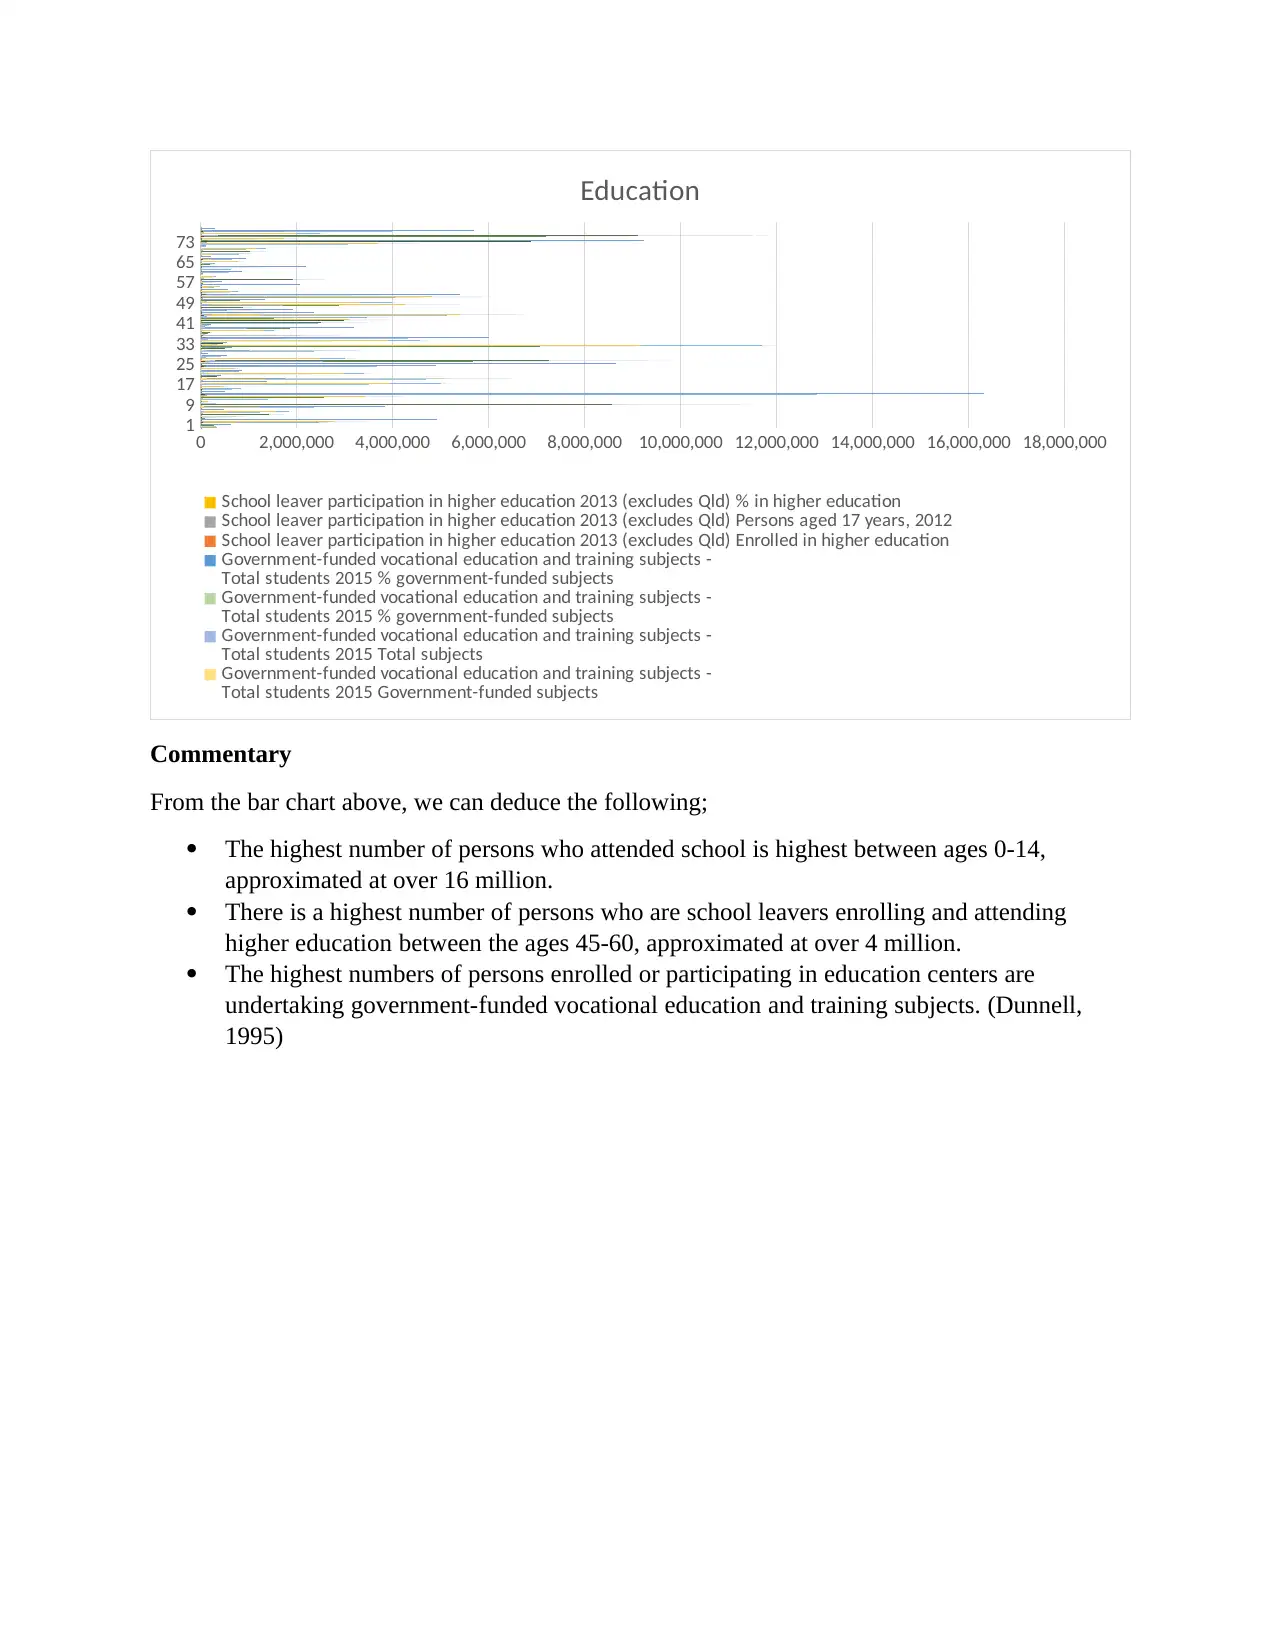
Commentary
From the bar chart above, we can deduce the following;
The highest number of persons who attended school is highest between ages 0-14,
approximated at over 16 million.
There is a highest number of persons who are school leavers enrolling and attending
higher education between the ages 45-60, approximated at over 4 million.
The highest numbers of persons enrolled or participating in education centers are
undertaking government-funded vocational education and training subjects. (Dunnell,
1995)
9
17
25
33
41
49
57
65
73
0 2,000,000 4,000,000 6,000,000 8,000,000 10,000,000 12,000,000 14,000,000 16,000,000 18,000,000
Education
School leaver participation in higher education 2013 (excludes Qld) % in higher education
School leaver participation in higher education 2013 (excludes Qld) Persons aged 17 years, 2012
School leaver participation in higher education 2013 (excludes Qld) Enrolled in higher education
Government-funded vocational education and training subjects -
Total students 2015 % government-funded subjects
Government-funded vocational education and training subjects -
Total students 2015 % government-funded subjects
Government-funded vocational education and training subjects -
Total students 2015 Total subjects
Government-funded vocational education and training subjects -
Total students 2015 Government-funded subjects
Commentary
From the bar chart above, we can deduce the following;
The highest number of persons who attended school is highest between ages 0-14,
approximated at over 16 million.
There is a highest number of persons who are school leavers enrolling and attending
higher education between the ages 45-60, approximated at over 4 million.
The highest numbers of persons enrolled or participating in education centers are
undertaking government-funded vocational education and training subjects. (Dunnell,
1995)
Paraphrase This Document
Need a fresh take? Get an instant paraphrase of this document with our AI Paraphraser
1
6
11
16
21
26
31
36
41
46
51
56
61
66
71
76
-20,000 0 20,000 40,000 60,000 80,000 100,000 120,000 140,000 160,000
Access to Services
Persons aged 18 years and over who accessed the Internet at home in the past 12 months (modelled estimates)
2010 RRMSE
Persons aged 18 years and over who accessed the Internet at home in the past 12 months (modelled estimates)
2010 SR
- upper 95% C.I.
Persons aged 18 years and over who accessed the Internet at home in the past 12 months (modelled estimates)
2010 SR
- lower 95% C.I.
Persons aged 18 years and over who accessed the Internet at home in the past 12 months (modelled estimates)
2010 SR
Persons aged 18 years and over who accessed the Internet at home in the past 12 months (modelled estimates)
2010 ASR per 100
- upper 95% C.I.
Persons aged 18 years and over who accessed the Internet at home in the past 12 months (modelled estimates)
2010 ASR per 100
- lower 95% C.I.
Persons aged 18 years and over who accessed the Internet at home in the past 12 months (modelled estimates)
2010 ASR per 100
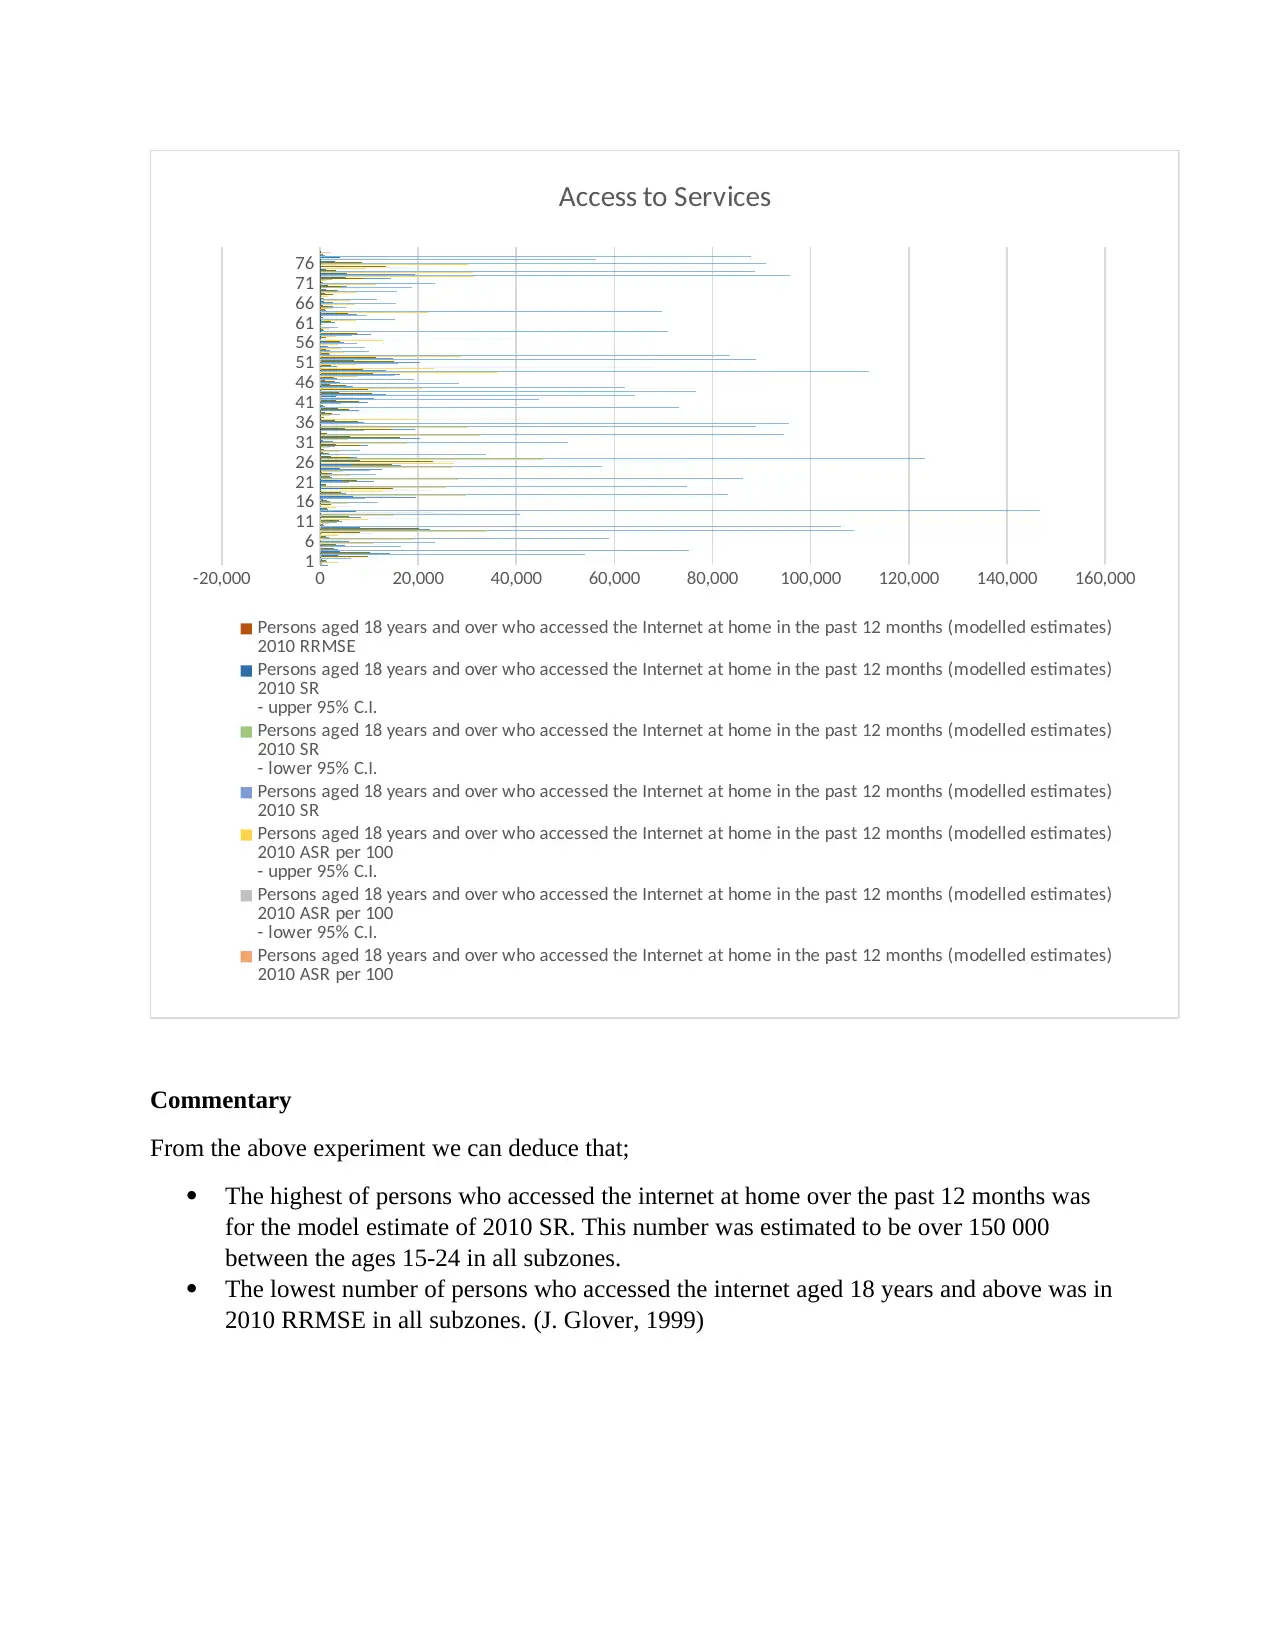
Commentary
From the above experiment we can deduce that;
The highest of persons who accessed the internet at home over the past 12 months was
for the model estimate of 2010 SR. This number was estimated to be over 150 000
between the ages 15-24 in all subzones.
The lowest number of persons who accessed the internet aged 18 years and above was in
2010 RRMSE in all subzones. (J. Glover, 1999)
6
11
16
21
26
31
36
41
46
51
56
61
66
71
76
-20,000 0 20,000 40,000 60,000 80,000 100,000 120,000 140,000 160,000
Access to Services
Persons aged 18 years and over who accessed the Internet at home in the past 12 months (modelled estimates)
2010 RRMSE
Persons aged 18 years and over who accessed the Internet at home in the past 12 months (modelled estimates)
2010 SR
- upper 95% C.I.
Persons aged 18 years and over who accessed the Internet at home in the past 12 months (modelled estimates)
2010 SR
- lower 95% C.I.
Persons aged 18 years and over who accessed the Internet at home in the past 12 months (modelled estimates)
2010 SR
Persons aged 18 years and over who accessed the Internet at home in the past 12 months (modelled estimates)
2010 ASR per 100
- upper 95% C.I.
Persons aged 18 years and over who accessed the Internet at home in the past 12 months (modelled estimates)
2010 ASR per 100
- lower 95% C.I.
Persons aged 18 years and over who accessed the Internet at home in the past 12 months (modelled estimates)
2010 ASR per 100
Commentary
From the above experiment we can deduce that;
The highest of persons who accessed the internet at home over the past 12 months was
for the model estimate of 2010 SR. This number was estimated to be over 150 000
between the ages 15-24 in all subzones.
The lowest number of persons who accessed the internet aged 18 years and above was in
2010 RRMSE in all subzones. (J. Glover, 1999)
1
5
9
13
17
21
25
29
33
37
41
45
49
53
57
61
65
69
73
77
-10,000 0 10,000 20,000 30,000 40,000 50,000 60,000
Estimated Risk Factors
Estimated population, aged 18 years and over, who were obese 2011–12 RRMSE
Estimated population, aged 18 years and over, who were obese 2011–12 SR
- upper 95% C.I.
Estimated population, aged 18 years and over, who were obese 2011–12 SR
- lower 95% C.I.
Estimated population, aged 18 years and over, who were obese 2011–12 SR
Estimated population, aged 18 years and over, who were obese 2011–12 ASR per 100
- upper 95% C.I.
Estimated population, aged 18 years and over, who were obese 2011–12 ASR per 100
- lower 95% C.I.
Estimated population, aged 18 years and over, who were obese 2011–12 ASR per 100
Estimated population, aged 18 years and over, who were obese 2011–12 Number
Estimated population, aged 18 years and over, who were overweight (but not obese) 2011–12 RRMSE
Estimated population, aged 18 years and over, who were overweight (but not obese) 2011–12 SR
- upper 95% C.I.
Estimated population, aged 18 years and over, who were overweight (but not obese) 2011–12 SR
- lower 95% C.I.
Estimated population, aged 18 years and over, who were overweight (but not obese) 2011–12 SR
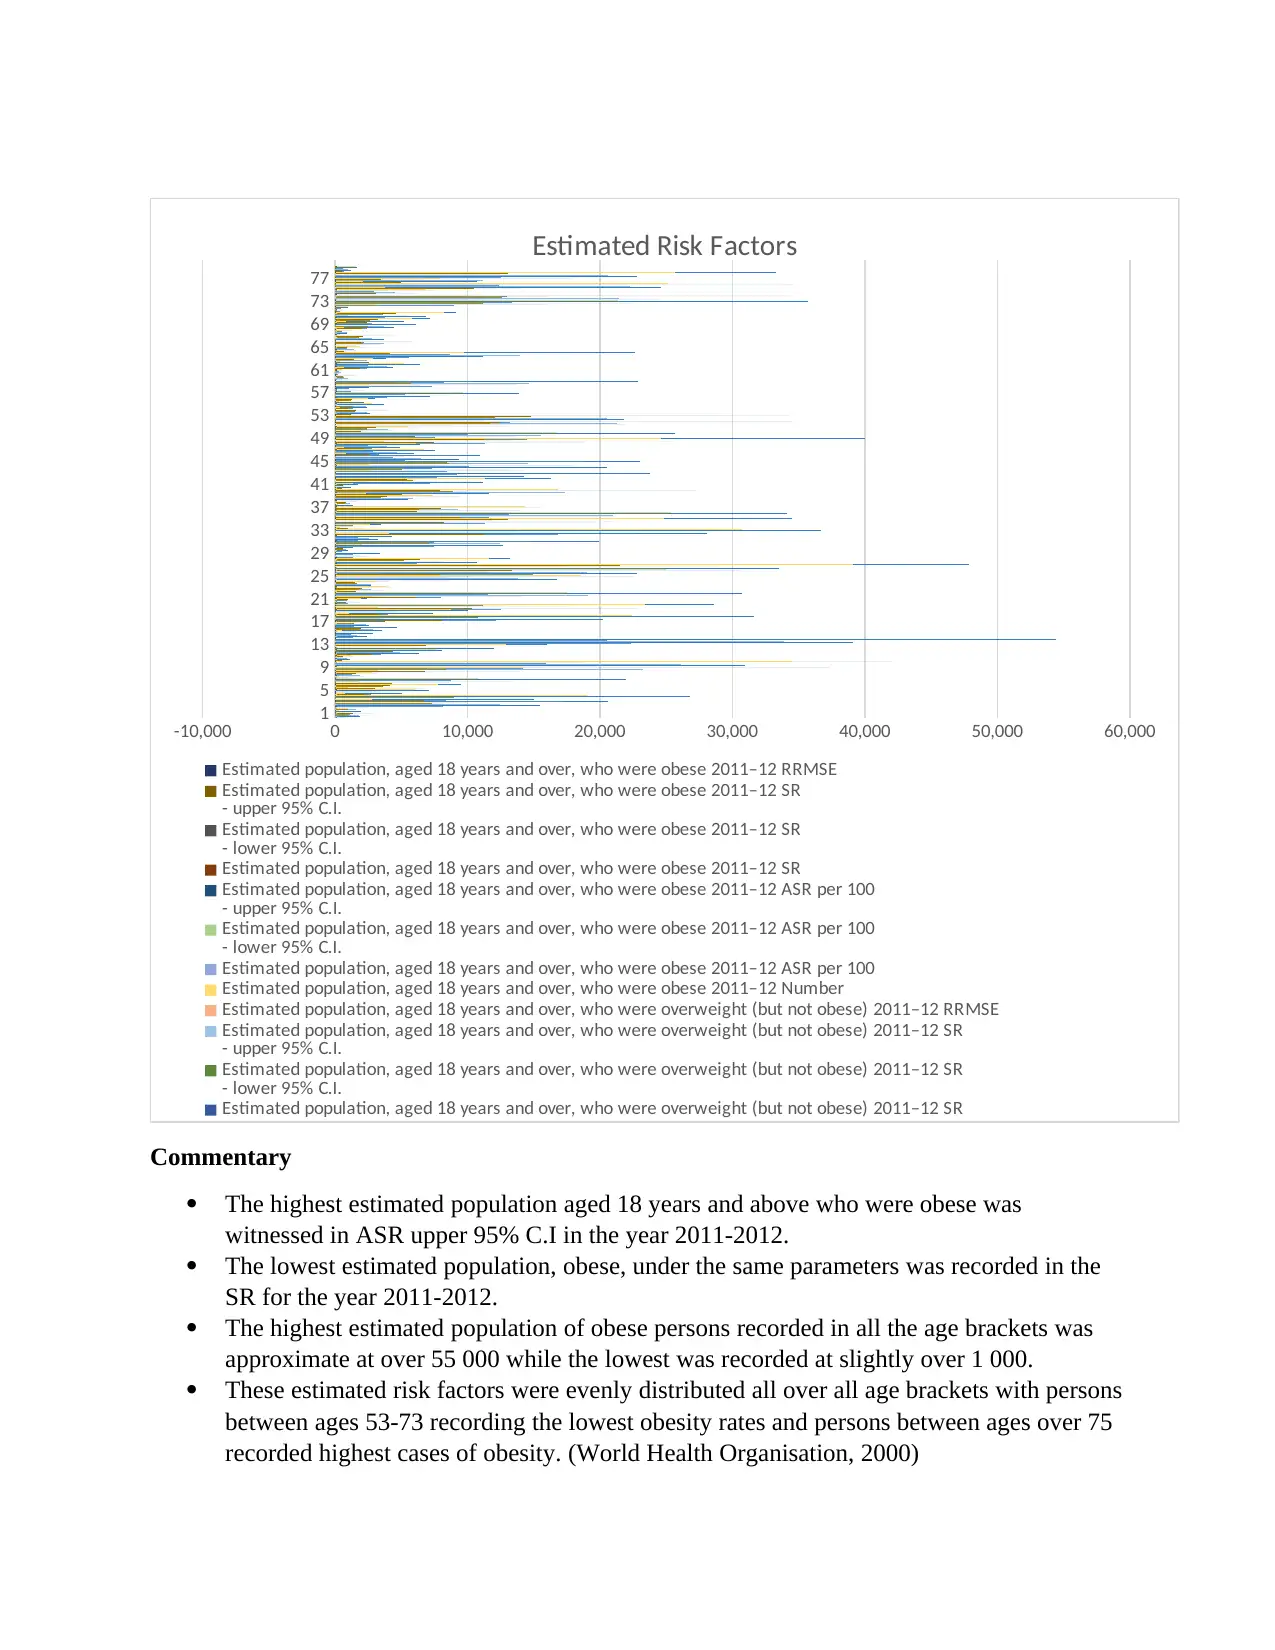
Commentary
The highest estimated population aged 18 years and above who were obese was
witnessed in ASR upper 95% C.I in the year 2011-2012.
The lowest estimated population, obese, under the same parameters was recorded in the
SR for the year 2011-2012.
The highest estimated population of obese persons recorded in all the age brackets was
approximate at over 55 000 while the lowest was recorded at slightly over 1 000.
These estimated risk factors were evenly distributed all over all age brackets with persons
between ages 53-73 recording the lowest obesity rates and persons between ages over 75
recorded highest cases of obesity. (World Health Organisation, 2000)
5
9
13
17
21
25
29
33
37
41
45
49
53
57
61
65
69
73
77
-10,000 0 10,000 20,000 30,000 40,000 50,000 60,000
Estimated Risk Factors
Estimated population, aged 18 years and over, who were obese 2011–12 RRMSE
Estimated population, aged 18 years and over, who were obese 2011–12 SR
- upper 95% C.I.
Estimated population, aged 18 years and over, who were obese 2011–12 SR
- lower 95% C.I.
Estimated population, aged 18 years and over, who were obese 2011–12 SR
Estimated population, aged 18 years and over, who were obese 2011–12 ASR per 100
- upper 95% C.I.
Estimated population, aged 18 years and over, who were obese 2011–12 ASR per 100
- lower 95% C.I.
Estimated population, aged 18 years and over, who were obese 2011–12 ASR per 100
Estimated population, aged 18 years and over, who were obese 2011–12 Number
Estimated population, aged 18 years and over, who were overweight (but not obese) 2011–12 RRMSE
Estimated population, aged 18 years and over, who were overweight (but not obese) 2011–12 SR
- upper 95% C.I.
Estimated population, aged 18 years and over, who were overweight (but not obese) 2011–12 SR
- lower 95% C.I.
Estimated population, aged 18 years and over, who were overweight (but not obese) 2011–12 SR
Commentary
The highest estimated population aged 18 years and above who were obese was
witnessed in ASR upper 95% C.I in the year 2011-2012.
The lowest estimated population, obese, under the same parameters was recorded in the
SR for the year 2011-2012.
The highest estimated population of obese persons recorded in all the age brackets was
approximate at over 55 000 while the lowest was recorded at slightly over 1 000.
These estimated risk factors were evenly distributed all over all age brackets with persons
between ages 53-73 recording the lowest obesity rates and persons between ages over 75
recorded highest cases of obesity. (World Health Organisation, 2000)
⊘ This is a preview!⊘
Do you want full access?
Subscribe today to unlock all pages.
Trusted by 1+ million students worldwide
Conclusion and Recommendations
Following the analysis and results of the data for the 14 subzones in Victoria we can have
numerous conclusions.
Firstly, the population of Victoria in all subzones is a well-balanced population. This is
evidenced by the bar charts where bars are evenly balanced in all the fields we analyzed. It
shows that, for instance, people who are or have enrolled to higher education and vocational
training is fairly balanced for all age brackets starting from 18 years and above.
Secondly, female part of population in the region of Victoria is lagging behind in almost all
fields that were under study. In fields such as education, total population, access to education,
access to health services among others, it shows that less number of female persons seek the
above named fields as compared to the number of male persons.
In addition, from the analyzed data, we can deduce that the number of indigenous people born in
Australia is very low as compared to total number of persons born outside Australia.
In conclusion we can also note that there are a high number of persons who are obese in relation
to the total population. This is evident in all age brackets where the bar charts show an even
distribution in the whole population in the Victoria region. Also, more obese tend to be depicted
in persons under age brackets between ages 55 – 85 and 14 – 24. While less obese person is
depicted to be between ages 25 -54.
Some of the recommendations that we can deduce from the above include; the government needs
to start educational campaign aimed specifically at women. The aim of the campaign should be
encouraging and educate more women in seeking for major services such as education, seeking
better health services among others. Also the government should take the issue of obesity
seriously. It should encourage practices that enhance health living. Practices such as encouraging
parents to cease from feeding their families junk food rich in high carbohydrates and fats content,
start health running days like marathons, and many others. In conclusion the government should
start many education programs which are funded or subsidized by the government of Australia.
This will encourage more people especially young persons under the demography to enroll and
become trained work force.
Paraphrase This Document
Need a fresh take? Get an instant paraphrase of this document with our AI Paraphraser
References
Acheson, D. (1998). Independent Inquiry into Inequalities in Health Report. London: The
Stationary Office.
David Bencheon, M. G. (2006). Oxford Handbook of public health practice. Toronto: Oxford
University Press.
Doward, J. (2012). Men Risk Health by Failing to Seek NHS hep, Survey FInds. London: The
guardian.
Dunnell, K. (1995). Population Review: (2) Are We Healthier? London: UK Government
Statistical Services.
House of Commons, Health Committee. (2006). Health Inequalities. London: The Stationary
Office Limited.
J. Glover, K. H. (1999). A Social Health Atlas of Australia. Melbourne: CommonWealth of
Australia.
J. Robson, I. D. (2015). The NhS Health Check Programme: Implementation in East London
2009-2011. London: BMJ.
S. Bewley, A. B. (2015). NHS Health Checks are a waste of Resources. London: The BMJ.
Sheena Asthana, S. A. (2006). What Works In Tackling Health Inequalities? London: Policy
Press.
T. Chen, W. L. (2012). Smoking status on Outcomes after Percutaneous Coronary Intervention.
Clin.Cardiol.
World Health Organisation. (2000). The World Health Report 2000-Health Systems:Improving
Performance. Geneva: World Health Organisation.
1 out of 11
Related Documents


Your All-in-One AI-Powered Toolkit for Academic Success.
+13062052269
info@desklib.com
Available 24*7 on WhatsApp / Email
![[object Object]](/_next/static/media/star-bottom.7253800d.svg)
Unlock your academic potential
Copyright © 2020–2026 A2Z Services. All Rights Reserved. Developed and managed by ZUCOL.