PUBH620: Biostatistics Assessment Task 1 - Longitudinal Study Analysis
VerifiedAdded on  2023/01/19
|23
|4406
|97
Homework Assignment
AI Summary
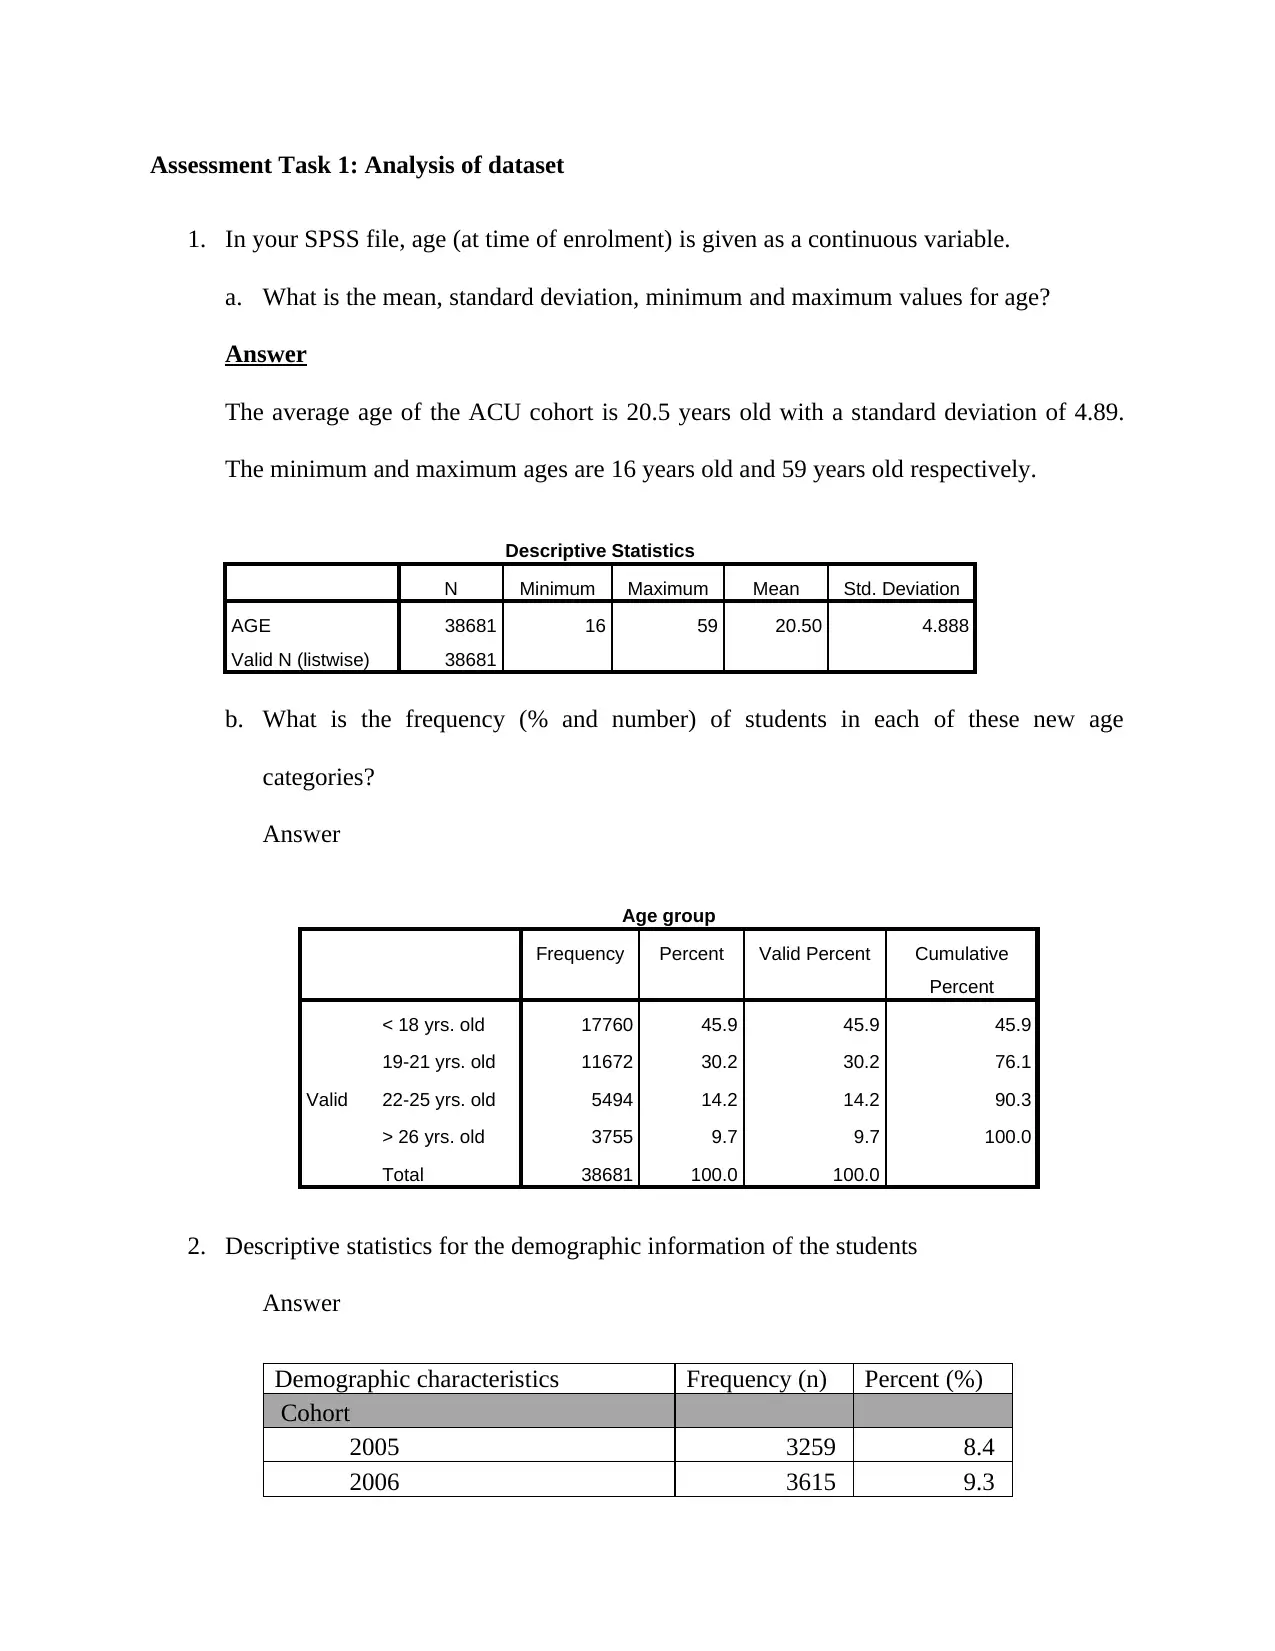
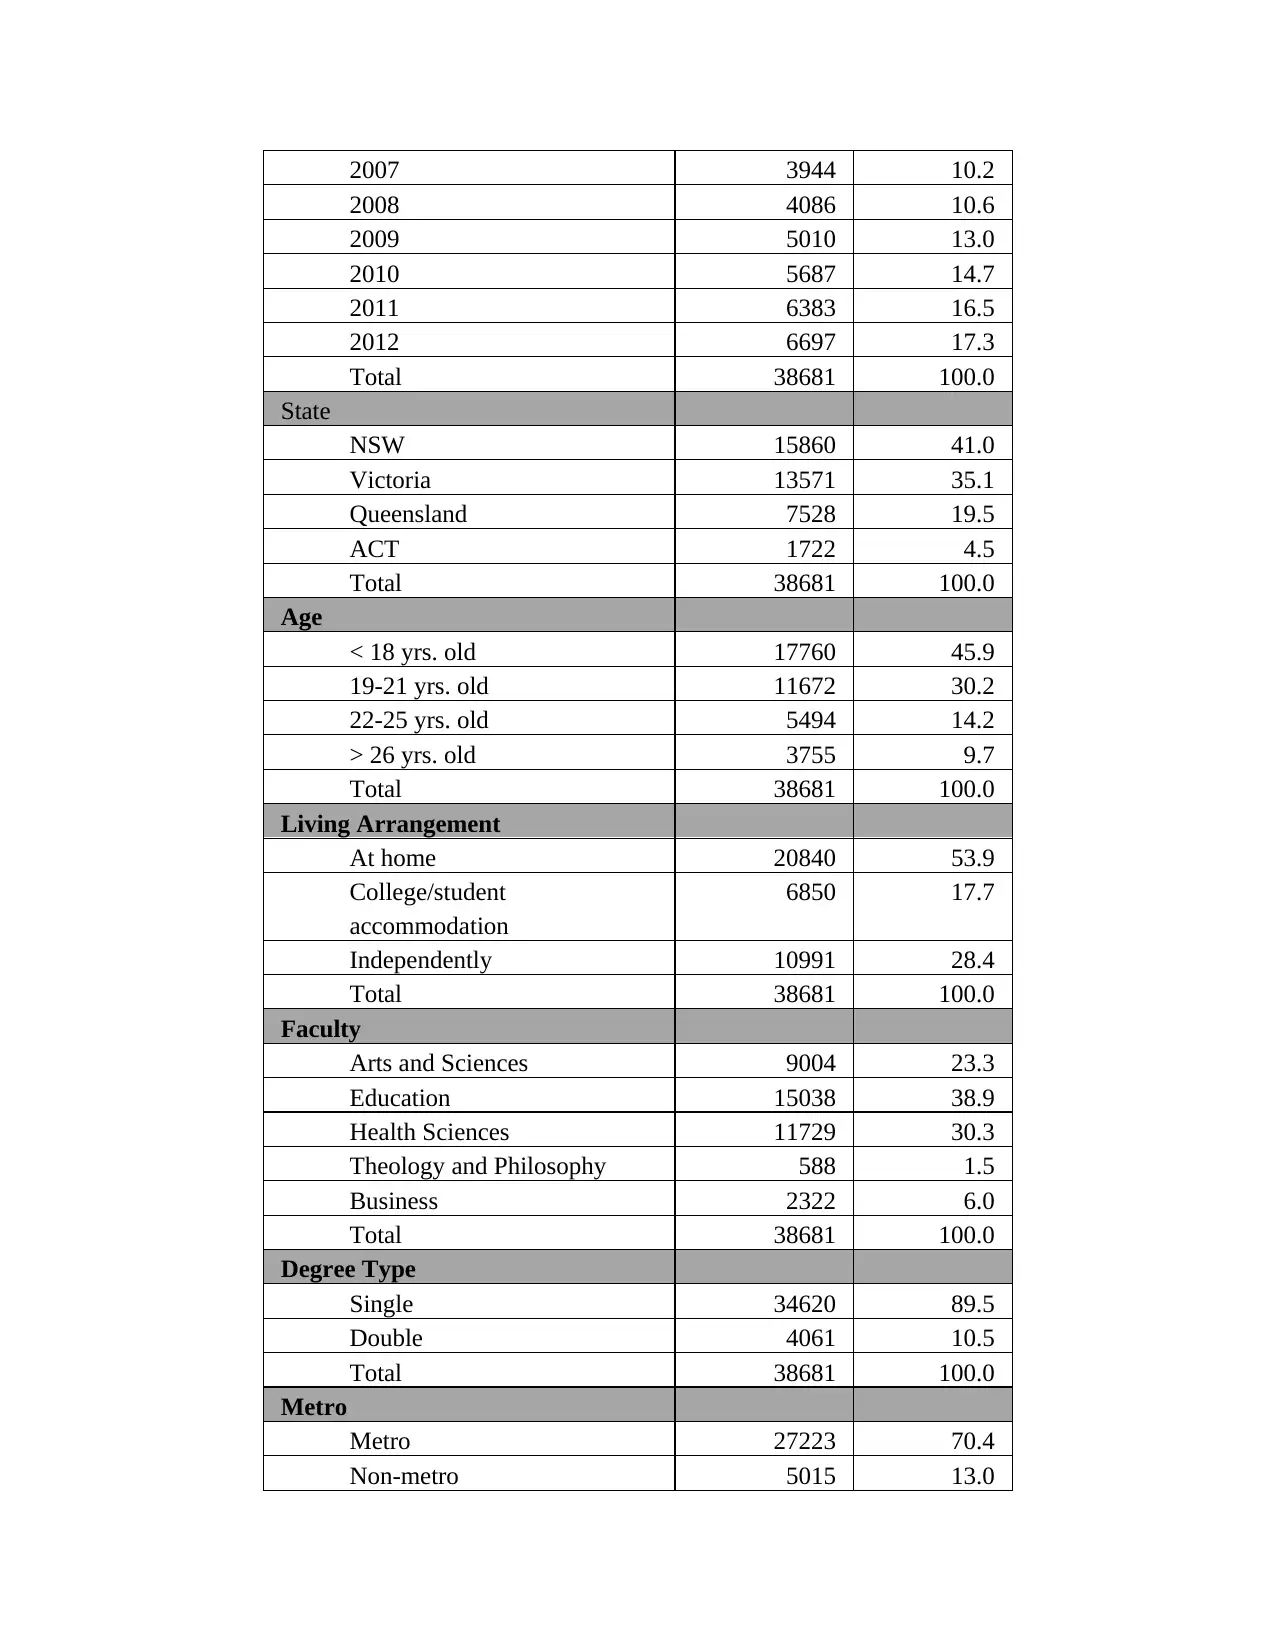
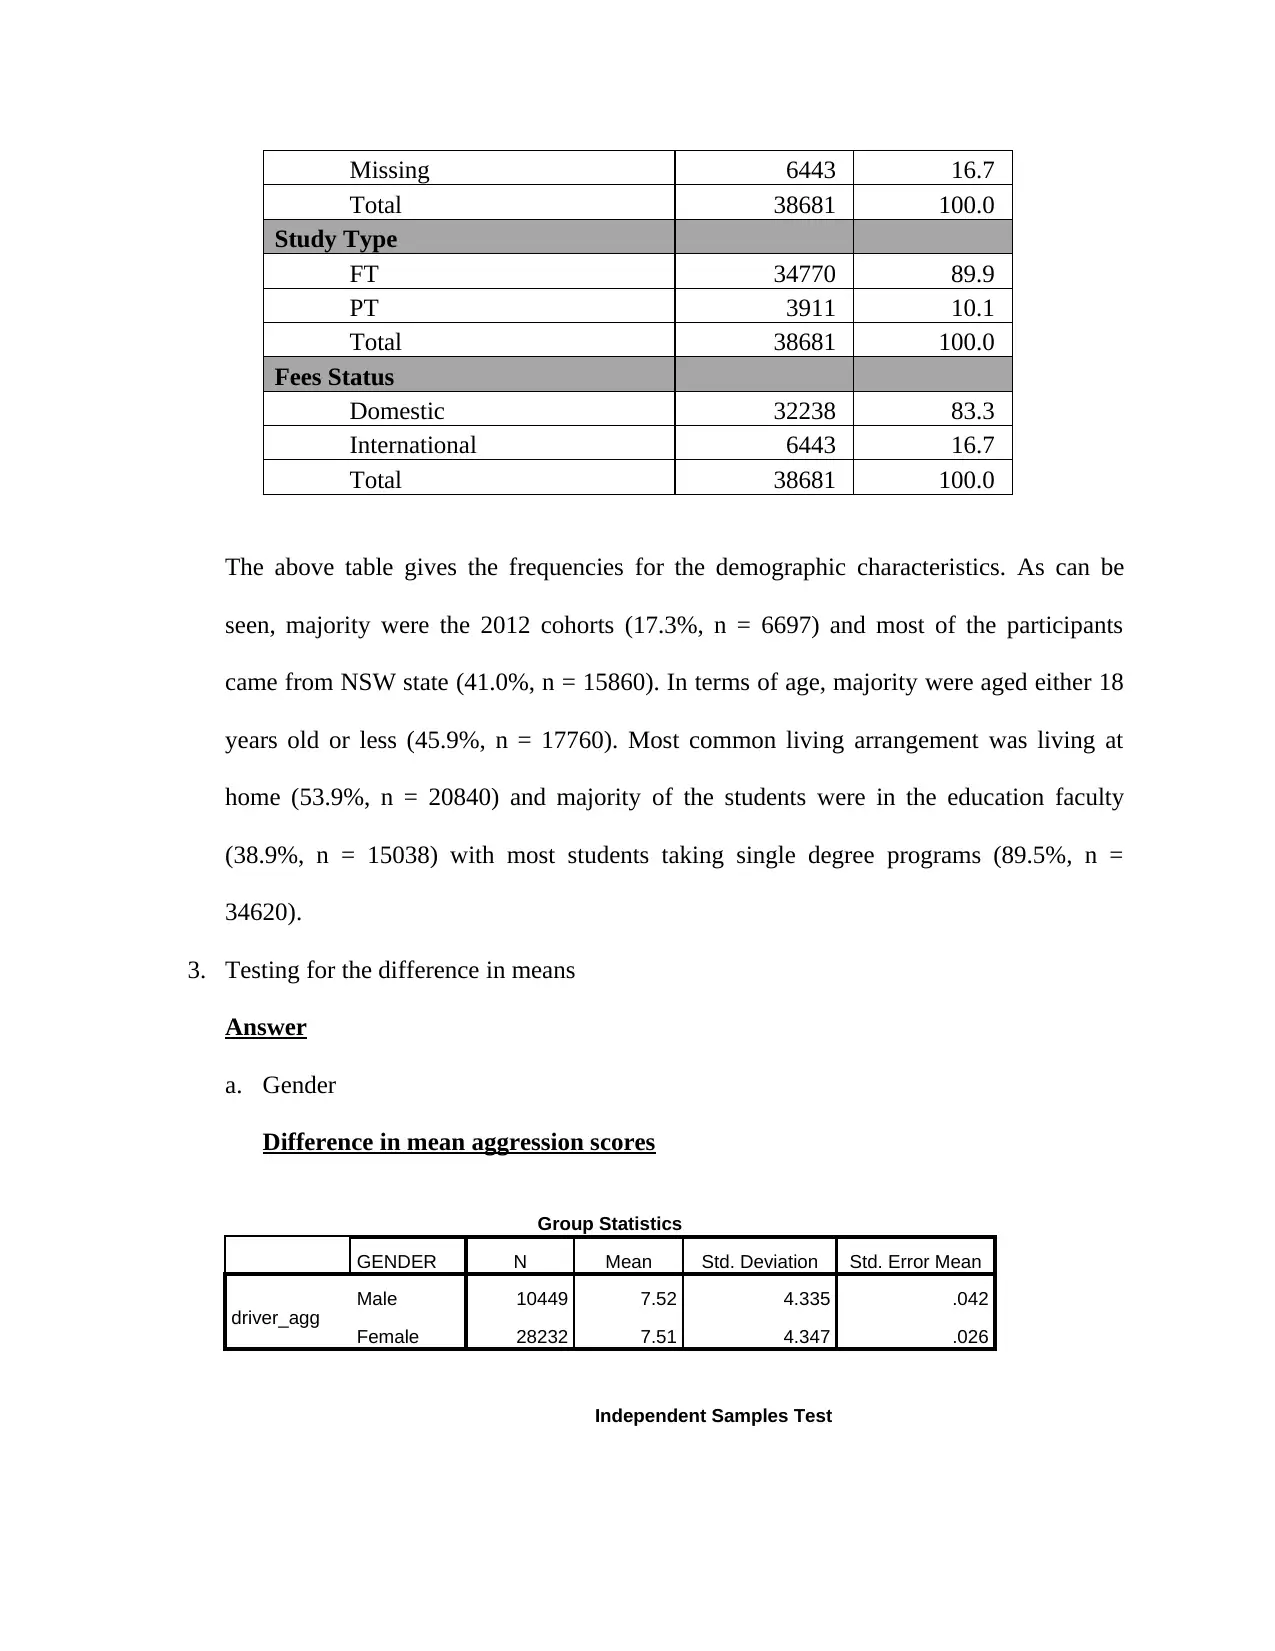
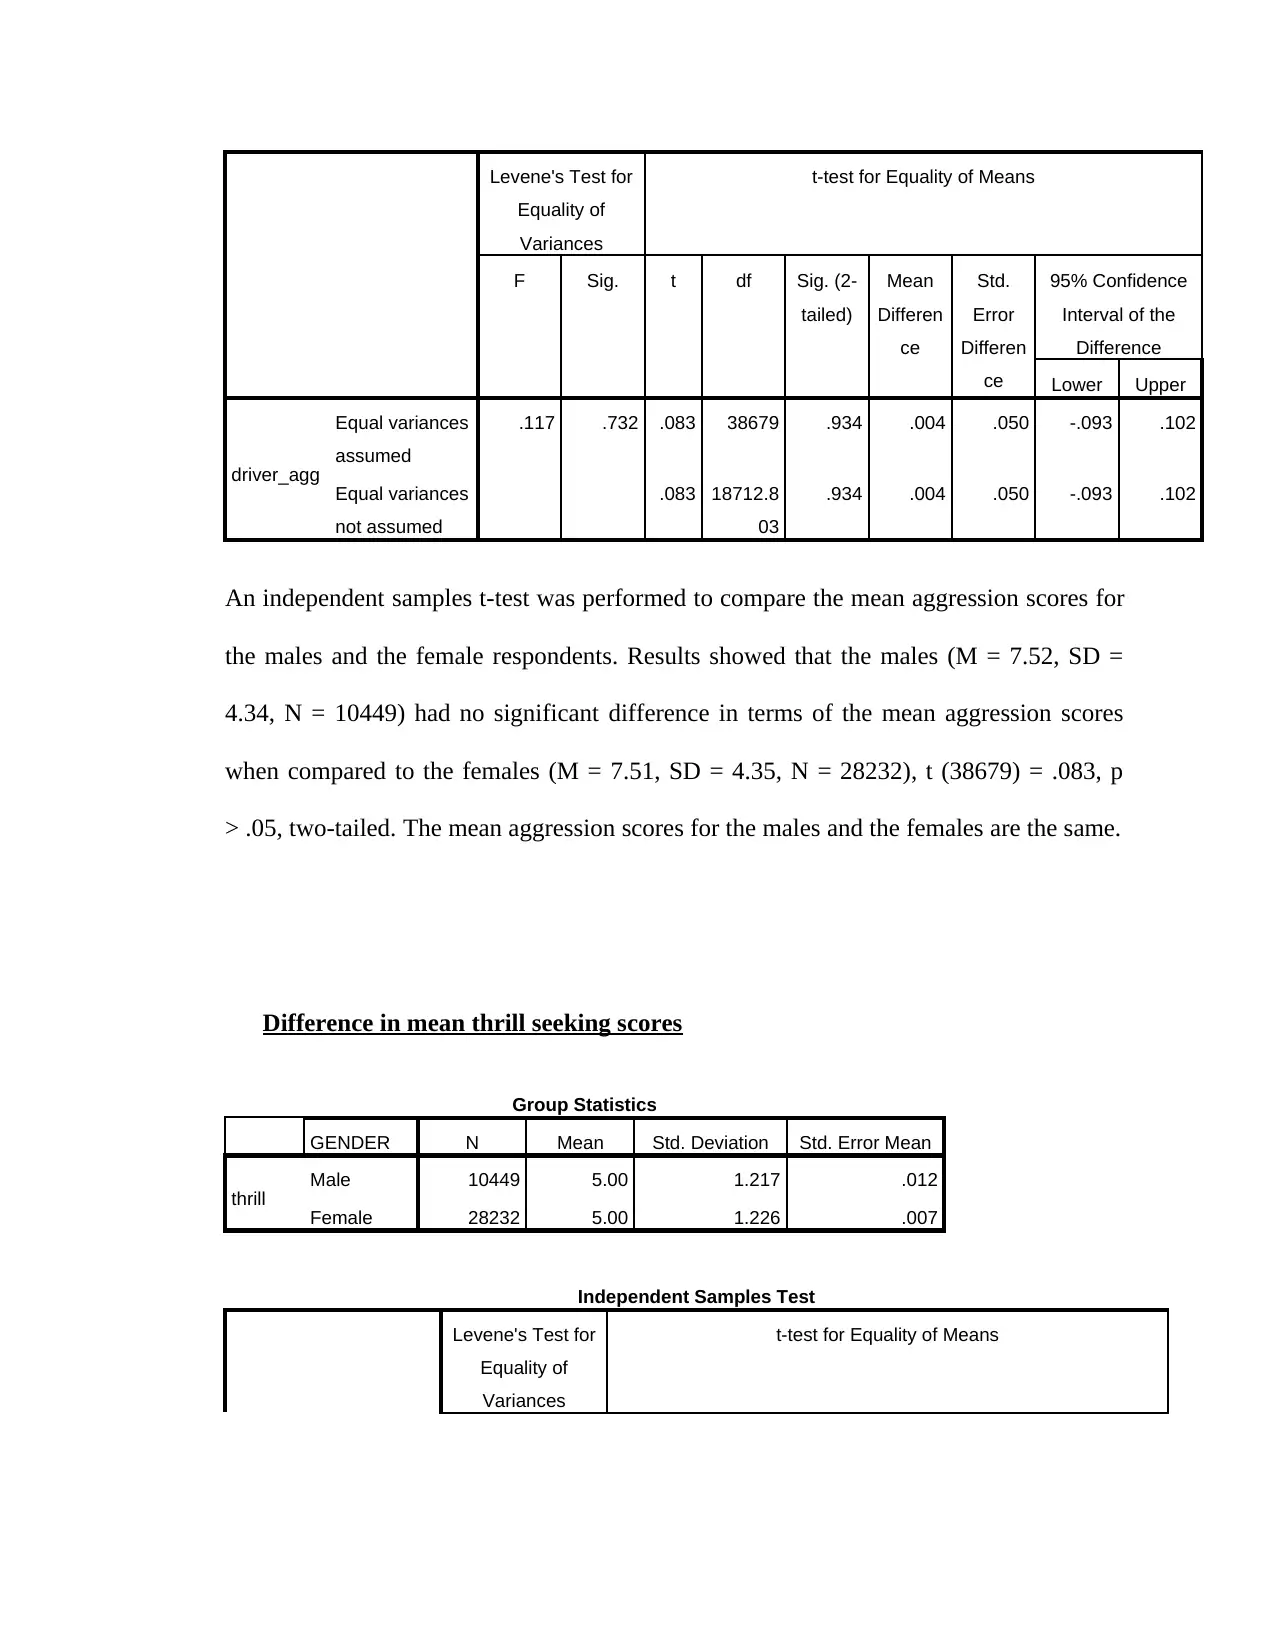
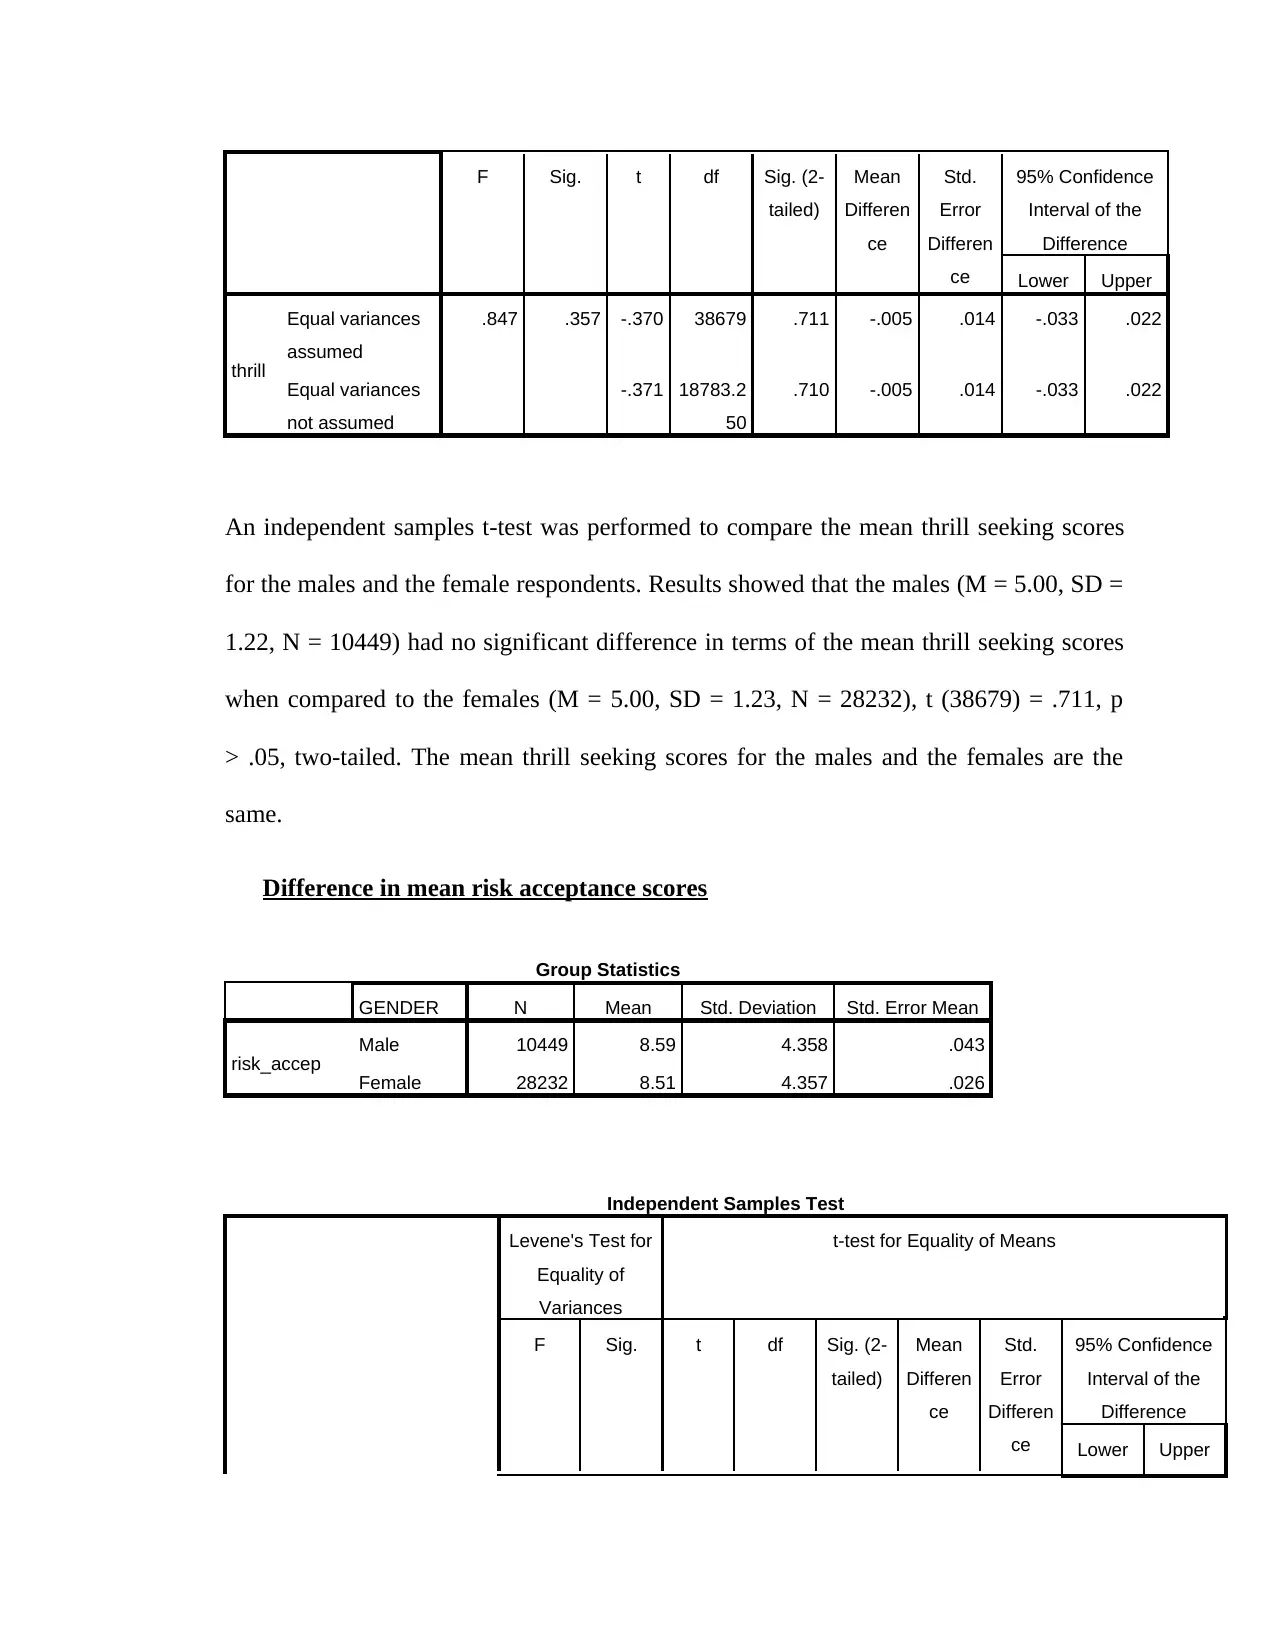
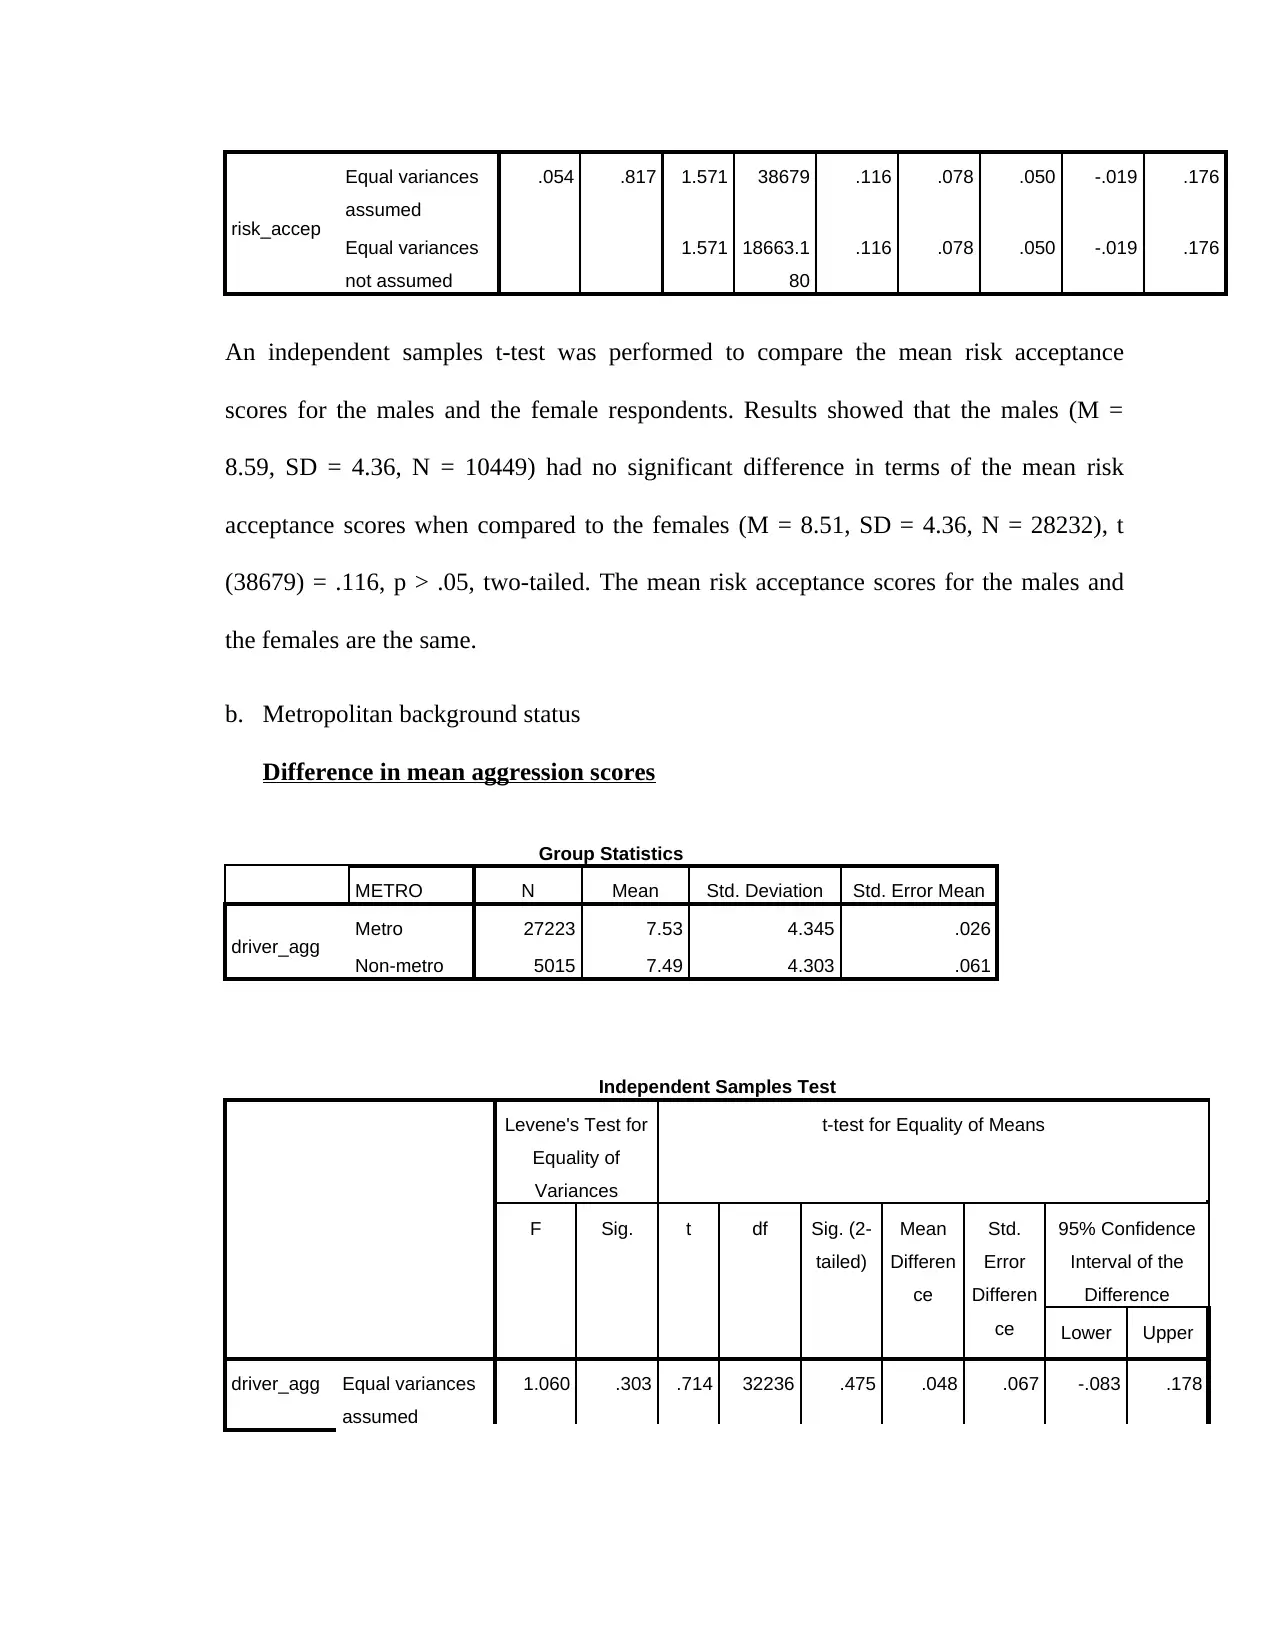
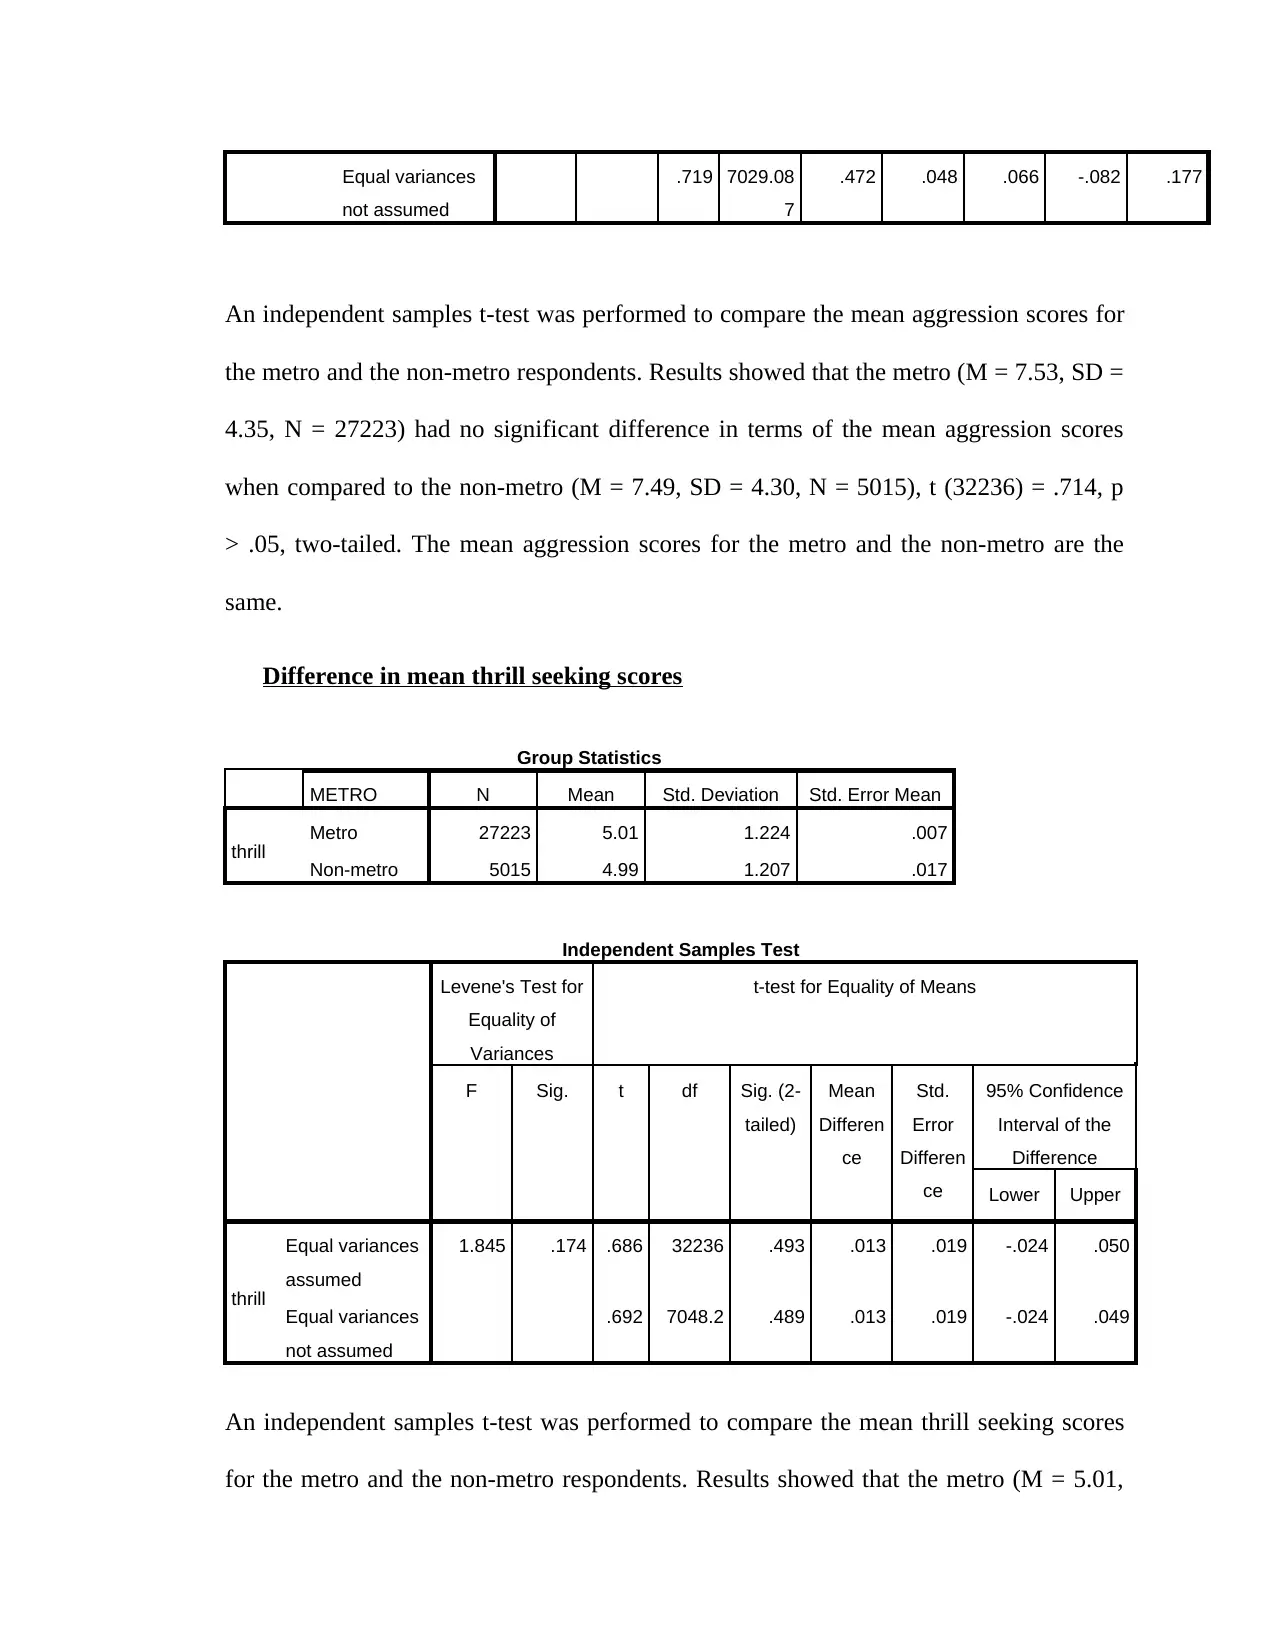
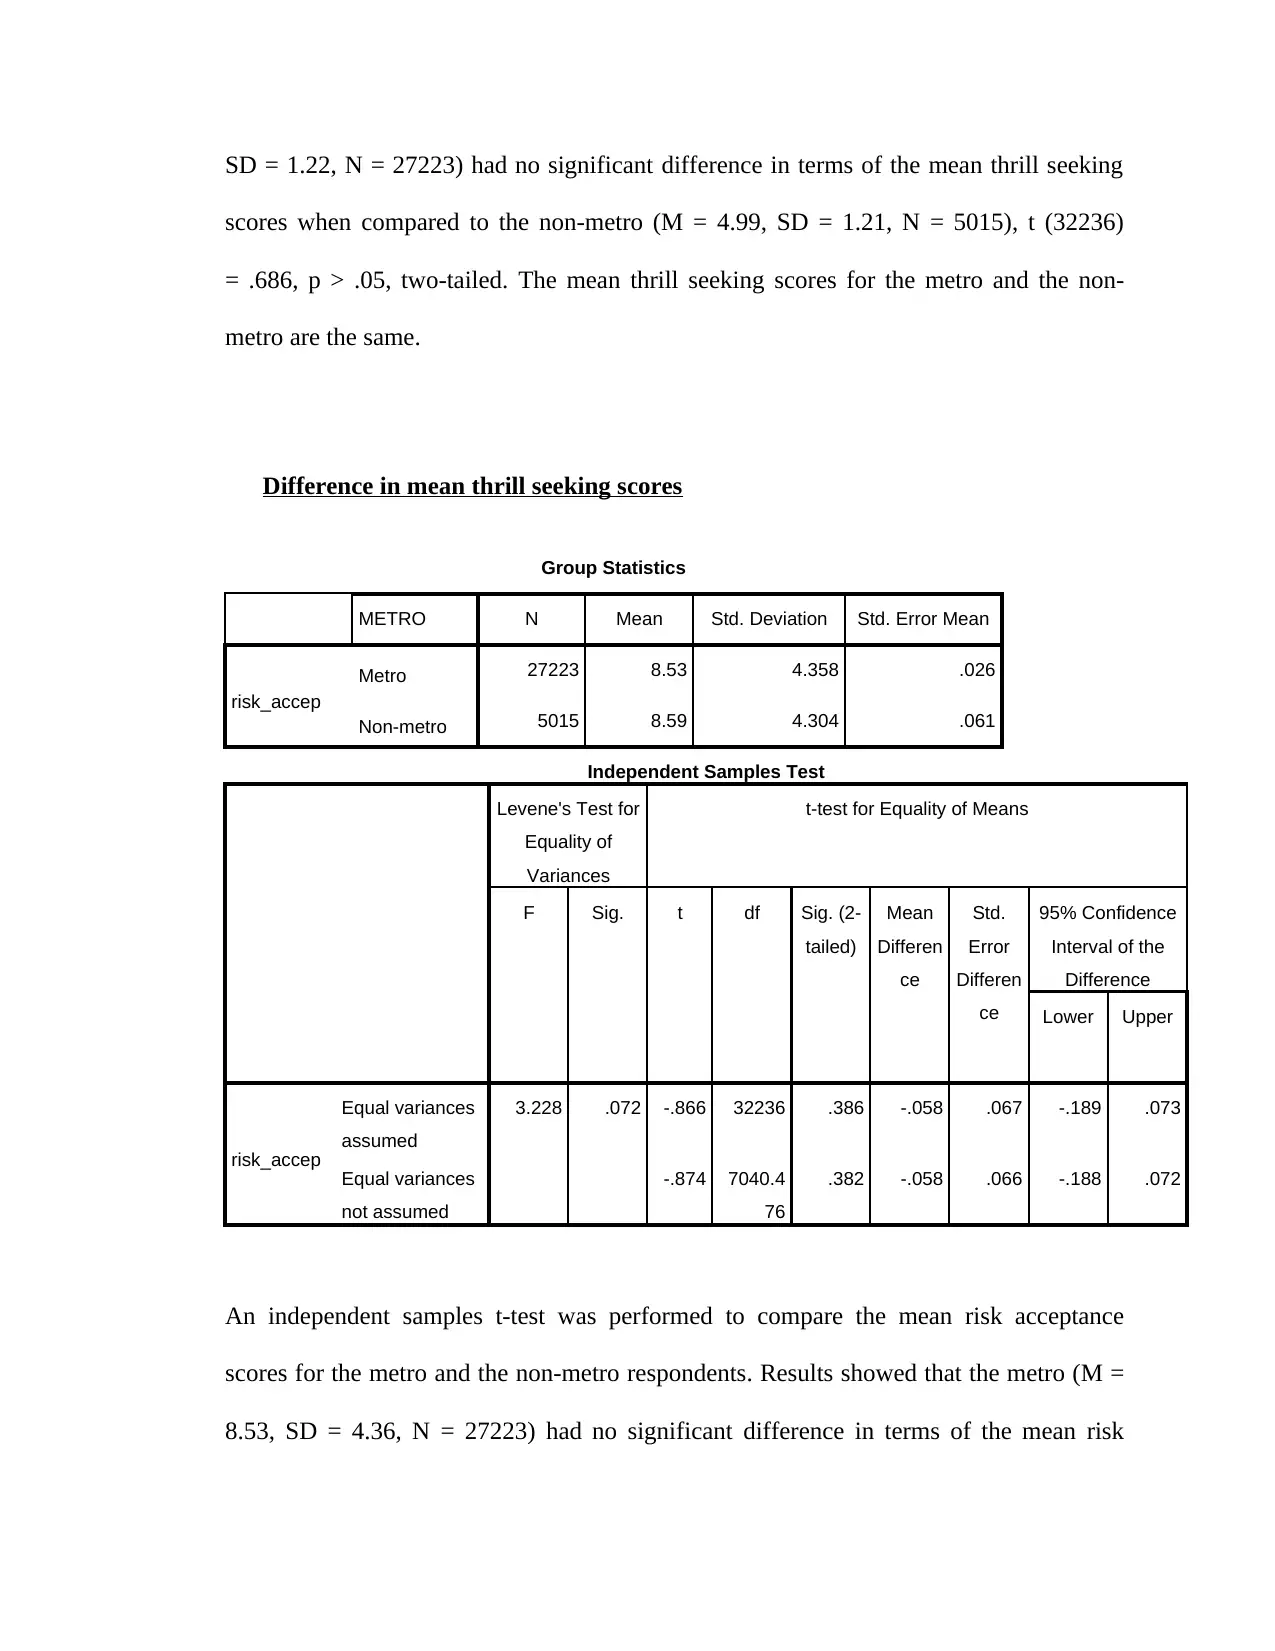
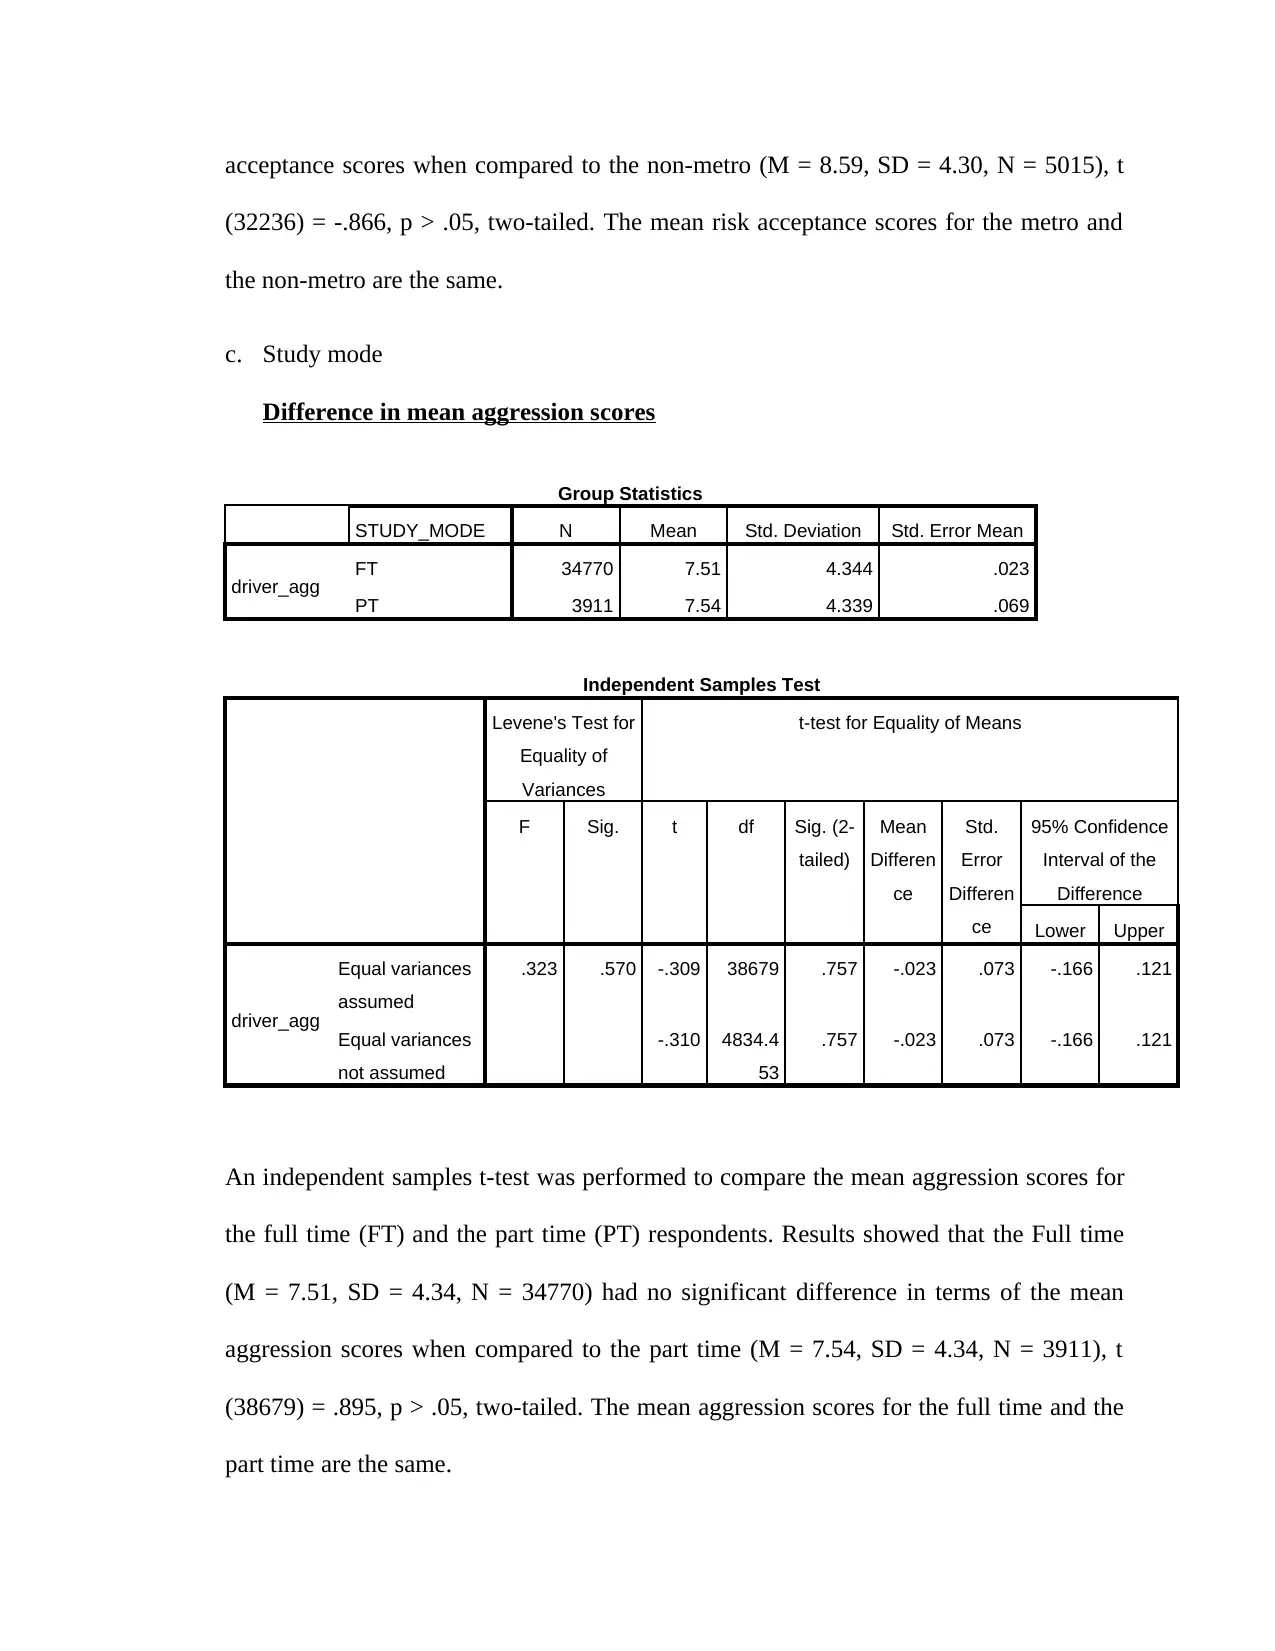
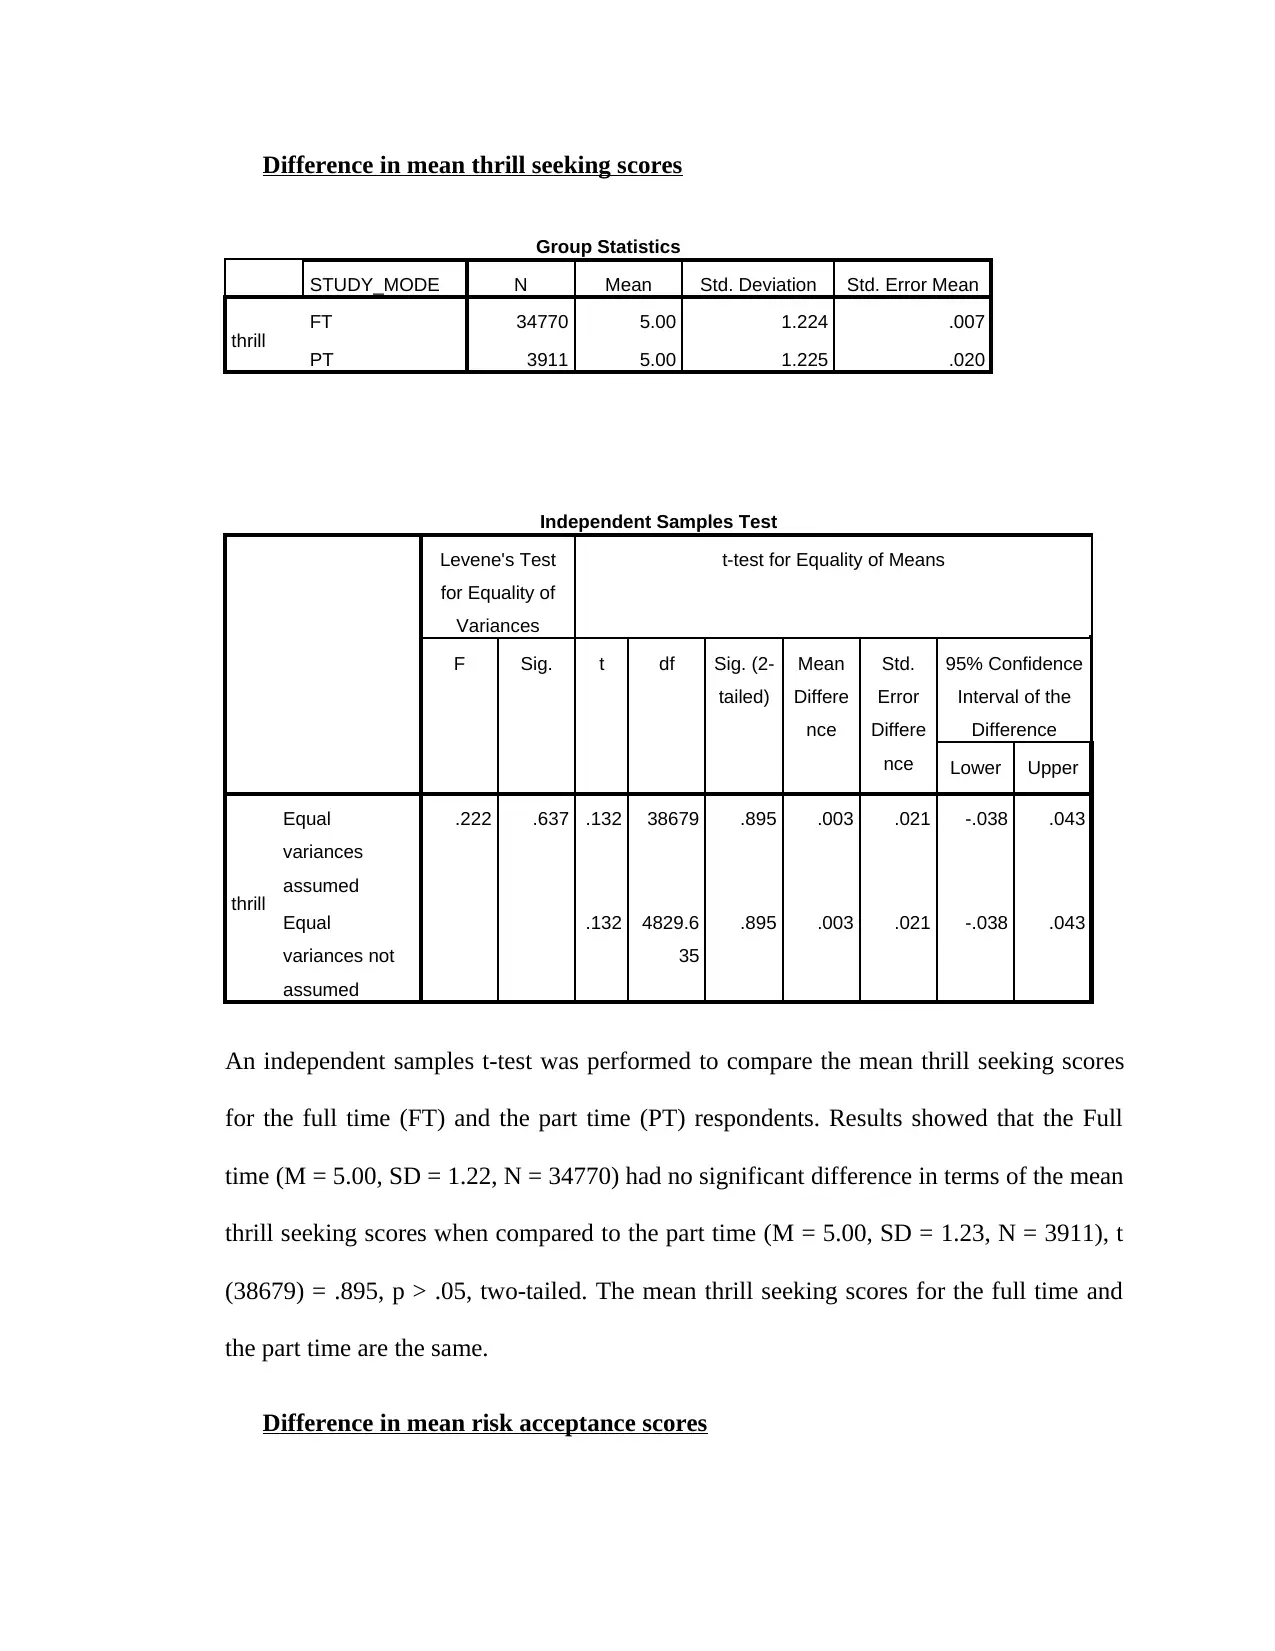
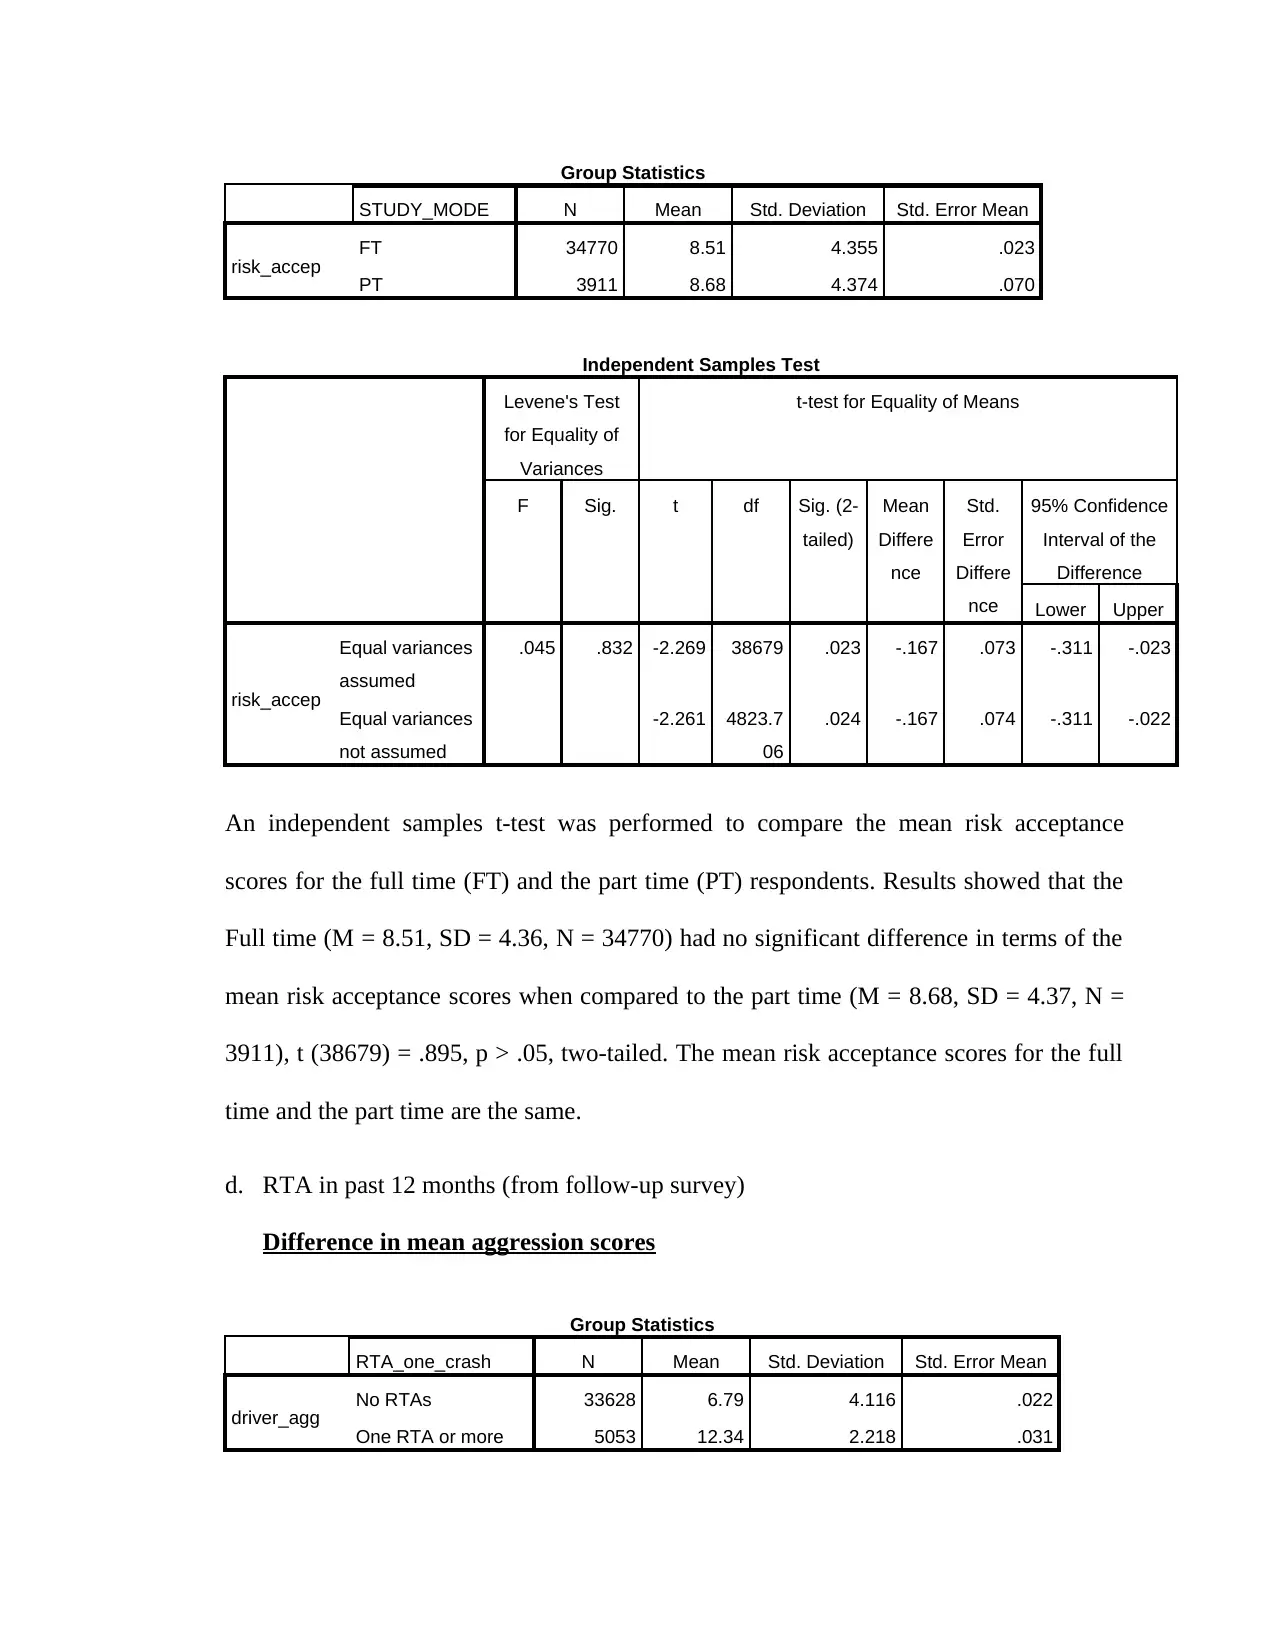
This assignment solution analyzes a dataset from a longitudinal study of ACU student health and wellbeing, focusing on baseline data and selected follow-up data. The analysis includes descriptive statistics for demographic information (cohort year, state, age, living arrangements, faculty, degree type, study type, and fees status), providing frequencies and percentages for each category. The solution also includes the calculation of mean, standard deviation, minimum, and maximum values for age. Furthermore, the assignment involves performing independent samples t-tests to compare mean aggression, thrill-seeking, and risk acceptance scores across different groups, including gender, metropolitan background status, and study mode (full-time/part-time). The results of the t-tests, including t-values, degrees of freedom, p-values, and confidence intervals, are presented, along with interpretations of the statistical significance of the differences between groups. The assignment is designed to apply statistical theory and use various methods of statistical analysis to answer specific research questions relevant to public health.

Biostatistics
Student Name:
Instructor Name:
Course Number:
16 April 2019
Student Name:
Instructor Name:
Course Number:
16 April 2019
Paraphrase This Document
Need a fresh take? Get an instant paraphrase of this document with our AI Paraphraser

Assessment Task 1: Analysis of dataset
1. In your SPSS file, age (at time of enrolment) is given as a continuous variable.
a. What is the mean, standard deviation, minimum and maximum values for age?
Answer
The average age of the ACU cohort is 20.5 years old with a standard deviation of 4.89.
The minimum and maximum ages are 16 years old and 59 years old respectively.
Descriptive Statistics
N Minimum Maximum Mean Std. Deviation
AGE 38681 16 59 20.50 4.888
Valid N (listwise) 38681
b. What is the frequency (% and number) of students in each of these new age
categories?
Answer
Age group
Frequency Percent Valid Percent Cumulative
Percent
Valid
< 18 yrs. old 17760 45.9 45.9 45.9
19-21 yrs. old 11672 30.2 30.2 76.1
22-25 yrs. old 5494 14.2 14.2 90.3
> 26 yrs. old 3755 9.7 9.7 100.0
Total 38681 100.0 100.0
2. Descriptive statistics for the demographic information of the students
Answer
Demographic characteristics Frequency (n) Percent (%)
Cohort
2005 3259 8.4
2006 3615 9.3

2007 3944 10.2
2008 4086 10.6
2009 5010 13.0
2010 5687 14.7
2011 6383 16.5
2012 6697 17.3
Total 38681 100.0
State
NSW 15860 41.0
Victoria 13571 35.1
Queensland 7528 19.5
ACT 1722 4.5
Total 38681 100.0
Age
< 18 yrs. old 17760 45.9
19-21 yrs. old 11672 30.2
22-25 yrs. old 5494 14.2
> 26 yrs. old 3755 9.7
Total 38681 100.0
Living Arrangement
At home 20840 53.9
College/student
accommodation
6850 17.7
Independently 10991 28.4
Total 38681 100.0
Faculty
Arts and Sciences 9004 23.3
Education 15038 38.9
Health Sciences 11729 30.3
Theology and Philosophy 588 1.5
Business 2322 6.0
Total 38681 100.0
Degree Type
Single 34620 89.5
Double 4061 10.5
Total 38681 100.0
Metro
Metro 27223 70.4
Non-metro 5015 13.0
⊘ This is a preview!⊘
Do you want full access?
Subscribe today to unlock all pages.

Trusted by 1+ million students worldwide

Missing 6443 16.7
Total 38681 100.0
Study Type
FT 34770 89.9
PT 3911 10.1
Total 38681 100.0
Fees Status
Domestic 32238 83.3
International 6443 16.7
Total 38681 100.0
The above table gives the frequencies for the demographic characteristics. As can be
seen, majority were the 2012 cohorts (17.3%, n = 6697) and most of the participants
came from NSW state (41.0%, n = 15860). In terms of age, majority were aged either 18
years old or less (45.9%, n = 17760). Most common living arrangement was living at
home (53.9%, n = 20840) and majority of the students were in the education faculty
(38.9%, n = 15038) with most students taking single degree programs (89.5%, n =
34620).
3. Testing for the difference in means
Answer
a. Gender
Difference in mean aggression scores
Group Statistics
GENDER N Mean Std. Deviation Std. Error Mean
driver_agg Male 10449 7.52 4.335 .042
Female 28232 7.51 4.347 .026
Independent Samples Test
Total 38681 100.0
Study Type
FT 34770 89.9
PT 3911 10.1
Total 38681 100.0
Fees Status
Domestic 32238 83.3
International 6443 16.7
Total 38681 100.0
The above table gives the frequencies for the demographic characteristics. As can be
seen, majority were the 2012 cohorts (17.3%, n = 6697) and most of the participants
came from NSW state (41.0%, n = 15860). In terms of age, majority were aged either 18
years old or less (45.9%, n = 17760). Most common living arrangement was living at
home (53.9%, n = 20840) and majority of the students were in the education faculty
(38.9%, n = 15038) with most students taking single degree programs (89.5%, n =
34620).
3. Testing for the difference in means
Answer
a. Gender
Difference in mean aggression scores
Group Statistics
GENDER N Mean Std. Deviation Std. Error Mean
driver_agg Male 10449 7.52 4.335 .042
Female 28232 7.51 4.347 .026
Independent Samples Test
Paraphrase This Document
Need a fresh take? Get an instant paraphrase of this document with our AI Paraphraser

Levene's Test for
Equality of
Variances
t-test for Equality of Means
F Sig. t df Sig. (2-
tailed)
Mean
Differen
ce
Std.
Error
Differen
ce
95% Confidence
Interval of the
Difference
Lower Upper
driver_agg
Equal variances
assumed
.117 .732 .083 38679 .934 .004 .050 -.093 .102
Equal variances
not assumed
.083 18712.8
03
.934 .004 .050 -.093 .102
An independent samples t-test was performed to compare the mean aggression scores for
the males and the female respondents. Results showed that the males (M = 7.52, SD =
4.34, N = 10449) had no significant difference in terms of the mean aggression scores
when compared to the females (M = 7.51, SD = 4.35, N = 28232), t (38679) = .083, p
> .05, two-tailed. The mean aggression scores for the males and the females are the same.
Difference in mean thrill seeking scores
Group Statistics
GENDER N Mean Std. Deviation Std. Error Mean
thrill Male 10449 5.00 1.217 .012
Female 28232 5.00 1.226 .007
Independent Samples Test
Levene's Test for
Equality of
Variances
t-test for Equality of Means
Equality of
Variances
t-test for Equality of Means
F Sig. t df Sig. (2-
tailed)
Mean
Differen
ce
Std.
Error
Differen
ce
95% Confidence
Interval of the
Difference
Lower Upper
driver_agg
Equal variances
assumed
.117 .732 .083 38679 .934 .004 .050 -.093 .102
Equal variances
not assumed
.083 18712.8
03
.934 .004 .050 -.093 .102
An independent samples t-test was performed to compare the mean aggression scores for
the males and the female respondents. Results showed that the males (M = 7.52, SD =
4.34, N = 10449) had no significant difference in terms of the mean aggression scores
when compared to the females (M = 7.51, SD = 4.35, N = 28232), t (38679) = .083, p
> .05, two-tailed. The mean aggression scores for the males and the females are the same.
Difference in mean thrill seeking scores
Group Statistics
GENDER N Mean Std. Deviation Std. Error Mean
thrill Male 10449 5.00 1.217 .012
Female 28232 5.00 1.226 .007
Independent Samples Test
Levene's Test for
Equality of
Variances
t-test for Equality of Means

F Sig. t df Sig. (2-
tailed)
Mean
Differen
ce
Std.
Error
Differen
ce
95% Confidence
Interval of the
Difference
Lower Upper
thrill
Equal variances
assumed
.847 .357 -.370 38679 .711 -.005 .014 -.033 .022
Equal variances
not assumed
-.371 18783.2
50
.710 -.005 .014 -.033 .022
An independent samples t-test was performed to compare the mean thrill seeking scores
for the males and the female respondents. Results showed that the males (M = 5.00, SD =
1.22, N = 10449) had no significant difference in terms of the mean thrill seeking scores
when compared to the females (M = 5.00, SD = 1.23, N = 28232), t (38679) = .711, p
> .05, two-tailed. The mean thrill seeking scores for the males and the females are the
same.
Difference in mean risk acceptance scores
Group Statistics
GENDER N Mean Std. Deviation Std. Error Mean
risk_accep Male 10449 8.59 4.358 .043
Female 28232 8.51 4.357 .026
Independent Samples Test
Levene's Test for
Equality of
Variances
t-test for Equality of Means
F Sig. t df Sig. (2-
tailed)
Mean
Differen
ce
Std.
Error
Differen
ce
95% Confidence
Interval of the
Difference
Lower Upper
tailed)
Mean
Differen
ce
Std.
Error
Differen
ce
95% Confidence
Interval of the
Difference
Lower Upper
thrill
Equal variances
assumed
.847 .357 -.370 38679 .711 -.005 .014 -.033 .022
Equal variances
not assumed
-.371 18783.2
50
.710 -.005 .014 -.033 .022
An independent samples t-test was performed to compare the mean thrill seeking scores
for the males and the female respondents. Results showed that the males (M = 5.00, SD =
1.22, N = 10449) had no significant difference in terms of the mean thrill seeking scores
when compared to the females (M = 5.00, SD = 1.23, N = 28232), t (38679) = .711, p
> .05, two-tailed. The mean thrill seeking scores for the males and the females are the
same.
Difference in mean risk acceptance scores
Group Statistics
GENDER N Mean Std. Deviation Std. Error Mean
risk_accep Male 10449 8.59 4.358 .043
Female 28232 8.51 4.357 .026
Independent Samples Test
Levene's Test for
Equality of
Variances
t-test for Equality of Means
F Sig. t df Sig. (2-
tailed)
Mean
Differen
ce
Std.
Error
Differen
ce
95% Confidence
Interval of the
Difference
Lower Upper
⊘ This is a preview!⊘
Do you want full access?
Subscribe today to unlock all pages.

Trusted by 1+ million students worldwide

risk_accep
Equal variances
assumed
.054 .817 1.571 38679 .116 .078 .050 -.019 .176
Equal variances
not assumed
1.571 18663.1
80
.116 .078 .050 -.019 .176
An independent samples t-test was performed to compare the mean risk acceptance
scores for the males and the female respondents. Results showed that the males (M =
8.59, SD = 4.36, N = 10449) had no significant difference in terms of the mean risk
acceptance scores when compared to the females (M = 8.51, SD = 4.36, N = 28232), t
(38679) = .116, p > .05, two-tailed. The mean risk acceptance scores for the males and
the females are the same.
b. Metropolitan background status
Difference in mean aggression scores
Group Statistics
METRO N Mean Std. Deviation Std. Error Mean
driver_agg Metro 27223 7.53 4.345 .026
Non-metro 5015 7.49 4.303 .061
Independent Samples Test
Levene's Test for
Equality of
Variances
t-test for Equality of Means
F Sig. t df Sig. (2-
tailed)
Mean
Differen
ce
Std.
Error
Differen
ce
95% Confidence
Interval of the
Difference
Lower Upper
driver_agg Equal variances
assumed
1.060 .303 .714 32236 .475 .048 .067 -.083 .178
Equal variances
assumed
.054 .817 1.571 38679 .116 .078 .050 -.019 .176
Equal variances
not assumed
1.571 18663.1
80
.116 .078 .050 -.019 .176
An independent samples t-test was performed to compare the mean risk acceptance
scores for the males and the female respondents. Results showed that the males (M =
8.59, SD = 4.36, N = 10449) had no significant difference in terms of the mean risk
acceptance scores when compared to the females (M = 8.51, SD = 4.36, N = 28232), t
(38679) = .116, p > .05, two-tailed. The mean risk acceptance scores for the males and
the females are the same.
b. Metropolitan background status
Difference in mean aggression scores
Group Statistics
METRO N Mean Std. Deviation Std. Error Mean
driver_agg Metro 27223 7.53 4.345 .026
Non-metro 5015 7.49 4.303 .061
Independent Samples Test
Levene's Test for
Equality of
Variances
t-test for Equality of Means
F Sig. t df Sig. (2-
tailed)
Mean
Differen
ce
Std.
Error
Differen
ce
95% Confidence
Interval of the
Difference
Lower Upper
driver_agg Equal variances
assumed
1.060 .303 .714 32236 .475 .048 .067 -.083 .178
Paraphrase This Document
Need a fresh take? Get an instant paraphrase of this document with our AI Paraphraser

Equal variances
not assumed
.719 7029.08
7
.472 .048 .066 -.082 .177
An independent samples t-test was performed to compare the mean aggression scores for
the metro and the non-metro respondents. Results showed that the metro (M = 7.53, SD =
4.35, N = 27223) had no significant difference in terms of the mean aggression scores
when compared to the non-metro (M = 7.49, SD = 4.30, N = 5015), t (32236) = .714, p
> .05, two-tailed. The mean aggression scores for the metro and the non-metro are the
same.
Difference in mean thrill seeking scores
Group Statistics
METRO N Mean Std. Deviation Std. Error Mean
thrill Metro 27223 5.01 1.224 .007
Non-metro 5015 4.99 1.207 .017
Independent Samples Test
Levene's Test for
Equality of
Variances
t-test for Equality of Means
F Sig. t df Sig. (2-
tailed)
Mean
Differen
ce
Std.
Error
Differen
ce
95% Confidence
Interval of the
Difference
Lower Upper
thrill
Equal variances
assumed
1.845 .174 .686 32236 .493 .013 .019 -.024 .050
Equal variances
not assumed
.692 7048.2 .489 .013 .019 -.024 .049
An independent samples t-test was performed to compare the mean thrill seeking scores
for the metro and the non-metro respondents. Results showed that the metro (M = 5.01,
not assumed
.719 7029.08
7
.472 .048 .066 -.082 .177
An independent samples t-test was performed to compare the mean aggression scores for
the metro and the non-metro respondents. Results showed that the metro (M = 7.53, SD =
4.35, N = 27223) had no significant difference in terms of the mean aggression scores
when compared to the non-metro (M = 7.49, SD = 4.30, N = 5015), t (32236) = .714, p
> .05, two-tailed. The mean aggression scores for the metro and the non-metro are the
same.
Difference in mean thrill seeking scores
Group Statistics
METRO N Mean Std. Deviation Std. Error Mean
thrill Metro 27223 5.01 1.224 .007
Non-metro 5015 4.99 1.207 .017
Independent Samples Test
Levene's Test for
Equality of
Variances
t-test for Equality of Means
F Sig. t df Sig. (2-
tailed)
Mean
Differen
ce
Std.
Error
Differen
ce
95% Confidence
Interval of the
Difference
Lower Upper
thrill
Equal variances
assumed
1.845 .174 .686 32236 .493 .013 .019 -.024 .050
Equal variances
not assumed
.692 7048.2 .489 .013 .019 -.024 .049
An independent samples t-test was performed to compare the mean thrill seeking scores
for the metro and the non-metro respondents. Results showed that the metro (M = 5.01,

SD = 1.22, N = 27223) had no significant difference in terms of the mean thrill seeking
scores when compared to the non-metro (M = 4.99, SD = 1.21, N = 5015), t (32236)
= .686, p > .05, two-tailed. The mean thrill seeking scores for the metro and the non-
metro are the same.
Difference in mean thrill seeking scores
Group Statistics
METRO N Mean Std. Deviation Std. Error Mean
risk_accep
Metro 27223 8.53 4.358 .026
Non-metro 5015 8.59 4.304 .061
Independent Samples Test
Levene's Test for
Equality of
Variances
t-test for Equality of Means
F Sig. t df Sig. (2-
tailed)
Mean
Differen
ce
Std.
Error
Differen
ce
95% Confidence
Interval of the
Difference
Lower Upper
risk_accep
Equal variances
assumed
3.228 .072 -.866 32236 .386 -.058 .067 -.189 .073
Equal variances
not assumed
-.874 7040.4
76
.382 -.058 .066 -.188 .072
An independent samples t-test was performed to compare the mean risk acceptance
scores for the metro and the non-metro respondents. Results showed that the metro (M =
8.53, SD = 4.36, N = 27223) had no significant difference in terms of the mean risk
⊘ This is a preview!⊘
Do you want full access?
Subscribe today to unlock all pages.

Trusted by 1+ million students worldwide

acceptance scores when compared to the non-metro (M = 8.59, SD = 4.30, N = 5015), t
(32236) = -.866, p > .05, two-tailed. The mean risk acceptance scores for the metro and
the non-metro are the same.
c. Study mode
Difference in mean aggression scores
Group Statistics
STUDY_MODE N Mean Std. Deviation Std. Error Mean
driver_agg FT 34770 7.51 4.344 .023
PT 3911 7.54 4.339 .069
Independent Samples Test
Levene's Test for
Equality of
Variances
t-test for Equality of Means
F Sig. t df Sig. (2-
tailed)
Mean
Differen
ce
Std.
Error
Differen
ce
95% Confidence
Interval of the
Difference
Lower Upper
driver_agg
Equal variances
assumed
.323 .570 -.309 38679 .757 -.023 .073 -.166 .121
Equal variances
not assumed
-.310 4834.4
53
.757 -.023 .073 -.166 .121
An independent samples t-test was performed to compare the mean aggression scores for
the full time (FT) and the part time (PT) respondents. Results showed that the Full time
(M = 7.51, SD = 4.34, N = 34770) had no significant difference in terms of the mean
aggression scores when compared to the part time (M = 7.54, SD = 4.34, N = 3911), t
(38679) = .895, p > .05, two-tailed. The mean aggression scores for the full time and the
part time are the same.
Paraphrase This Document
Need a fresh take? Get an instant paraphrase of this document with our AI Paraphraser

Difference in mean thrill seeking scores
Group Statistics
STUDY_MODE N Mean Std. Deviation Std. Error Mean
thrill FT 34770 5.00 1.224 .007
PT 3911 5.00 1.225 .020
Independent Samples Test
Levene's Test
for Equality of
Variances
t-test for Equality of Means
F Sig. t df Sig. (2-
tailed)
Mean
Differe
nce
Std.
Error
Differe
nce
95% Confidence
Interval of the
Difference
Lower Upper
thrill
Equal
variances
assumed
.222 .637 .132 38679 .895 .003 .021 -.038 .043
Equal
variances not
assumed
.132 4829.6
35
.895 .003 .021 -.038 .043
An independent samples t-test was performed to compare the mean thrill seeking scores
for the full time (FT) and the part time (PT) respondents. Results showed that the Full
time (M = 5.00, SD = 1.22, N = 34770) had no significant difference in terms of the mean
thrill seeking scores when compared to the part time (M = 5.00, SD = 1.23, N = 3911), t
(38679) = .895, p > .05, two-tailed. The mean thrill seeking scores for the full time and
the part time are the same.
Difference in mean risk acceptance scores
Group Statistics
STUDY_MODE N Mean Std. Deviation Std. Error Mean
thrill FT 34770 5.00 1.224 .007
PT 3911 5.00 1.225 .020
Independent Samples Test
Levene's Test
for Equality of
Variances
t-test for Equality of Means
F Sig. t df Sig. (2-
tailed)
Mean
Differe
nce
Std.
Error
Differe
nce
95% Confidence
Interval of the
Difference
Lower Upper
thrill
Equal
variances
assumed
.222 .637 .132 38679 .895 .003 .021 -.038 .043
Equal
variances not
assumed
.132 4829.6
35
.895 .003 .021 -.038 .043
An independent samples t-test was performed to compare the mean thrill seeking scores
for the full time (FT) and the part time (PT) respondents. Results showed that the Full
time (M = 5.00, SD = 1.22, N = 34770) had no significant difference in terms of the mean
thrill seeking scores when compared to the part time (M = 5.00, SD = 1.23, N = 3911), t
(38679) = .895, p > .05, two-tailed. The mean thrill seeking scores for the full time and
the part time are the same.
Difference in mean risk acceptance scores

Group Statistics
STUDY_MODE N Mean Std. Deviation Std. Error Mean
risk_accep FT 34770 8.51 4.355 .023
PT 3911 8.68 4.374 .070
Independent Samples Test
Levene's Test
for Equality of
Variances
t-test for Equality of Means
F Sig. t df Sig. (2-
tailed)
Mean
Differe
nce
Std.
Error
Differe
nce
95% Confidence
Interval of the
Difference
Lower Upper
risk_accep
Equal variances
assumed
.045 .832 -2.269 38679 .023 -.167 .073 -.311 -.023
Equal variances
not assumed
-2.261 4823.7
06
.024 -.167 .074 -.311 -.022
An independent samples t-test was performed to compare the mean risk acceptance
scores for the full time (FT) and the part time (PT) respondents. Results showed that the
Full time (M = 8.51, SD = 4.36, N = 34770) had no significant difference in terms of the
mean risk acceptance scores when compared to the part time (M = 8.68, SD = 4.37, N =
3911), t (38679) = .895, p > .05, two-tailed. The mean risk acceptance scores for the full
time and the part time are the same.
d. RTA in past 12 months (from follow-up survey)
Difference in mean aggression scores
Group Statistics
RTA_one_crash N Mean Std. Deviation Std. Error Mean
driver_agg No RTAs 33628 6.79 4.116 .022
One RTA or more 5053 12.34 2.218 .031
⊘ This is a preview!⊘
Do you want full access?
Subscribe today to unlock all pages.

Trusted by 1+ million students worldwide
1 out of 23
Related Documents

Your All-in-One AI-Powered Toolkit for Academic Success.
 +13062052269
info@desklib.com
Available 24*7 on WhatsApp / Email
Unlock your academic potential
Copyright © 2020–2025 A2Z Services. All Rights Reserved. Developed and managed by ZUCOL.