Longitudinal Study: Depression and Obesity in ACU Students (PUBH620)

Verified

Added on  2023/04/03

|10
|1765
|225
Report
AI Summary
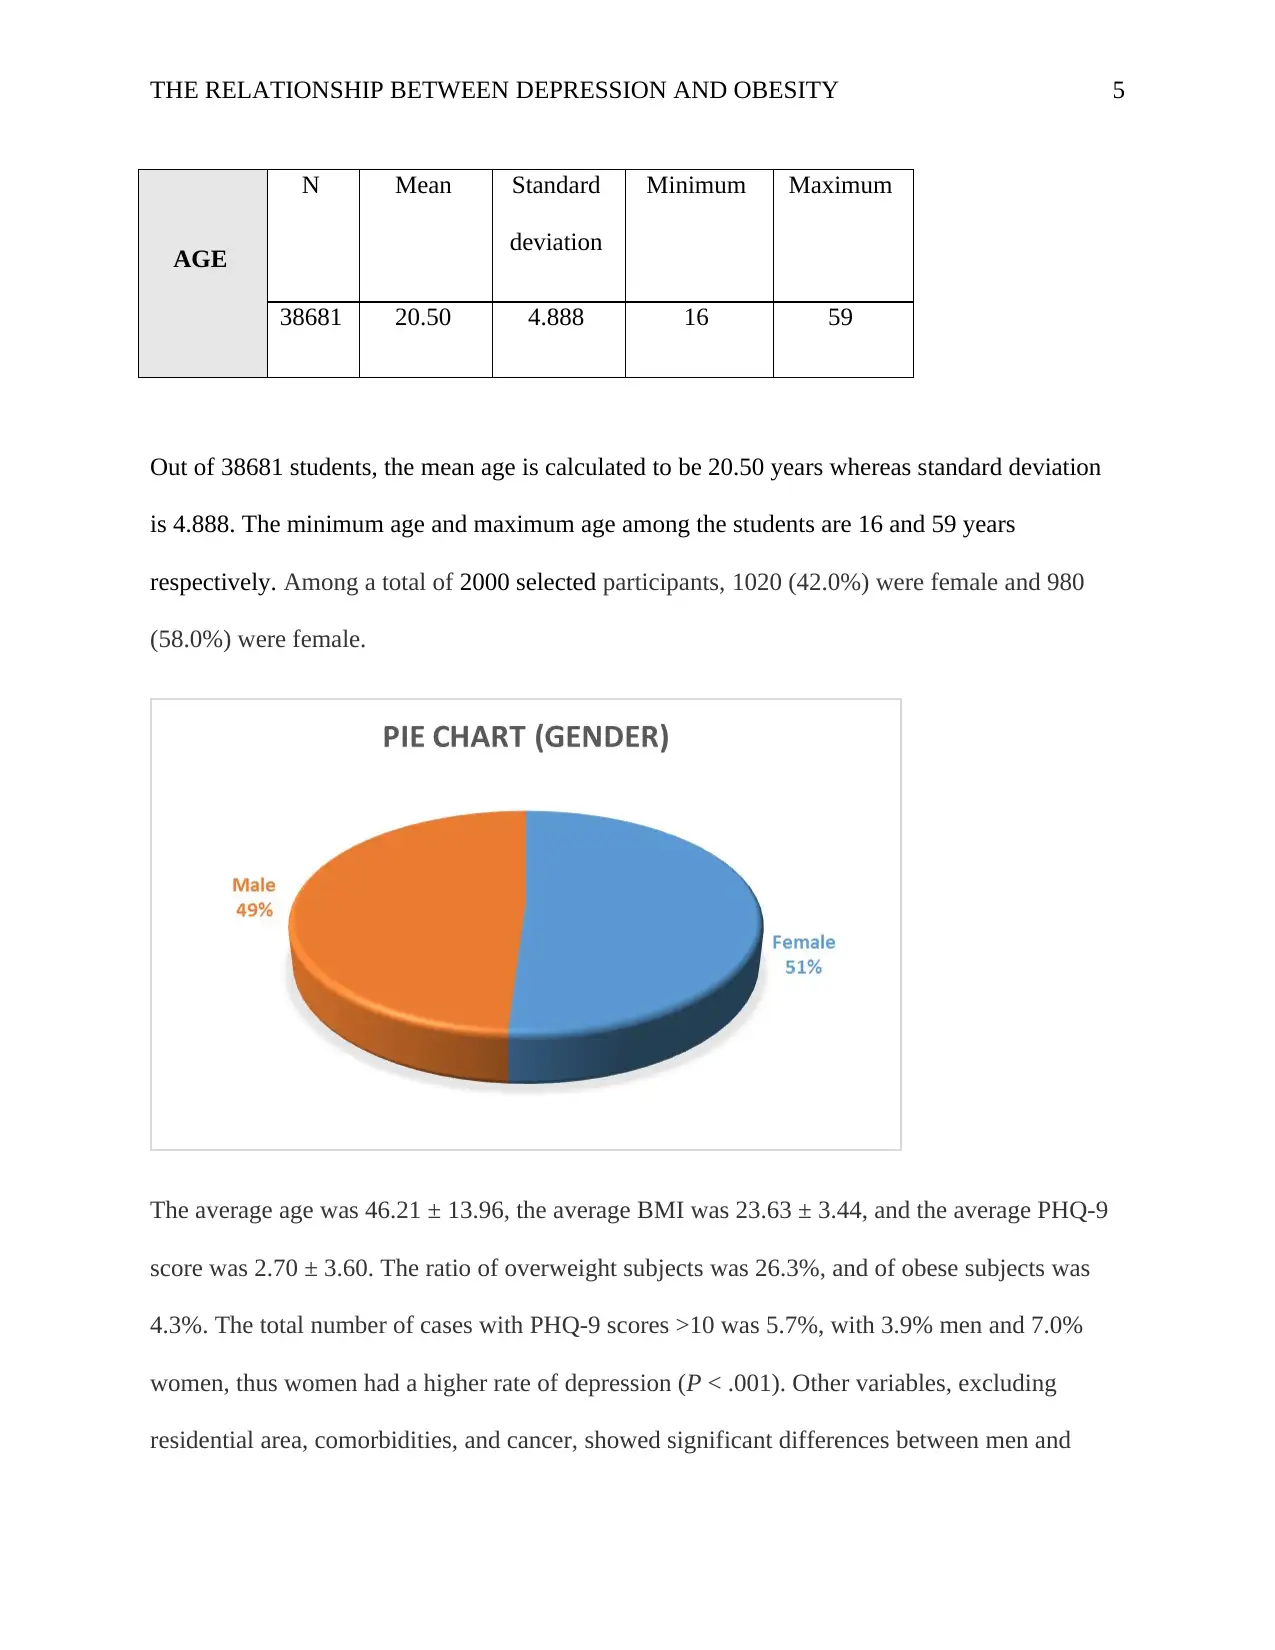
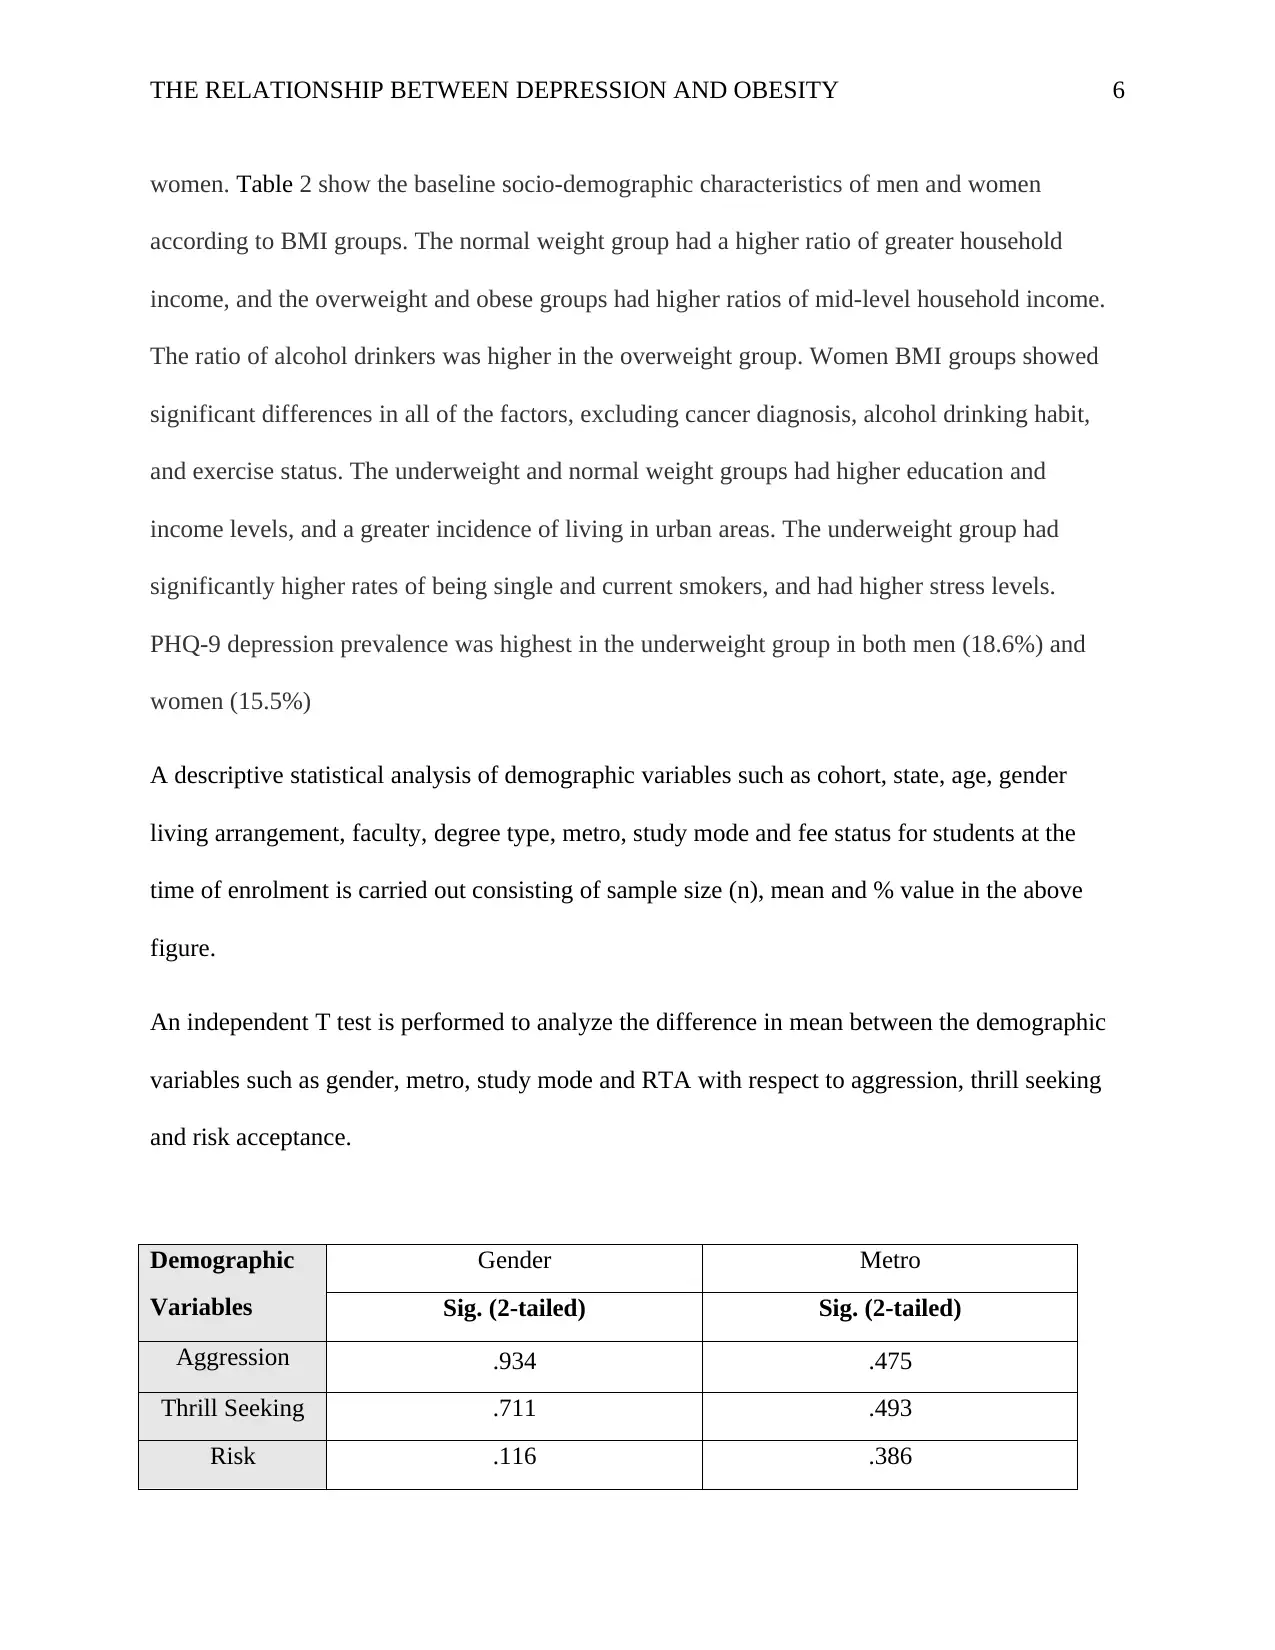
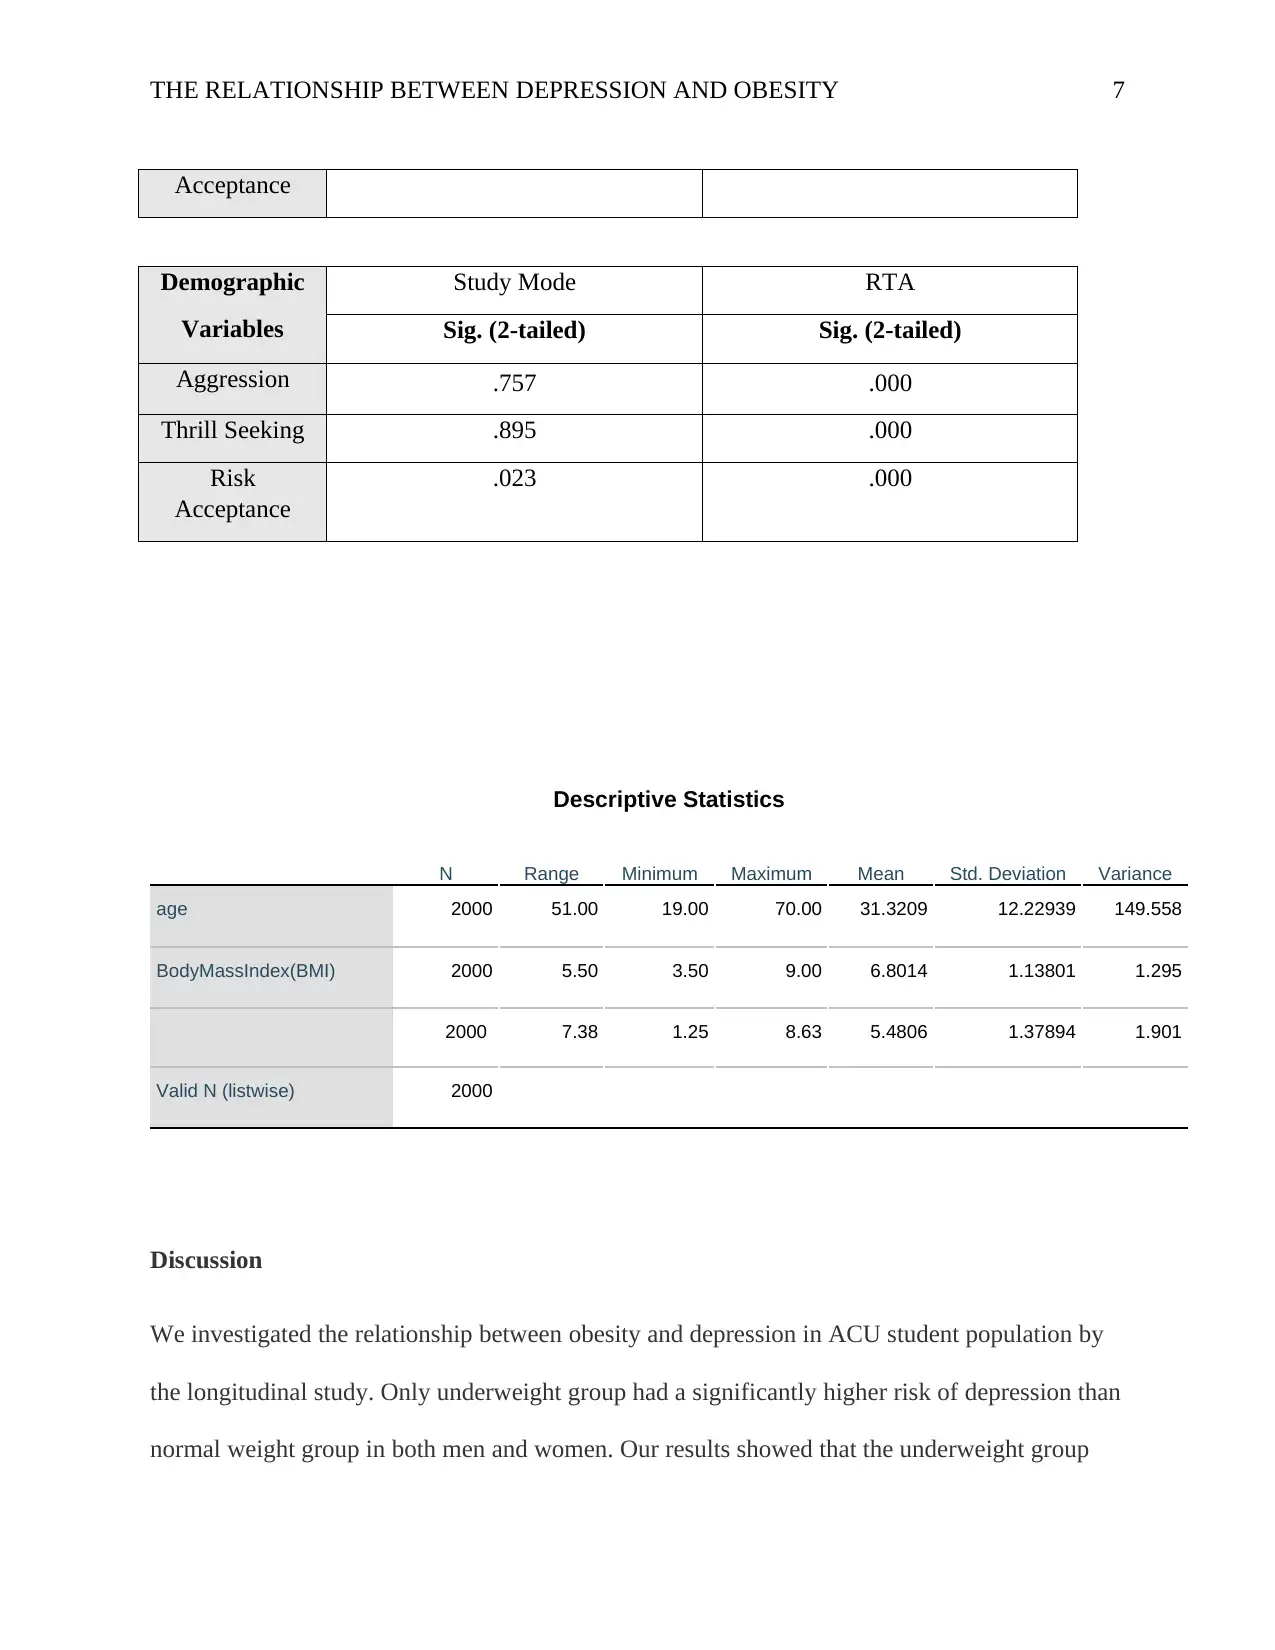
This report presents a longitudinal study investigating the relationship between depression and obesity among ACU students. The study analyzed data from 2000 students, examining the correlation between depression scores and body mass index (BMI). The research found a significant association between underweight status and a higher risk of depression, in both men and women. The study utilized statistical methods like t-tests, chi-square tests, and regression analysis to analyze the data. The results indicate that the prevalence of depression varied significantly based on body weight status, with the underweight group showing the highest rates of depression. The study also discusses the limitations, including the cross-sectional design, and suggests the need for further longitudinal studies. The findings of the study are presented in a format suitable for submission to the Medical Journal of Australia.
Document Page
Running head: THE RELATIONSHIP BETWEEN DEPRESSION AND OBESITY 1
The Relationship between Depression and Obesity among ACU Students
By (Student’s Name)
(Institution Affiliation)
(Date of Submission)
tabler-icon-diamond-filled.svg

Secure Best Marks with AI Grader

Need help grading? Try our AI Grader for instant feedback on your assignments.
Document Page
THE RELATIONSHIP BETWEEN DEPRESSION AND OBESITY 2
Abstract
In the recent past, conflicting results have been produced regarding the relationship between
depression and obesity and only few studies have confirmed the existence of the relationship
between depression and obesity. In this paper, a longitudinal study was done to investigate the
relationship between depression and obesity among the ACU students using the data from a
chosen sample of students within the institution. A total sample of 2000 students (1020 females
and 980 men) aged 15 to 50 years took part in the study. In this study, current score of
depression was define as a score that is greater or equal to 10 on the 9 item Patient Health
Questionnaire. The body weight and height of the students were measured and the body mass
index was as well determined and calculated. The participants were then asked to fill and
complete the questionnaires about the social-demographic factors and health related issues.
Statistical tests such as t-test, chi-square, and regression analysis were conducted to examine the
relationship between depression and obesity. Based on the status of the body weight, there exist a
significant difference in the prevalence of depression (underweight: 17%, normal weight: 6 %,
overweight: 5%, obese {Body Mass Index ≥ 35}: 7 %). This study confirms differences in the
depression depending upon the status of body weight. The results showed that being underweight
was associated with a high risk of developing depression in both men and females.
Introduction
The health conditions of depression and obesity are significant globally with an estimated 350
million suffering from depression and 500 million people having obese conditions (Zukiewicz-
Sobczak, 2014). Also, there is a high association between obesity and depression. For instance,
Document Page
THE RELATIONSHIP BETWEEN DEPRESSION AND OBESITY 3
individuals with obese conditions are 1.18 times likely to experience depression than those who
are not overweight. Similarly, overweight and obese individuals are 1.55 times more likely to
suffer from depression. Globally, the co-occurrence of depression and obesity conditions is
associated with issues such as poor health conditions, social stigma and low self-esteem (Roca,
2016). The symptoms of depression among obese individuals include reduced quality of life and
reduced participation in the labor force. According to research by (Blaine, 2008), there is a 23%
prevalence of depressions conditions among overweight and obese individuals as compared to
11% prevalence of depressed individuals among the underweight populations.
Obesity and depression contribute to the global burdens of economic costs, morbidities, and
mortalities. These conditions correlate with many complications such as cardiovascular diseases
and diabetes mellitus.
Previous studies on the relationship between obesity and depression had contradictory
outcomes. Some studies reported that obese people also tend to have depression, but other
studies did not support this conclusion in all subjects (Blaine, 2018)). Several studies found no
relationship between obesity and depression, whereas others reported a positive relationship
between obesity and depression in women but not in men. Obesity and depression have a
reciprocal relationship. Several factors can affect the relationship
between obesity and depression such as sex, age, and ethnic differences (Calman, 2015). Recent
research that examined the longitudinal association between obesity and depression reported that
a higher body mass index tended to cause depression and vice versa. Interestingly, the same
results were obtained in twin cohort studies. The aim of this study was to investigate the
relationship between obesity and depression among ACU students using the longitudinal studies.
Document Page
THE RELATIONSHIP BETWEEN DEPRESSION AND OBESITY 4
Methods
Participants
This study used data of the Sixth Korea National Health and Nutrition Examination Survey
(KNHANES VI-2), 2014. The study enrolled conducted in adults aged ≥19 years who
participated in the KNHANES VI-2 health survey and underwent medical examination. We
selected 4026 of a total of 7550 subjects (1692 men, 2334 women), excluding the following: age
<19 or >70, height and weight not measured, PHQ-9 survey not answered, pregnant women, and
those undergoing treatment for depression. All of the participants provided informed consent
before data collection, and the survey was approved by the KCDC Bioethics Committee.
Measurements
Height was measured in centimeters and weight was measured in kilograms using a digital scale.
BMI was calculated as the person's weight in kilograms divided by the square of the height. We
classified the subjects as underweight (BMI <18), normal weight (BMI between 18.0and 25.0),
overweight (BMI between 25.0 and 29.9), and obese (BMI >30) according to WHO standards.
We included a separate “above overweight” group (BMI >25.0) considering that the typical BMI
cut-off for obesity in students. In this study, the waist was measured down to 0.01 cm with a
non-elastic measuring tape to avoid pressing the subject's skin, with the subject in the exhaled
state after marking the subject's sides between the lowest rib and the top of the iliac crest with a
pen.
Results
tabler-icon-diamond-filled.svg

Secure Best Marks with AI Grader

Need help grading? Try our AI Grader for instant feedback on your assignments.
Document Page
THE RELATIONSHIP BETWEEN DEPRESSION AND OBESITY 5
AGE
N Mean Standard
deviation
Minimum Maximum
38681 20.50 4.888 16 59
Out of 38681 students, the mean age is calculated to be 20.50 years whereas standard deviation
is 4.888. The minimum age and maximum age among the students are 16 and 59 years
respectively. Among a total of 2000 selected participants, 1020 (42.0%) were female and 980
(58.0%) were female.
The average age was 46.21 ± 13.96, the average BMI was 23.63 ± 3.44, and the average PHQ-9
score was 2.70 ± 3.60. The ratio of overweight subjects was 26.3%, and of obese subjects was
4.3%. The total number of cases with PHQ-9 scores >10 was 5.7%, with 3.9% men and 7.0%
women, thus women had a higher rate of depression (P < .001). Other variables, excluding
residential area, comorbidities, and cancer, showed significant differences between men and
Document Page
THE RELATIONSHIP BETWEEN DEPRESSION AND OBESITY 6
women. Table 2 show the baseline socio-demographic characteristics of men and women
according to BMI groups. The normal weight group had a higher ratio of greater household
income, and the overweight and obese groups had higher ratios of mid-level household income.
The ratio of alcohol drinkers was higher in the overweight group. Women BMI groups showed
significant differences in all of the factors, excluding cancer diagnosis, alcohol drinking habit,
and exercise status. The underweight and normal weight groups had higher education and
income levels, and a greater incidence of living in urban areas. The underweight group had
significantly higher rates of being single and current smokers, and had higher stress levels.
PHQ-9 depression prevalence was highest in the underweight group in both men (18.6%) and
women (15.5%)
A descriptive statistical analysis of demographic variables such as cohort, state, age, gender
living arrangement, faculty, degree type, metro, study mode and fee status for students at the
time of enrolment is carried out consisting of sample size (n), mean and % value in the above
figure.
An independent T test is performed to analyze the difference in mean between the demographic
variables such as gender, metro, study mode and RTA with respect to aggression, thrill seeking
and risk acceptance.
Demographic
Variables
Gender Metro
Sig. (2-tailed) Sig. (2-tailed)
Aggression .934 .475
Thrill Seeking .711 .493
Risk .116 .386
Document Page
THE RELATIONSHIP BETWEEN DEPRESSION AND OBESITY 7
Acceptance
Demographic
Variables
Study Mode RTA
Sig. (2-tailed) Sig. (2-tailed)
Aggression .757 .000
Thrill Seeking .895 .000
Risk
Acceptance
.023 .000
Descriptive Statistics
N Range Minimum Maximum Mean Std. Deviation Variance
age 2000 51.00 19.00 70.00 31.3209 12.22939 149.558
BodyMassIndex(BMI) 2000 5.50 3.50 9.00 6.8014 1.13801 1.295
2000 7.38 1.25 8.63 5.4806 1.37894 1.901
Valid N (listwise) 2000
Discussion
We investigated the relationship between obesity and depression in ACU student population by
the longitudinal study. Only underweight group had a significantly higher risk of depression than
normal weight group in both men and women. Our results showed that the underweight group
tabler-icon-diamond-filled.svg

Paraphrase This Document

Need a fresh take? Get an instant paraphrase of this document with our AI Paraphraser
Document Page
THE RELATIONSHIP BETWEEN DEPRESSION AND OBESITY 8
(BMI <18.5) had the greatest risk of depression, followed by the obese group (BMI >30), the
normal weight group (BMI 18.5–25), and the overweight group (BMI 25–30), consecutively.
This is similar to the trend shown in the study by Noh et al 2014 that showed a U-shaped
distribution. The underweight group (BMI <18.5) had the highest incidence of depression, with
the highest Center for Epidemiologic Studies Depression Scale (CES-D) scores, followed by the
severely obese group (BMI >30), normal weight group (BMI 18.5–23), and obese group (BMI
25–30), consecutively. The overweight group (BMI 23–25) had the lowest incidence
of depression, with the lowest CES-D scores. Both women and men in the underweight group
had high incidences of depression.
Study limitations
First, the study used a longitudinal design, which hindered the accurate examination of the causal
relationship between obesity and depression risk. Second, this study assessed the severity
of depression symptoms at the time of BMI measurement. Hence, we did not consider cases
characterized as “incidences of depression” or “diagnosis of depression by a physician,” and only
used the PHQ-9 score, a scale used to assess depression that reflects the respondent's state of
mind for the past 2 weeks. Third, this study may contain a residual confounding effect due to
variables not considered in relation to obesity and depression. Finally, we used PHQ-9 scores to
assess degrees of depression. In the future, plan to design longitudinal cohort studies considering
the bidirectional mutual relationship between obesity and depression should be considered.
Conclusion
In conclusion, being underweight can increase the risk of developing depression,
and obesity may also be a risk factor.
Document Page
THE RELATIONSHIP BETWEEN DEPRESSION AND OBESITY 9
References
Blaine, B. (2018). Does depression cause obesity? A meta-analysis of longitudinal studies of
depression and weight control. Journal of health psychology, 13(8), 1190-1197.
Calman, N. (2015). Making health equality a reality: the Bronx takes action. Health Affairs,
24(2), 491-498.
Roca, M., Kohls, E., Gili, M., Watkins, E., Owens, M., Hegerl, U. ... & Visser, M. (2016).
Prevention of depression through nutritional strategies in high-risk persons: rationale and
design of the MooDFOOD prevention trial. BMC psychiatry, 16(1), 192.
Widen, E. M., Whyatt, R. M., Hoepner, L. A., Mueller, N. T., RamirezCarvey, J., Oberfield, S.
E., ... & Rundle, A. G. (2016). Gestational weight gain and obesity, adiposity and body
size in A frican–A merican and D ominican children in the B ronx and N orthern M
anhattan. Maternal & child nutrition, 12(4), 918-928.
Zukiewicz-Sobczak, W., Wróblewska, P., Zwolinski, J., Chmielewska-Badora, J., Adamczuk, P.,
Krasowska, E., ... & Silny, W. (2014). Obesity and poverty paradox in developed
countries. Annals of Agricultural and Environmental Medicine, 21(3).
Document Page
THE RELATIONSHIP BETWEEN DEPRESSION AND OBESITY 10
chevron_up_icon
1 out of 10
circle_padding
hide_on_mobile
zoom_out_icon
[object Object]