Epidemiology Assignment: HIV, Diabetes, and Breast Cancer Data

Verified

Added on  2022/08/27

|8
|1494
|24
Homework Assignment
AI Summary
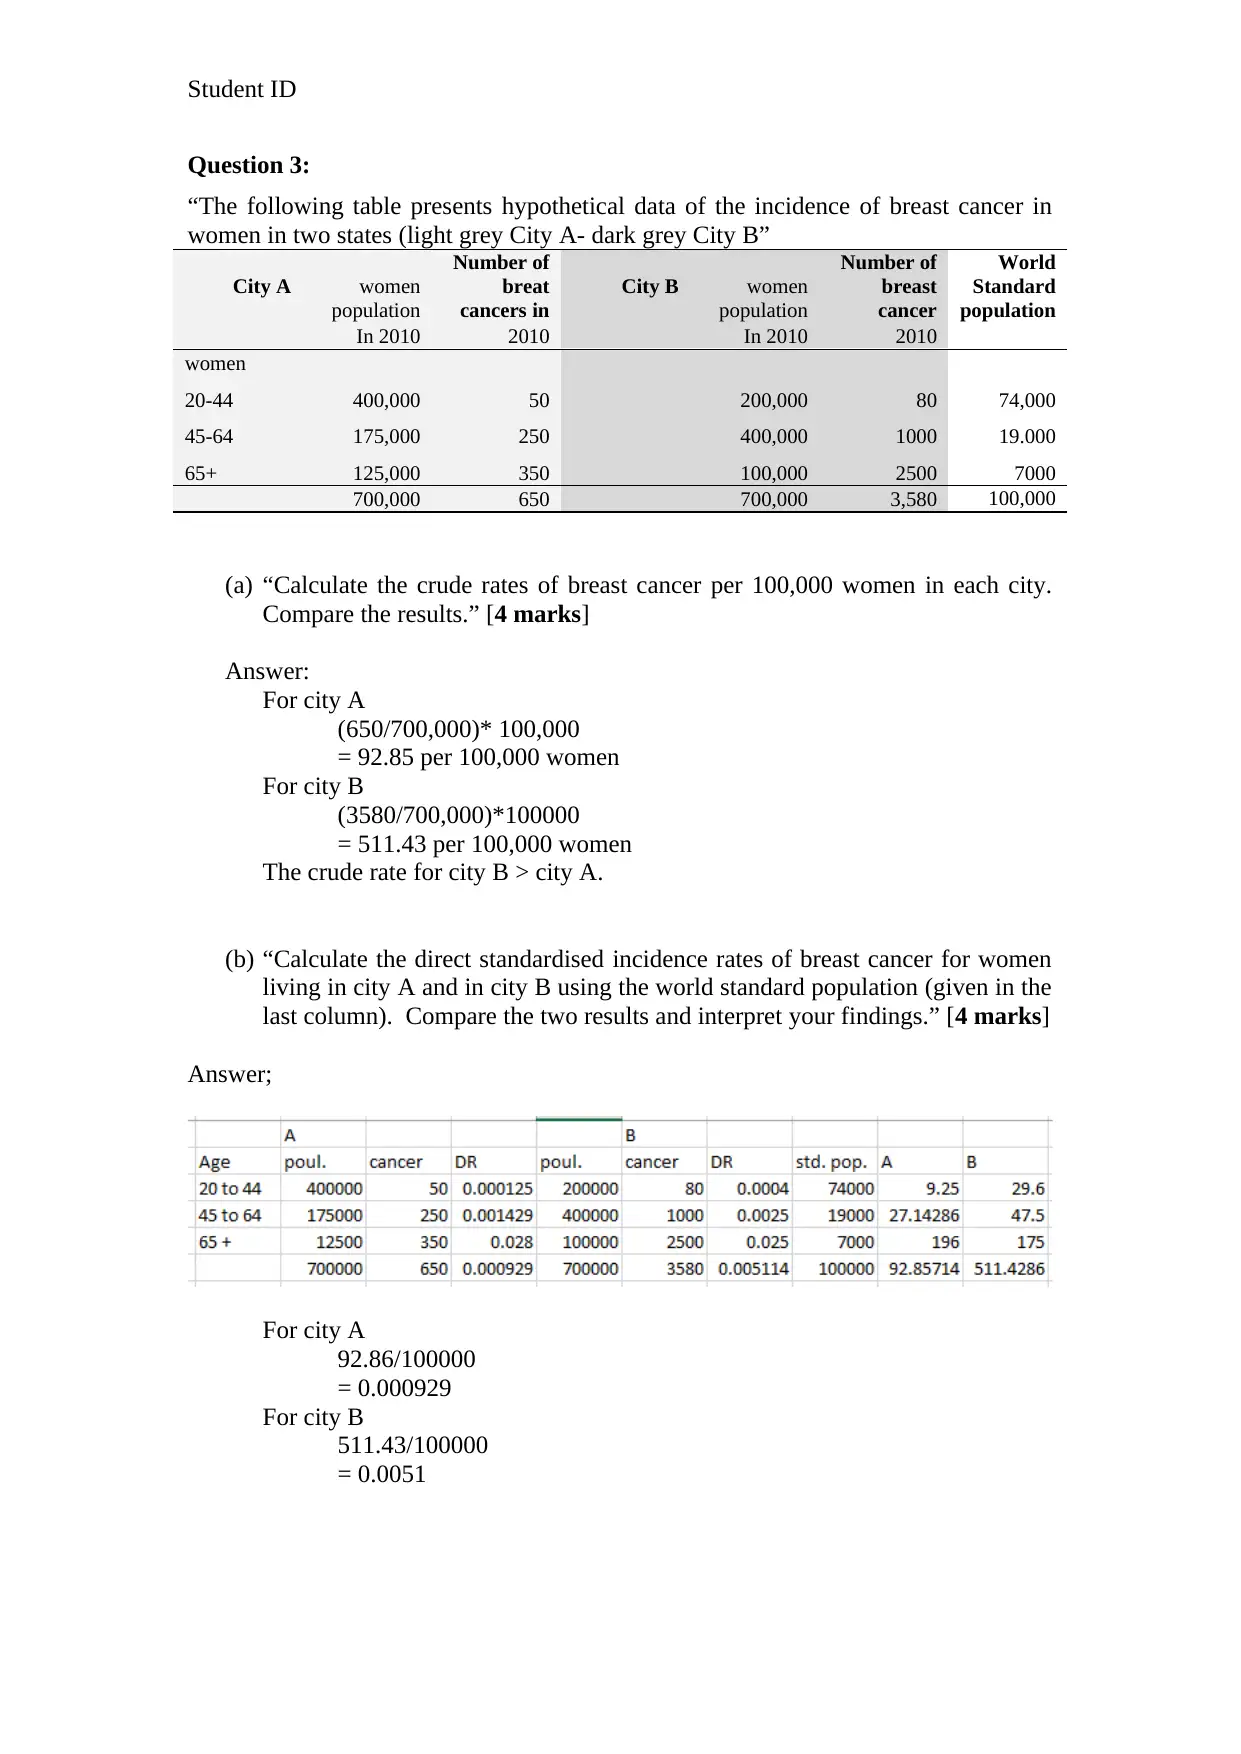
This assignment presents a series of numerical problems and scenario-based calculations centered on public health data analysis. It begins with a case study on HIV, requiring the calculation of prevalence, cumulative incidence, person-years at risk, and incidence rate. The assignment then moves on to analyze data from HealthStats NSW, focusing on diabetes-related mortality rates and case fatality rates. Further, the assignment involves the analysis of breast cancer incidence in two cities, including the calculation of crude rates and direct standardized incidence rates. It also assesses the role of age structure in explaining differences in breast cancer rates. Finally, the assignment concludes with questions on epidemiological study design, asking for the proposal and justification of a study design to investigate the association between delaying the age of first child and breast cancer incidence, along with a discussion of data collection and alternative study designs.
Document Page
Student ID
Numerical problem solving – scenario- based calculations
Due date: 28/03/2020
Length: 300 words
Mode: short answer
Reading from the text book that attached:
Chapter 1- all pages.
Chapter 2- up to page 71.
Chapter 3- all pages.
Chapter 4- page 104-133.
tabler-icon-diamond-filled.svg

Secure Best Marks with AI Grader

Need help grading? Try our AI Grader for instant feedback on your assignments.
Document Page
Student ID
Question 1:
In 2012, a group of 4,233 men and women aged 20 years were recruited from the
general population and assessed for HIV virus. 288 participants were found to have
HIV when tested at baseline. Participants who did not test positive for HIV in 2012
were followed-up and assessed again after 4 years of follow-up (only those who
previously had tested negative for HIV were tested again at follow-up). A further 99
cases of HIV were identified during this 4 year period, either diagnosed during the
interim or diagnosed during the study assessment. (It is assumed that once participants
contract HIV they remain HIV positive without recovery
(a) What was the prevalence of HIV among study participants in 2012? [2 Marks]
Answer: Prevalence of HIV = Number of people with HIV at 2012/ Total number of
people
=288/4233
=0.068.
= 6.8%
(b) What was the prevalence of HIV among study participants after 4 years of follow-
up? Assume no loss to follow-up. [2 marks]
Answer: 1- positive prevalence of HIV that is (1-0.068) = 0.93
= 93%
(c) What was the cumulative incidence of HIV among study participants over the
study period? [4 marks]
Answer: Cumulative incidence= Number of people who develop HIV during the
study period/ Number of people risk of getting the disease at the start of the period
= 99/ 288
= 3.53
(d) Calculate the total number of person-years at risk during the 4 year period.
(Assume that HIV was acquired randomly during the 4 year period. That is, those who
acquired HIV were at risk for half the time of those who did not acquire HIV. [4
marks]
Answer: 288+0.5*99= 337.5 person-years
(e) What was the incident rate (incidence density) of HIV among participants for the 4
years. [4 marks]
Document Page
Student ID
Answer: 4 cases / 337.5 persons –year
= 0.012 cases / persons –per year.
(f) Assuming that the incidence rate of HIV remains constant, what should happen to
the prevalence of HIV in this cohort over time?[2 mark]
Answer: If incidence rate is constant then the prevalence is either increase or
decrease. It depends upon duration of disease. If the duration is fixed. Then in this
case prevalence is also fixed.
Question 2:
Data from HealthStats NSW (2015) are provided below. Use these data to answer
the following questions”.
Number of people with type 2 diabetes 756,507
Deaths from type 2 diabetes related causes 5,025
Death from all causes in NSW 49,607
Total population of NSW 9,006,043
a) Calculate all-cause mortality rate? [2 Marks]
Answer: (49607 / 9006043)* 1000
= 5.51 per thousand
(b) Calculate diabetes-specific mortality rate [2 Marks]
Answer :(5025/ 756507)*1000
= 6.64 per thoudsand
(c) Calculate diabetes case fatality rate ? [2 Marks]
Answer: (5025/ 756507)*100
= 0.66 percent
Document Page
Student ID
Question 3:
“The following table presents hypothetical data of the incidence of breast cancer in
women in two states (light grey City A- dark grey City B”
City A women
population
Number of
breat
cancers in
City B women
population
Number of
breast
cancer
World
Standard
population
In 2010 2010 In 2010 2010
women
20-44 400,000 50 200,000 80 74,000
45-64 175,000 250 400,000 1000 19.000
65+ 125,000 350 100,000 2500 7000
700,000 650 700,000 3,580 100,000
(a) “Calculate the crude rates of breast cancer per 100,000 women in each city.
Compare the results.” [4 marks]
Answer:
For city A
(650/700,000)* 100,000
= 92.85 per 100,000 women
For city B
(3580/700,000)*100000
= 511.43 per 100,000 women
The crude rate for city B > city A.
(b) “Calculate the direct standardised incidence rates of breast cancer for women
living in city A and in city B using the world standard population (given in the
last column). Compare the two results and interpret your findings.” [4 marks]
Answer;
For city A
92.86/100000
= 0.000929
For city B
511.43/100000
= 0.0051
tabler-icon-diamond-filled.svg

Secure Best Marks with AI Grader

Need help grading? Try our AI Grader for instant feedback on your assignments.
Document Page
Student ID
(c) “Based on the data you have just calculated would you say that age structure can
explain the differences between the two cities in crude breast cancer? Justify”
[4marks]
Answer: Yes the age structure differentiate between city A and B. Each age structure
shows different rate among A and B.
Document Page
Student ID
Question 4:
(a) What is the study type that generated this figure? [2 marks]
Answer: It is a cohort study. Which shows the relationship between pro state cancer
mortality versus per capita sugar consumption with the help of scatter plot.
(b) What are the key features that led you to this choice [2 marks]
Answer: The key feature is scatter plot with trend line. Which shows the relation is
strong or not between the pro state cancer mortality versus per capita sugar
consumption.
(c) What is the main message from this graph, in your own words? [2 Marks] no
more than 60 words
Answer: In this figure in the X-axis shows the per capita sugar consumption and the
Y-axis represent the age adjusted prostate cancer. It has been seen that at the
beginning the data points are close to the diagonal line that is at this stage the
correlation is strong. At the age 25 or more the per capita consumption is high. But
their relationship is not strong at that point.
Source: Colli et al. Urologic Oncology 2005
Document Page
Student ID
Question 5:
“Investigators wishes to examine if delaying the age of having first child is
associated with higher incidence of breast cancer in young women 18-40 years
old.”
a) Propose an epidemiological study design to explore this question and justify
why you chose this design? [4 Marks]
Answer: The study design is epidemiological case control study design. In this case
the female of age 18-40 is the population. There are two variable has been taken.
These are facing breast cancer or not and the other is age of the women. The study
may conduct fertility rate, birth rate and disease specific fatality rate. It is cohort
study. Because the patients are classify in two groups. The study shows the
association between risk factor and outcome. The exposure is the factor which affect
the risk of disease. This is the reason to choose this design.
b) Assuming you are one of the investigators – please provide a short description
about the participants in the study, what data you will need to collect to
answer your research question and at which time point you collect this data
[4 Marks] No more than 150 words
Answer: In this study the observation has been taken from women with 18 to 40. The
study has been divided in to two parts. One part describe about breast cancer and the
other part age of women at the time of dealing the first child. Moreover the breast
cancer variable is also again two parts one is having the breast cancer when dealing
their first child and the other is not. To analyze this study the data or observations has
been collected with the help of data collection technique, like questionnaire method
and so on. The time of data collection is women with age 18 to 40 and which women
bear a child.
c) What other study design you can consider for this research question and
explain why you chose it [4 Marks]
Answer: The other study design is experimental study, cohort study and so on. It is an
experiment on this age group or disease. The reason to say as a cohort is that this can
be divided in to age and disease by two factor. Moreover it is given during a specific
period of time. This is define development of disease and expose or not.
tabler-icon-diamond-filled.svg

Paraphrase This Document

Need a fresh take? Get an instant paraphrase of this document with our AI Paraphraser
Document Page
Student ID
chevron_up_icon
1 out of 8
circle_padding
hide_on_mobile
zoom_out_icon
[object Object]