Public Health Data Analysis: Stroke Readmission and Fish Consumption

Verified

Added on  2020/04/01

|6
|1611
|51
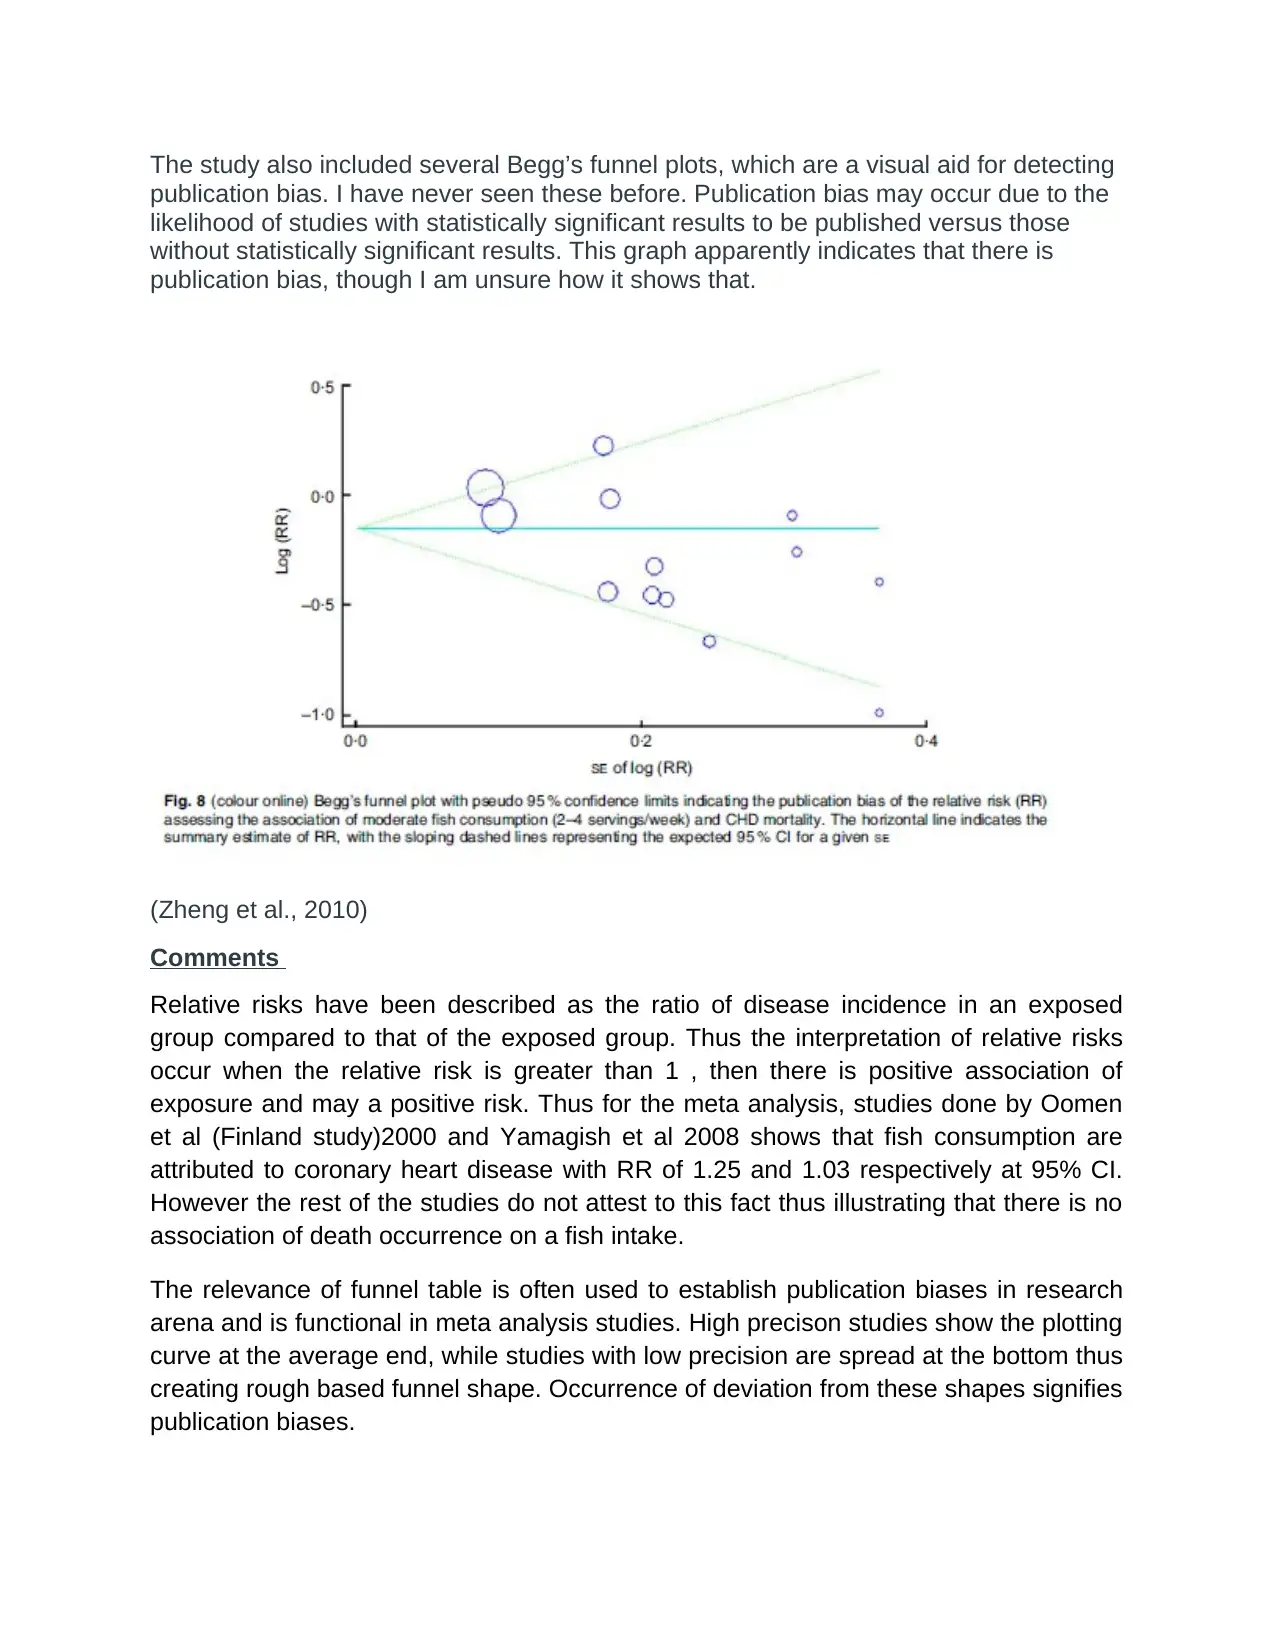
Discussion Board Post
AI Summary
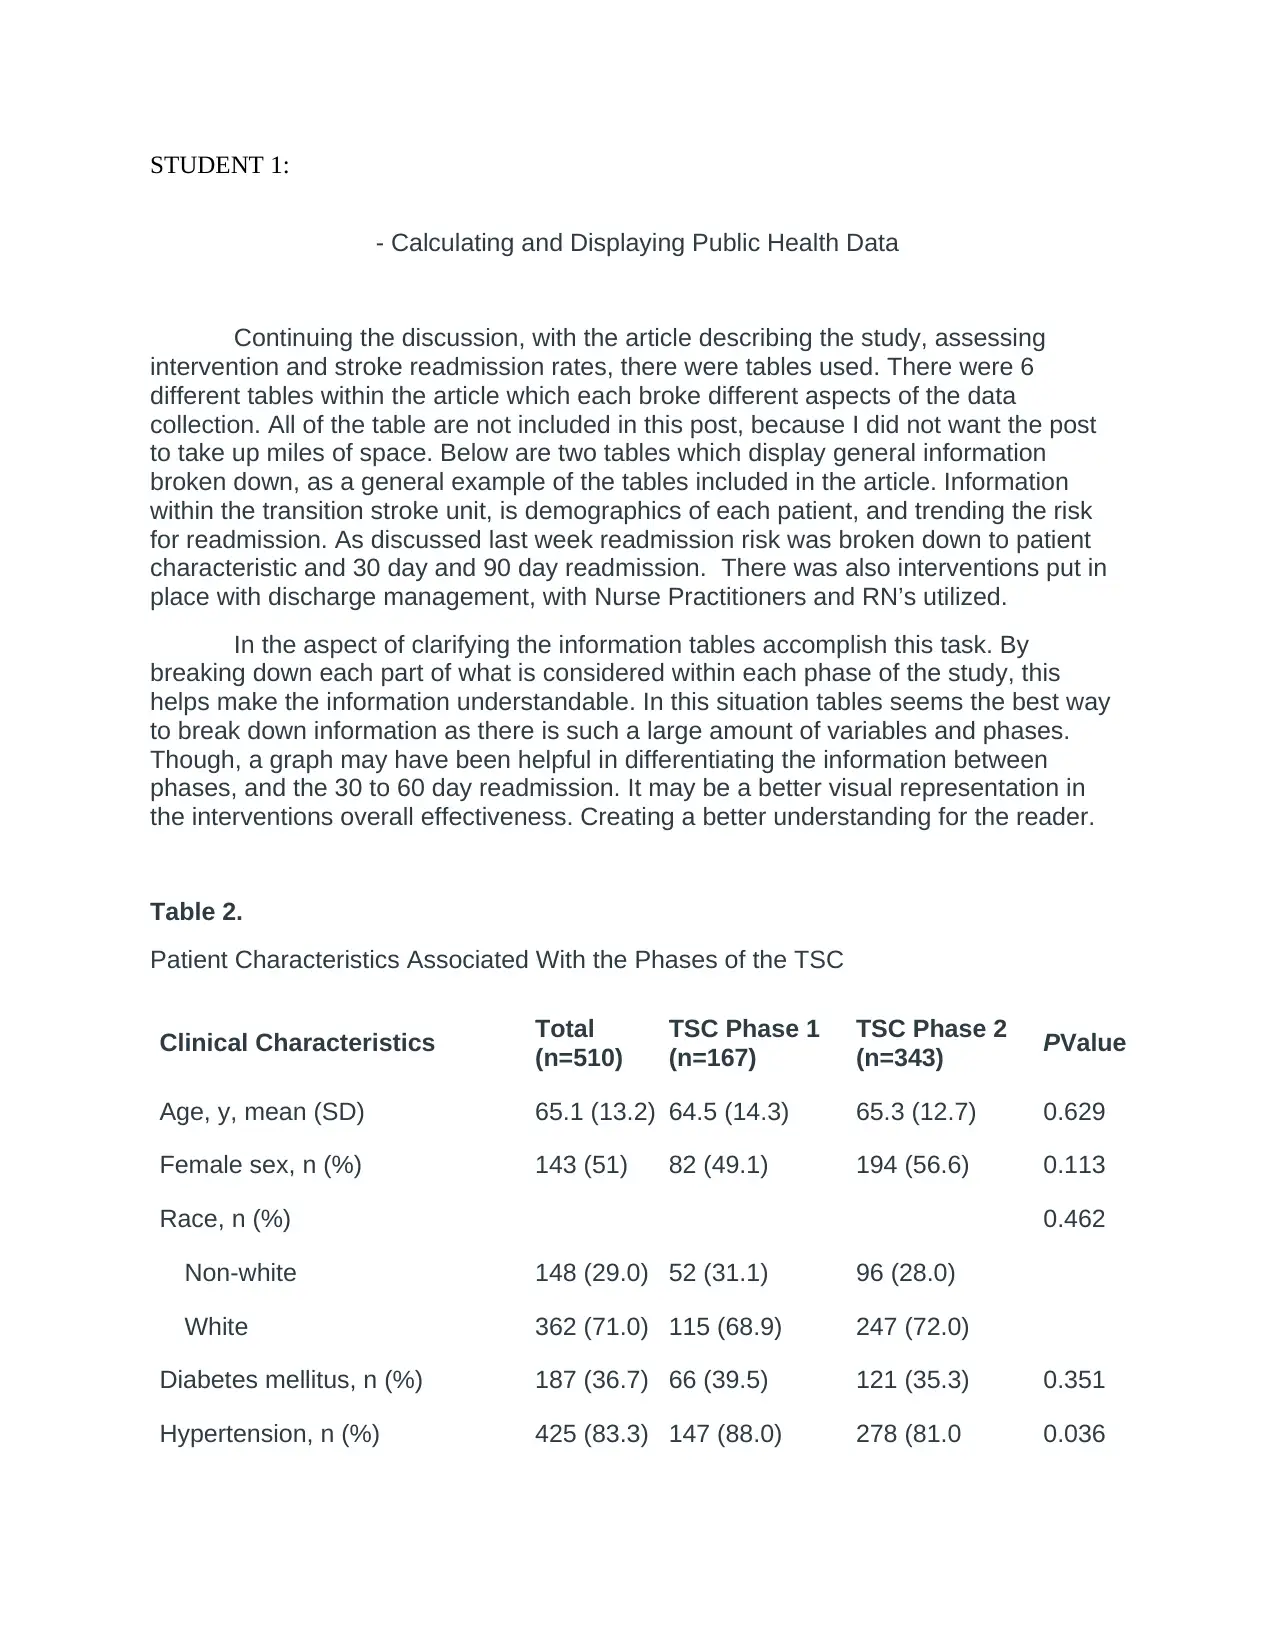
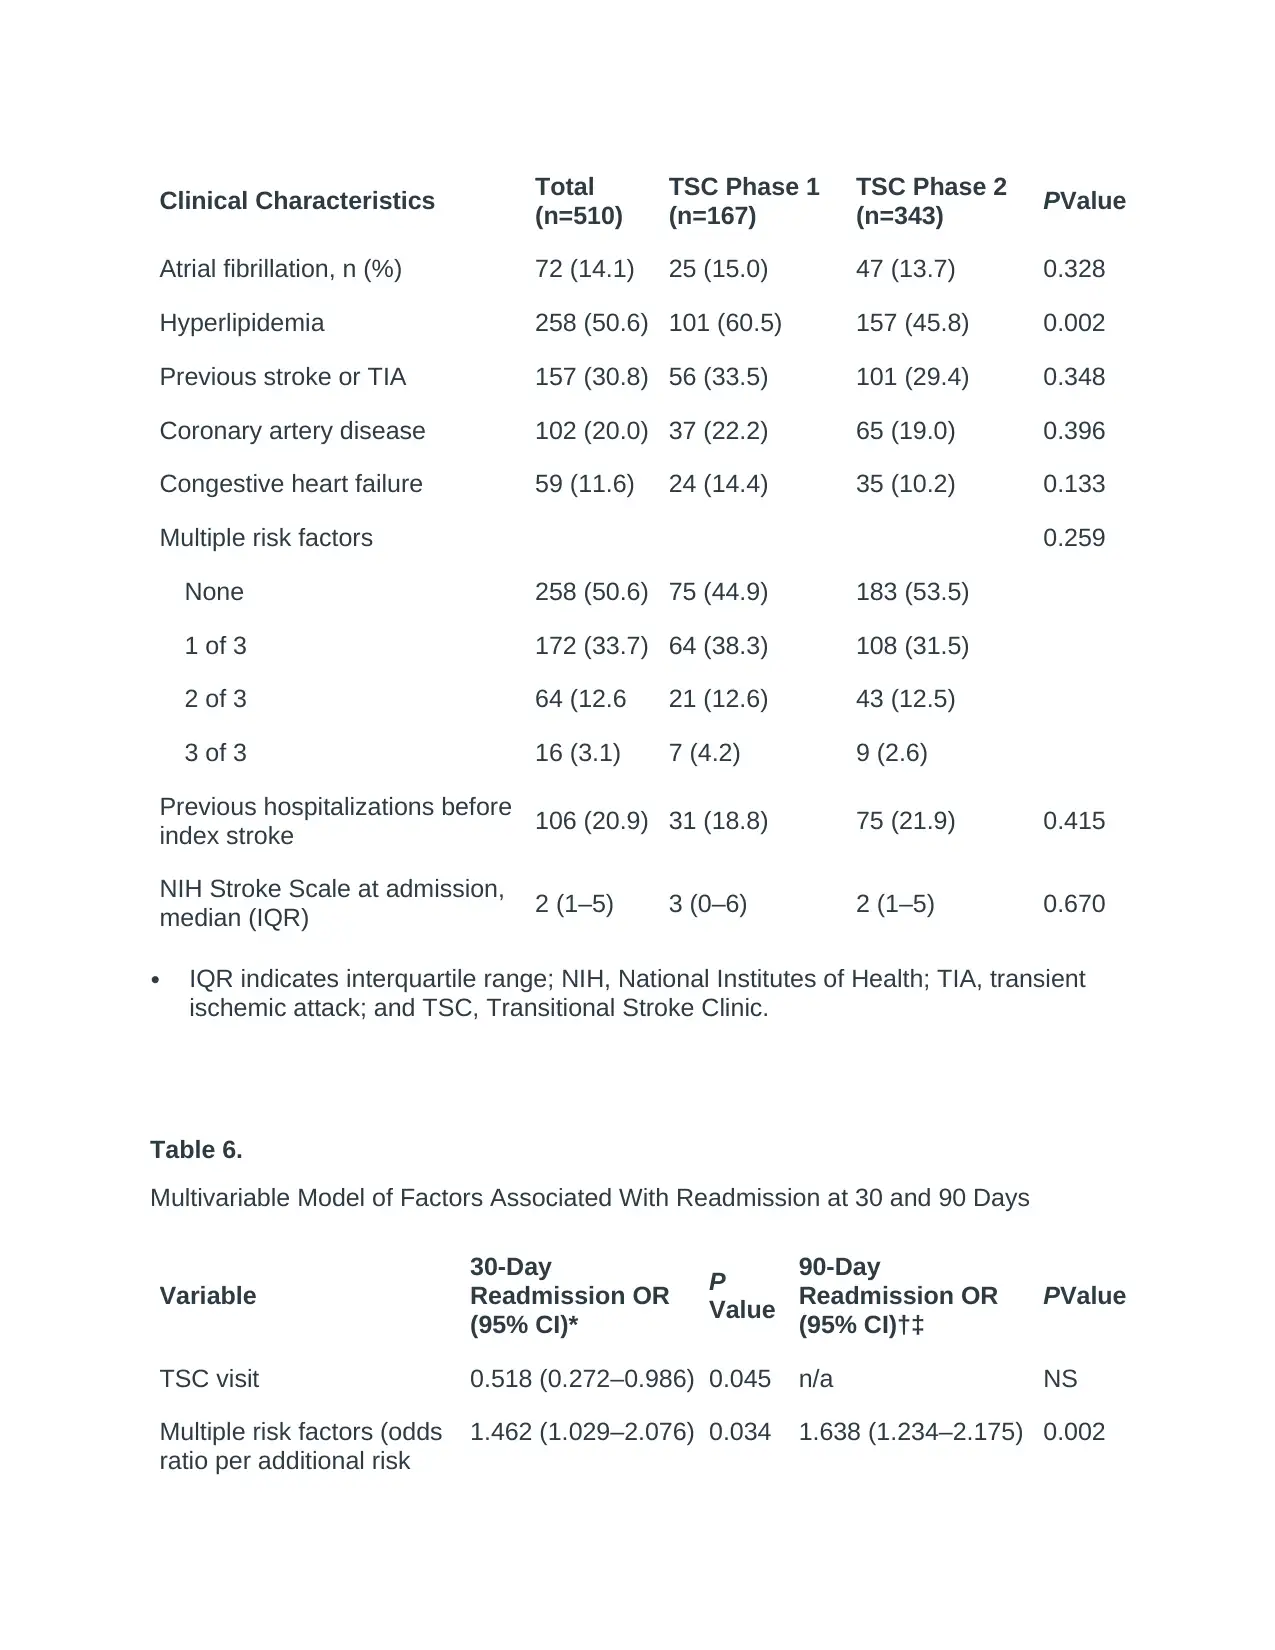
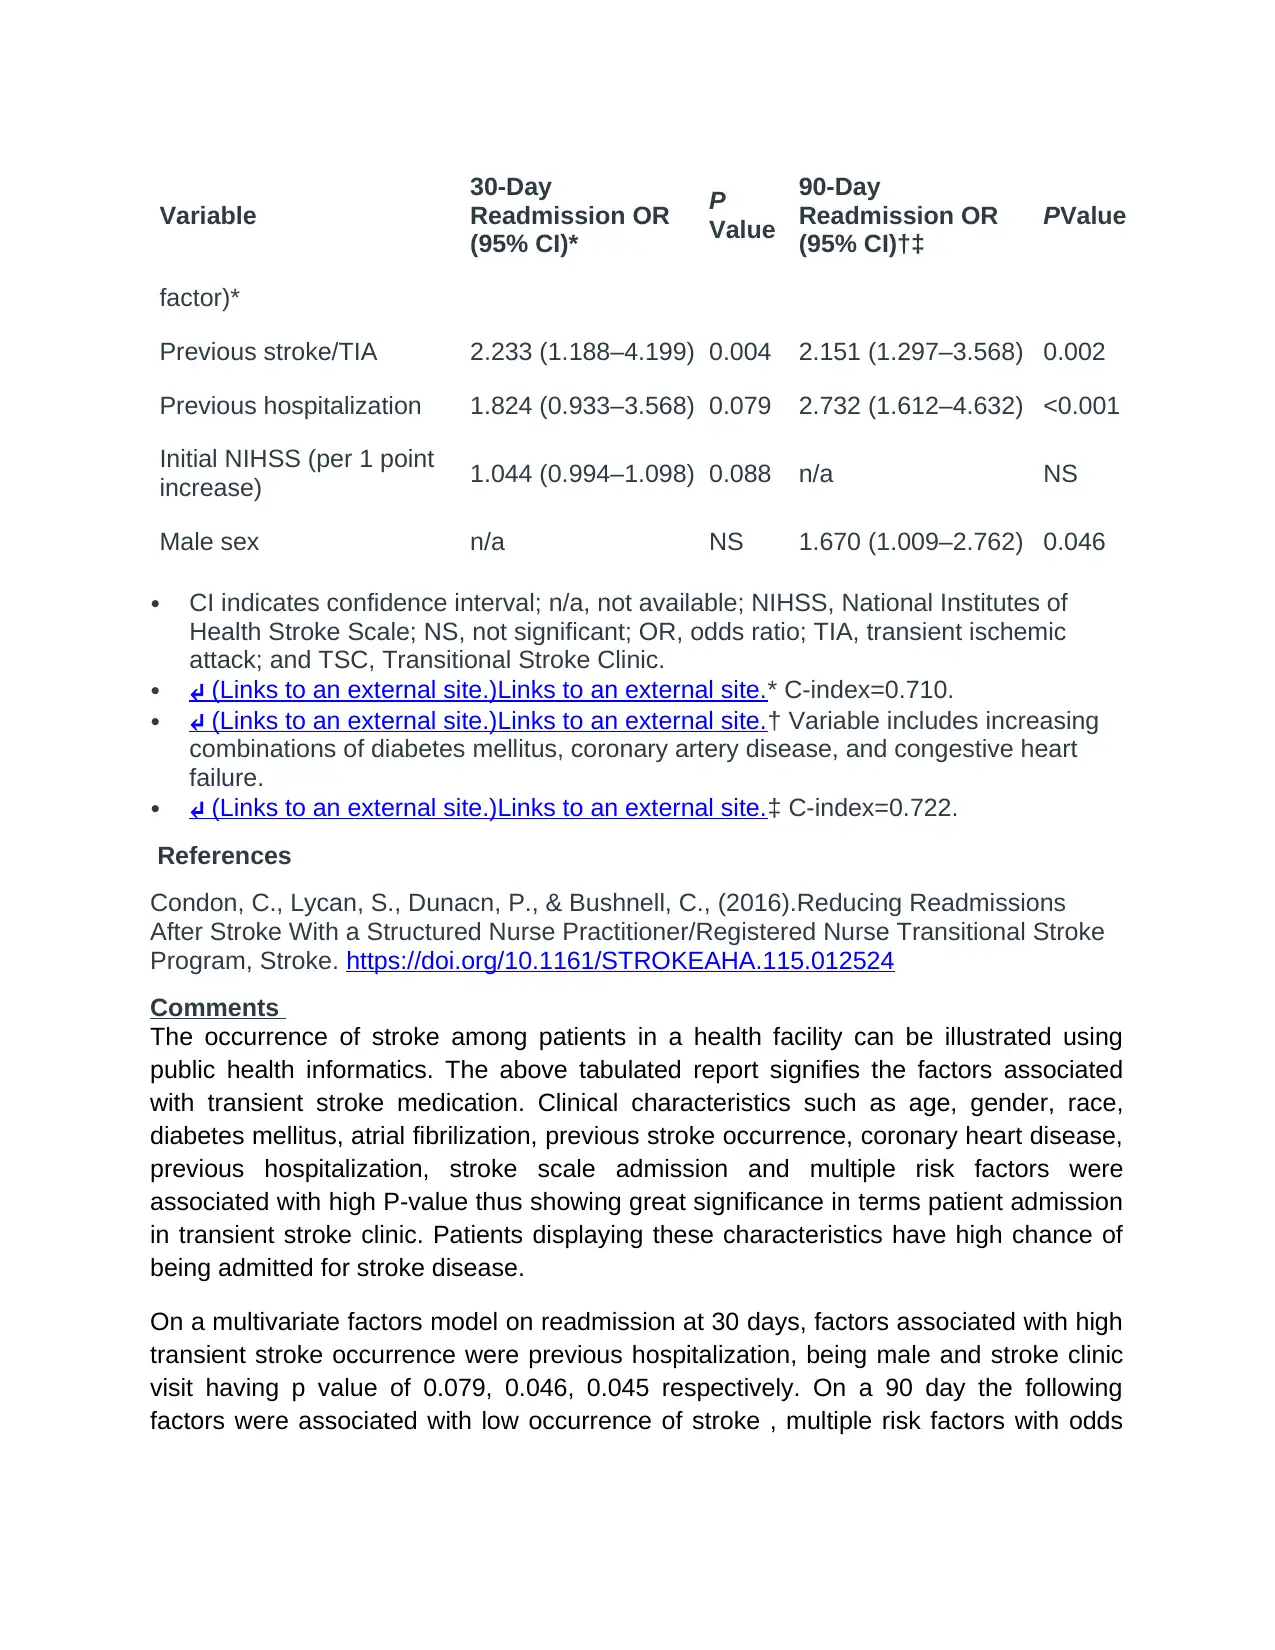
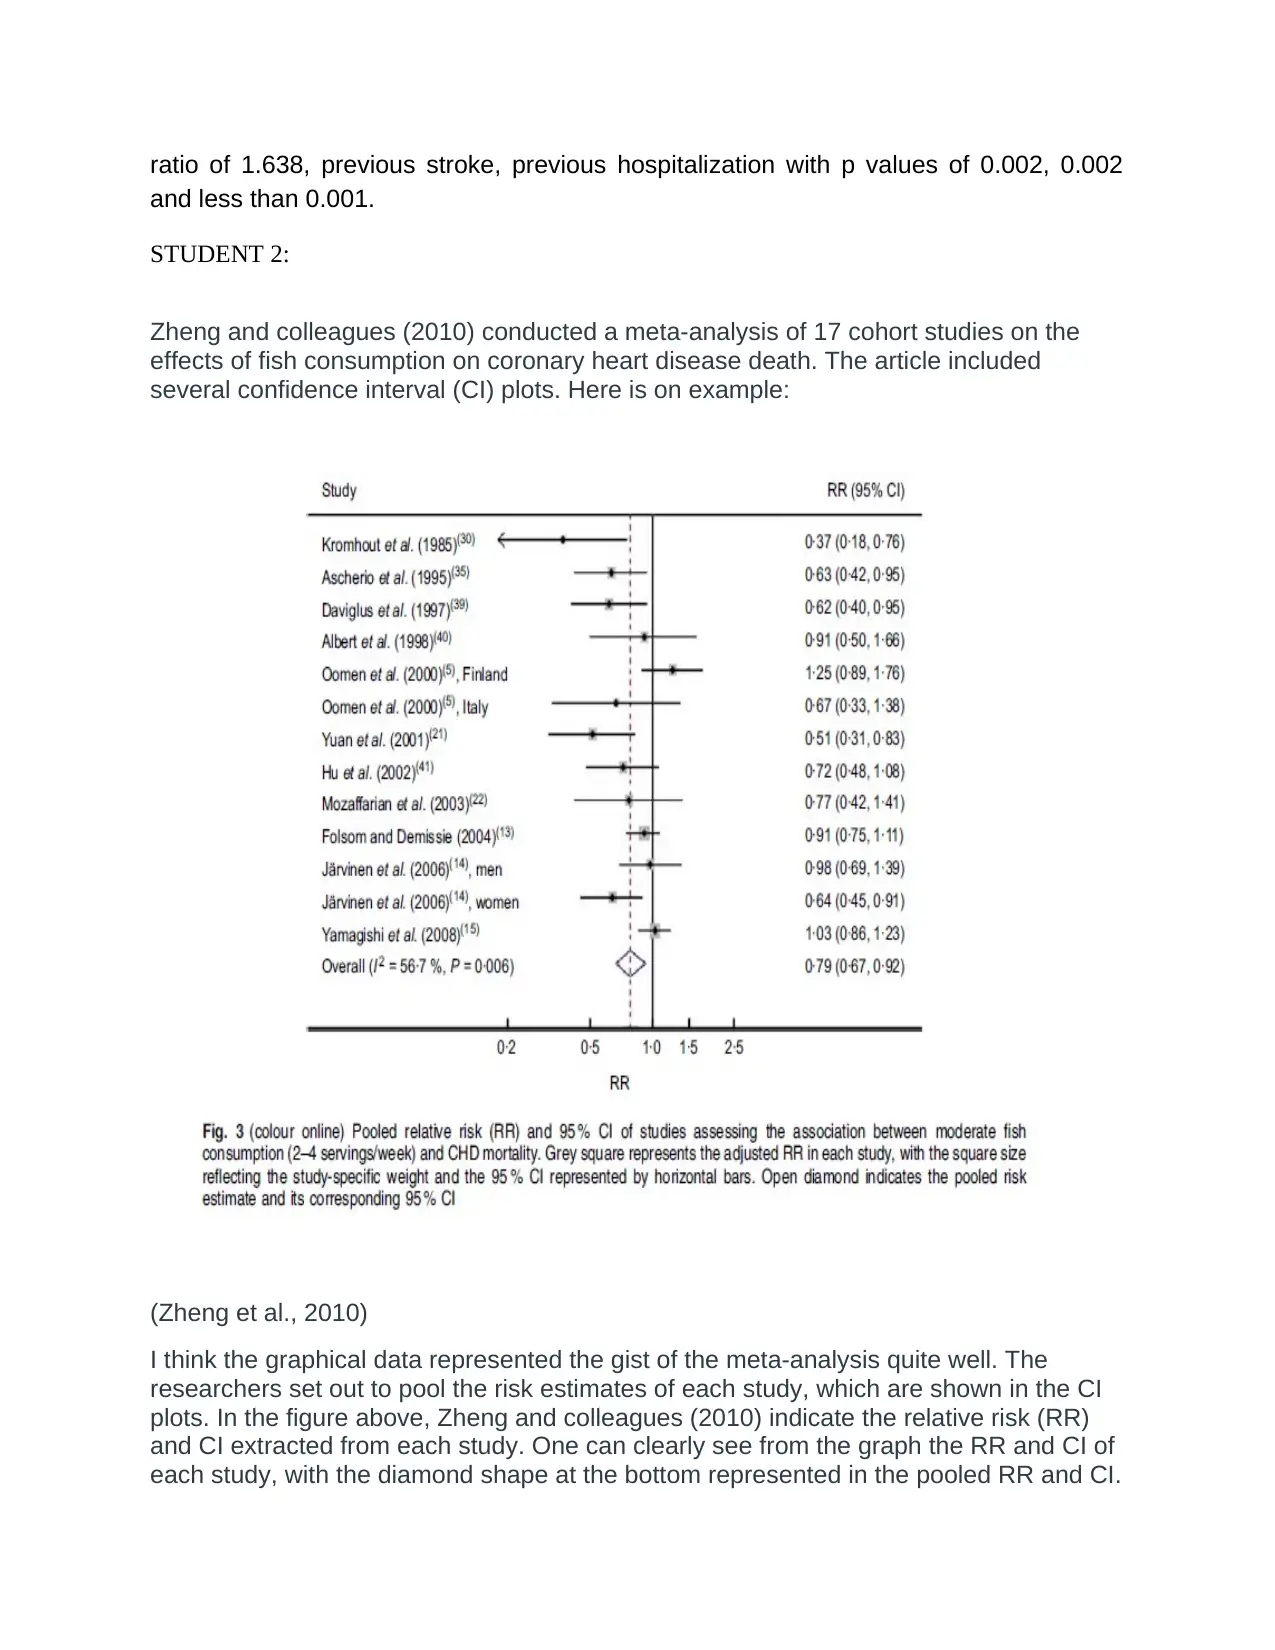
This discussion post presents an analysis of public health data, focusing on two distinct studies. The first study, concerning stroke readmission rates, utilizes tables to display patient characteristics and factors associated with readmission within a transitional stroke clinic. The analysis highlights the significance of various clinical characteristics and the impact of interventions on readmission rates, with a suggestion for the use of graphs for better visual representation. The second study involves a meta-analysis of fish consumption and coronary heart disease mortality, including the use of confidence interval plots and Begg's funnel plots. The analysis discusses the interpretation of relative risks and the identification of publication bias within the included studies. Both analyses provide insights into the use of data visualization and statistical methods in public health research.
Document Page
STUDENT 1:
- Calculating and Displaying Public Health Data
Continuing the discussion, with the article describing the study, assessing
intervention and stroke readmission rates, there were tables used. There were 6
different tables within the article which each broke different aspects of the data
collection. All of the table are not included in this post, because I did not want the post
to take up miles of space. Below are two tables which display general information
broken down, as a general example of the tables included in the article. Information
within the transition stroke unit, is demographics of each patient, and trending the risk
for readmission. As discussed last week readmission risk was broken down to patient
characteristic and 30 day and 90 day readmission. There was also interventions put in
place with discharge management, with Nurse Practitioners and RN’s utilized.
In the aspect of clarifying the information tables accomplish this task. By
breaking down each part of what is considered within each phase of the study, this
helps make the information understandable. In this situation tables seems the best way
to break down information as there is such a large amount of variables and phases.
Though, a graph may have been helpful in differentiating the information between
phases, and the 30 to 60 day readmission. It may be a better visual representation in
the interventions overall effectiveness. Creating a better understanding for the reader.
Table 2.
Patient Characteristics Associated With the Phases of the TSC
Clinical Characteristics Total
(n=510)
TSC Phase 1
(n=167)
TSC Phase 2
(n=343) PValue
Age, y, mean (SD) 65.1 (13.2) 64.5 (14.3) 65.3 (12.7) 0.629
Female sex, n (%) 143 (51) 82 (49.1) 194 (56.6) 0.113
Race, n (%) 0.462
Non-white 148 (29.0) 52 (31.1) 96 (28.0)
White 362 (71.0) 115 (68.9) 247 (72.0)
Diabetes mellitus, n (%) 187 (36.7) 66 (39.5) 121 (35.3) 0.351
Hypertension, n (%) 425 (83.3) 147 (88.0) 278 (81.0 0.036
tabler-icon-diamond-filled.svg

Paraphrase This Document

Need a fresh take? Get an instant paraphrase of this document with our AI Paraphraser
Document Page
Clinical Characteristics Total
(n=510)
TSC Phase 1
(n=167)
TSC Phase 2
(n=343) PValue
Atrial fibrillation, n (%) 72 (14.1) 25 (15.0) 47 (13.7) 0.328
Hyperlipidemia 258 (50.6) 101 (60.5) 157 (45.8) 0.002
Previous stroke or TIA 157 (30.8) 56 (33.5) 101 (29.4) 0.348
Coronary artery disease 102 (20.0) 37 (22.2) 65 (19.0) 0.396
Congestive heart failure 59 (11.6) 24 (14.4) 35 (10.2) 0.133
Multiple risk factors 0.259
None 258 (50.6) 75 (44.9) 183 (53.5)
1 of 3 172 (33.7) 64 (38.3) 108 (31.5)
2 of 3 64 (12.6 21 (12.6) 43 (12.5)
3 of 3 16 (3.1) 7 (4.2) 9 (2.6)
Previous hospitalizations before
index stroke 106 (20.9) 31 (18.8) 75 (21.9) 0.415
NIH Stroke Scale at admission,
median (IQR) 2 (1–5) 3 (0–6) 2 (1–5) 0.670
IQR indicates interquartile range; NIH, National Institutes of Health; TIA, transient
ischemic attack; and TSC, Transitional Stroke Clinic.
Table 6.
Multivariable Model of Factors Associated With Readmission at 30 and 90 Days
Variable
30-Day
Readmission OR
(95% CI)*
P
Value
90-Day
Readmission OR
(95% CI)†‡
PValue
TSC visit 0.518 (0.272–0.986) 0.045 n/a NS
Multiple risk factors (odds
ratio per additional risk
1.462 (1.029–2.076) 0.034 1.638 (1.234–2.175) 0.002
Document Page
Variable
30-Day
Readmission OR
(95% CI)*
P
Value
90-Day
Readmission OR
(95% CI)†‡
PValue
factor)*
Previous stroke/TIA 2.233 (1.188–4.199) 0.004 2.151 (1.297–3.568) 0.002
Previous hospitalization 1.824 (0.933–3.568) 0.079 2.732 (1.612–4.632) <0.001
Initial NIHSS (per 1 point
increase) 1.044 (0.994–1.098) 0.088 n/a NS
Male sex n/a NS 1.670 (1.009–2.762) 0.046
CI indicates confidence interval; n/a, not available; NIHSS, National Institutes of
Health Stroke Scale; NS, not significant; OR, odds ratio; TIA, transient ischemic
attack; and TSC, Transitional Stroke Clinic.
(Links to an external site.)Links to an external site.* C-index=0.710.
(Links to an external site.)Links to an external site. Variable includes increasing
combinations of diabetes mellitus, coronary artery disease, and congestive heart
failure.
(Links to an external site.)Links to an external site. C-index=0.722.
References
Condon, C., Lycan, S., Dunacn, P., & Bushnell, C., (2016).Reducing Readmissions
After Stroke With a Structured Nurse Practitioner/Registered Nurse Transitional Stroke
Program, Stroke. https://doi.org/10.1161/STROKEAHA.115.012524
Comments
The occurrence of stroke among patients in a health facility can be illustrated using
public health informatics. The above tabulated report signifies the factors associated
with transient stroke medication. Clinical characteristics such as age, gender, race,
diabetes mellitus, atrial fibrilization, previous stroke occurrence, coronary heart disease,
previous hospitalization, stroke scale admission and multiple risk factors were
associated with high P-value thus showing great significance in terms patient admission
in transient stroke clinic. Patients displaying these characteristics have high chance of
being admitted for stroke disease.
On a multivariate factors model on readmission at 30 days, factors associated with high
transient stroke occurrence were previous hospitalization, being male and stroke clinic
visit having p value of 0.079, 0.046, 0.045 respectively. On a 90 day the following
factors were associated with low occurrence of stroke , multiple risk factors with odds
Document Page
ratio of 1.638, previous stroke, previous hospitalization with p values of 0.002, 0.002
and less than 0.001.
STUDENT 2:
Zheng and colleagues (2010) conducted a meta-analysis of 17 cohort studies on the
effects of fish consumption on coronary heart disease death. The article included
several confidence interval (CI) plots. Here is on example:
(Zheng et al., 2010)
I think the graphical data represented the gist of the meta-analysis quite well. The
researchers set out to pool the risk estimates of each study, which are shown in the CI
plots. In the figure above, Zheng and colleagues (2010) indicate the relative risk (RR)
and CI extracted from each study. One can clearly see from the graph the RR and CI of
each study, with the diamond shape at the bottom represented in the pooled RR and CI.
tabler-icon-diamond-filled.svg

Paraphrase This Document

Need a fresh take? Get an instant paraphrase of this document with our AI Paraphraser
Document Page
The study also included several Begg’s funnel plots, which are a visual aid for detecting
publication bias. I have never seen these before. Publication bias may occur due to the
likelihood of studies with statistically significant results to be published versus those
without statistically significant results. This graph apparently indicates that there is
publication bias, though I am unsure how it shows that.
(Zheng et al., 2010)
Comments
Relative risks have been described as the ratio of disease incidence in an exposed
group compared to that of the exposed group. Thus the interpretation of relative risks
occur when the relative risk is greater than 1 , then there is positive association of
exposure and may a positive risk. Thus for the meta analysis, studies done by Oomen
et al (Finland study)2000 and Yamagish et al 2008 shows that fish consumption are
attributed to coronary heart disease with RR of 1.25 and 1.03 respectively at 95% CI.
However the rest of the studies do not attest to this fact thus illustrating that there is no
association of death occurrence on a fish intake.
The relevance of funnel table is often used to establish publication biases in research
arena and is functional in meta analysis studies. High precison studies show the plotting
curve at the average end, while studies with low precision are spread at the bottom thus
creating rough based funnel shape. Occurrence of deviation from these shapes signifies
publication biases.
Document Page
From the meta analysis study done, it is evident that 3 studies are deviating from the
normal funnel curve shape while one is at the age closer to being precise thus signifying
publication bias. . The rest of the studies show normal distribution thus having no
publication biases.
References
Bias detection in meta-analysis (n.d.). Retrieved
from http://www.statsdirect.com/help/meta_analysis/bias_detection.htm (Links to an
external site.)Links to an external site..
Zheng, J., Huang, T., Yu, Y., Hu, X., Yang, B., & Li, D. (2010). Fish consumption and
CHD mortality: an updated meta-analysis of seventeen cohort studies. Public Health
Nutrition, 15(4), 725-737. Retrieved from https://www.cambridge.org/core/services/aop-
cambridge-core/content/view/542F9A99EC48AFE8B6A1A73C854B1881/
S1368980011002254a.pdf/div-class-title-fish-consumption-and-chd-mortality-an-
updated-meta-analysis-of-seventeen-cohort-studies-div.pdf (Links to an external
site.)Links to an external site.
chevron_up_icon
1 out of 6
circle_padding
hide_on_mobile
zoom_out_icon
[object Object]