CHS 780 Biostatistics Final Exam Part 2: Public Health Calculations
VerifiedAdded on 2023/05/28
|7
|1071
|107
Quiz and Exam
AI Summary
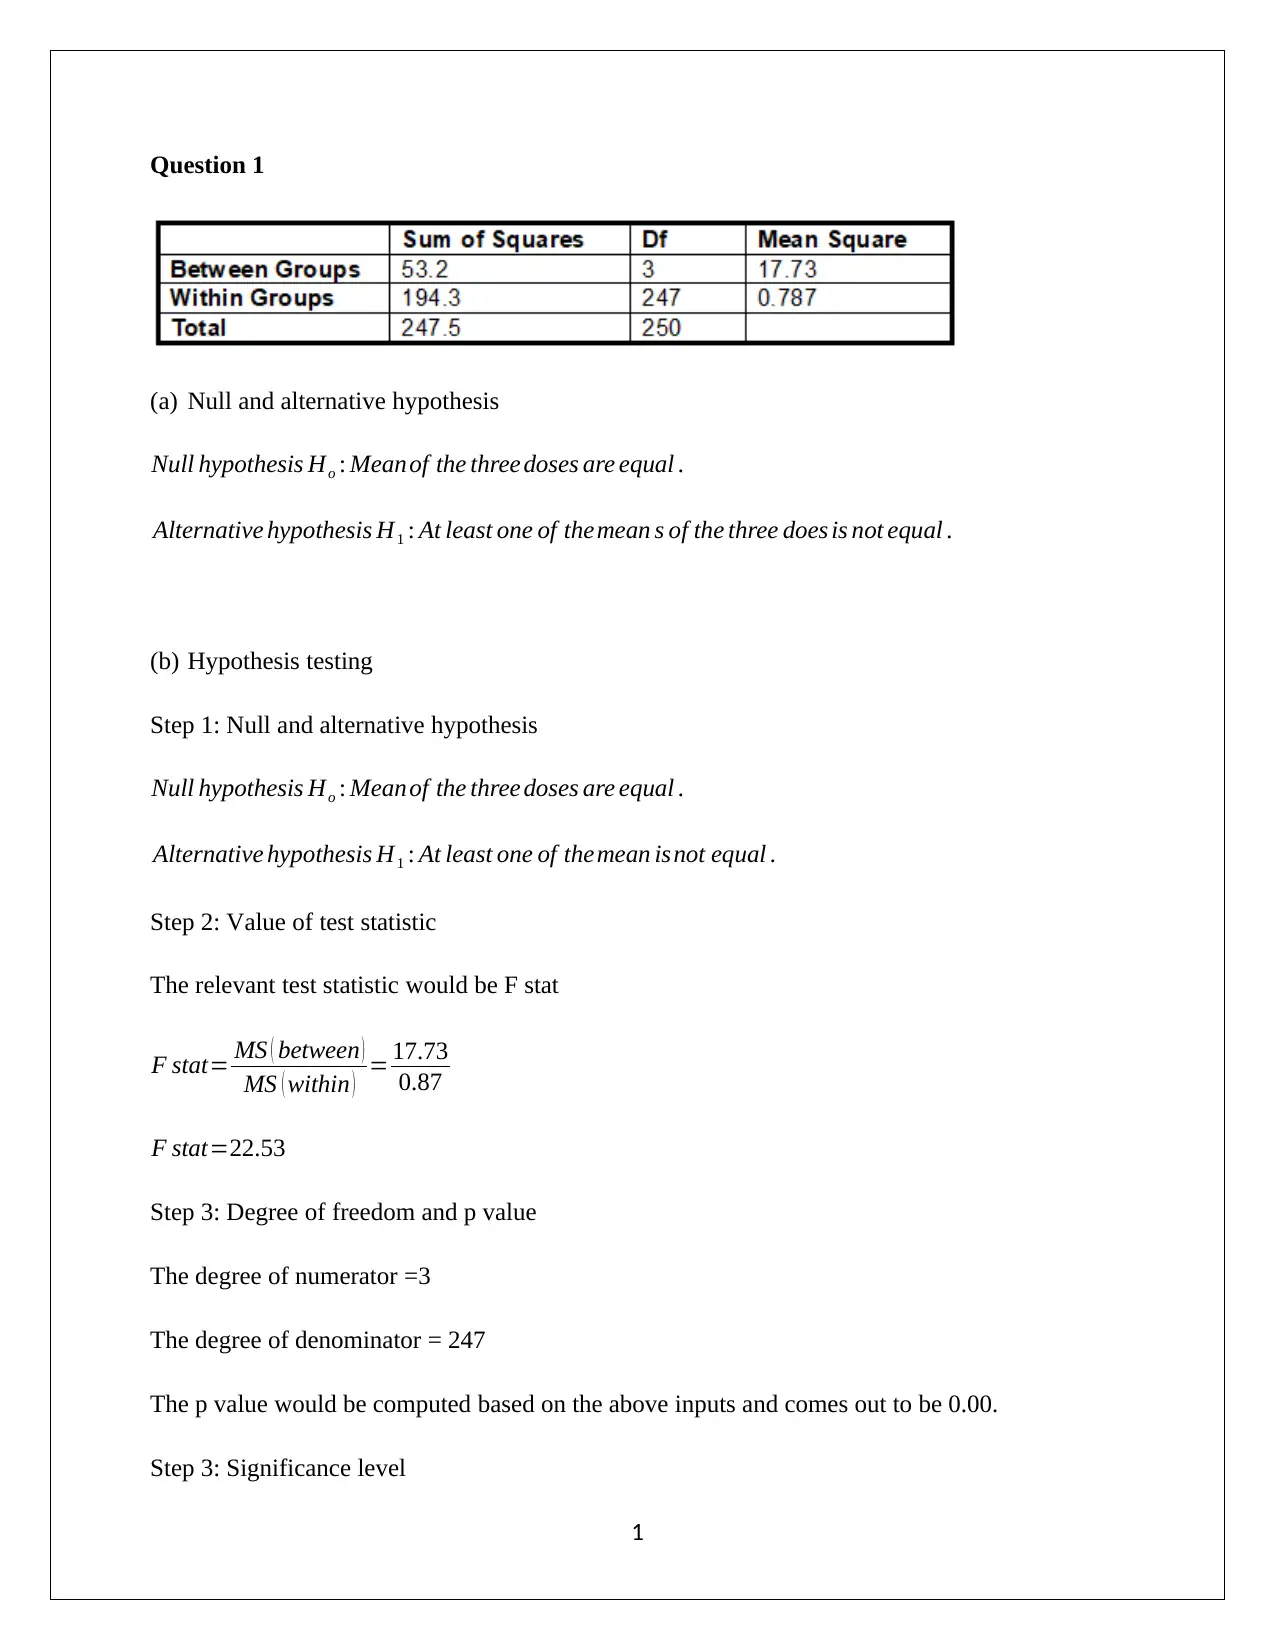
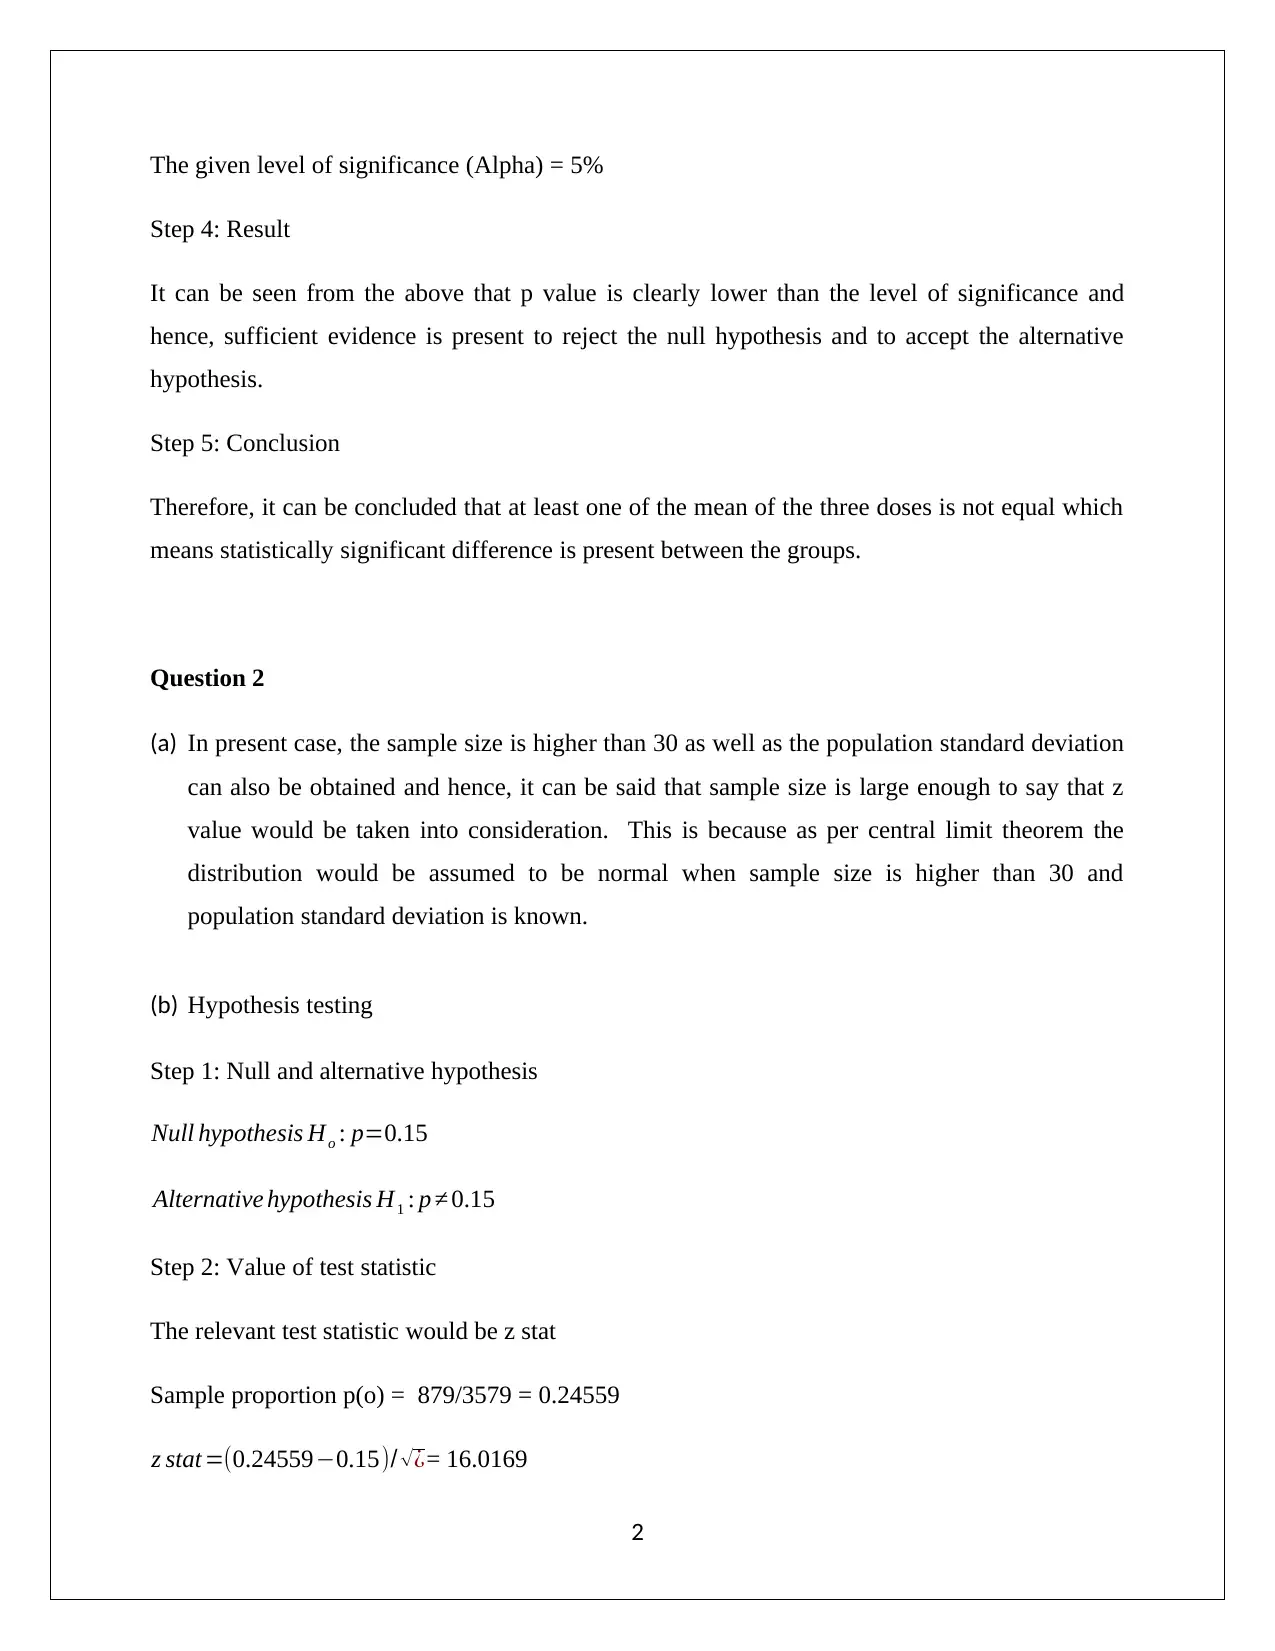
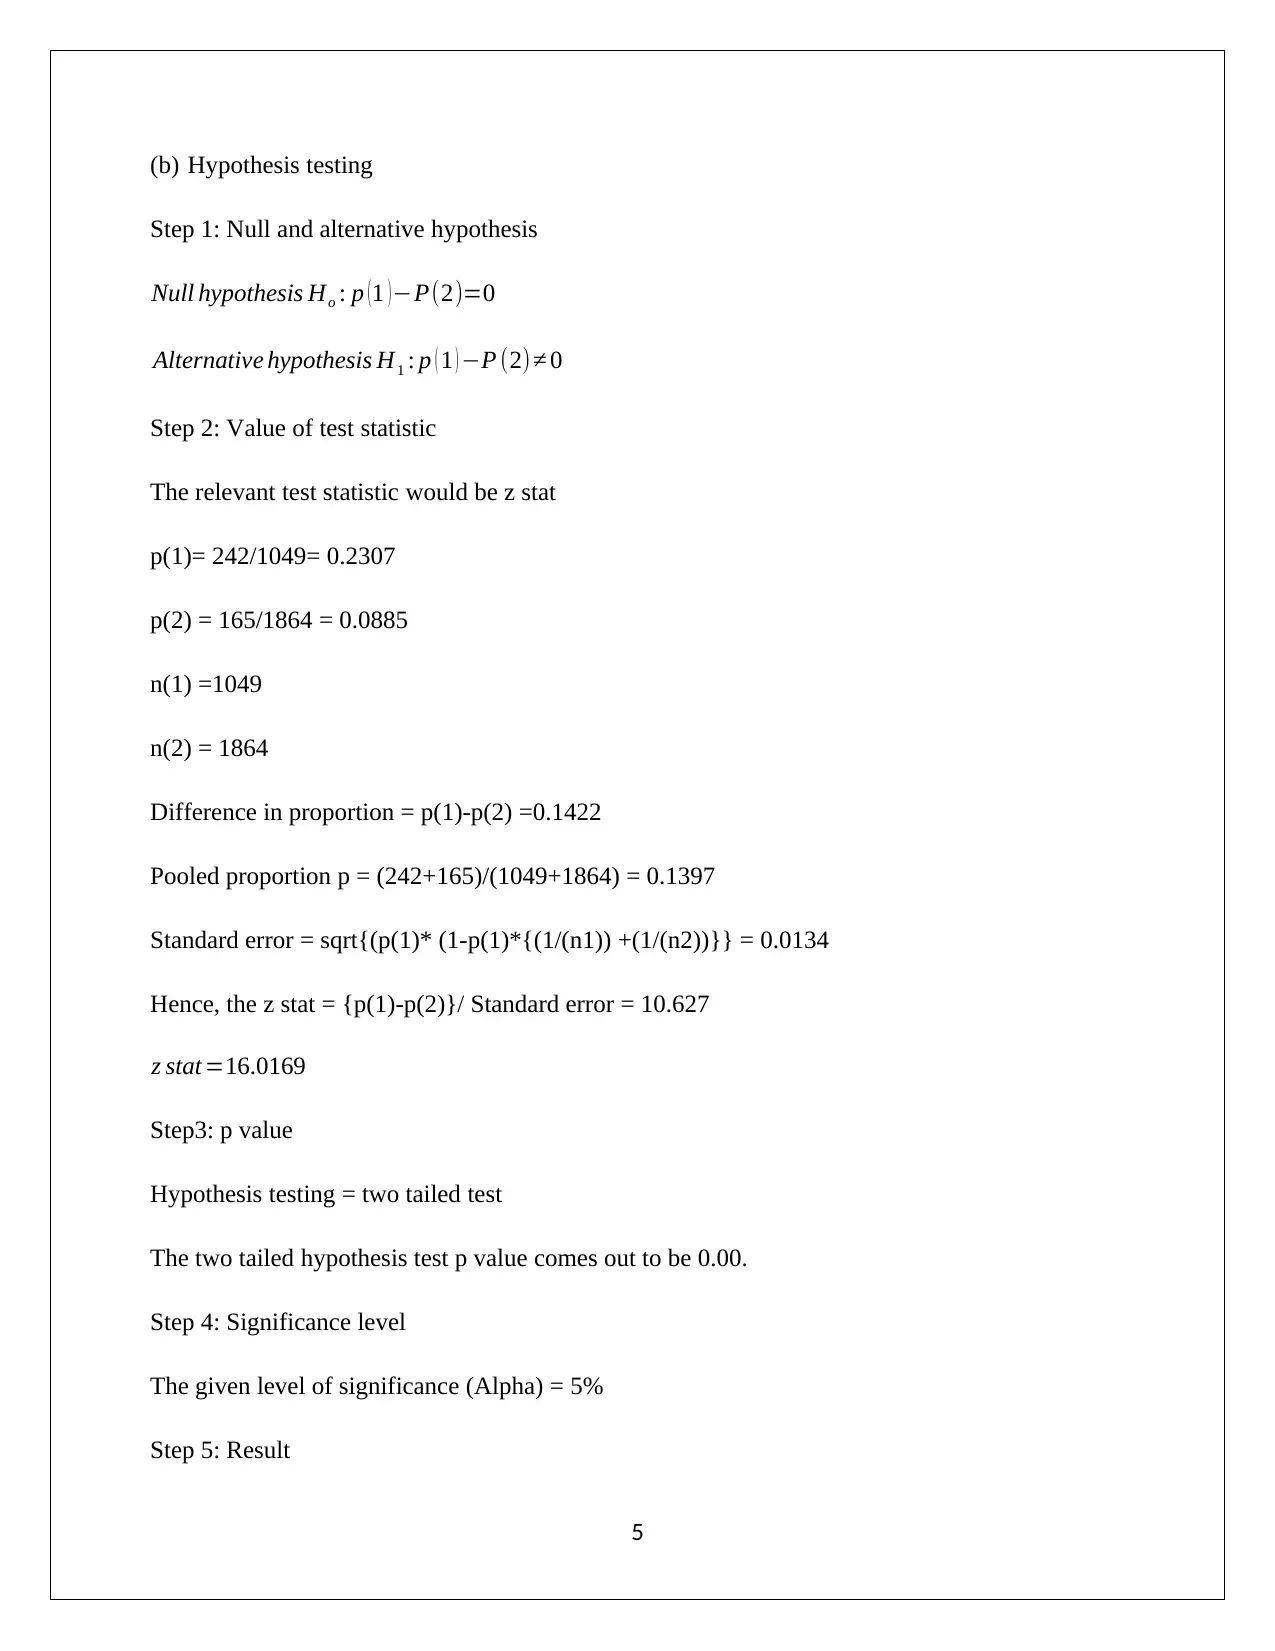
This document presents the solutions to a Biostatistics in Public Health final exam, focusing on calculation problems. The exam covers hypothesis testing, including null and alternative hypotheses, test statistics (F-stat and z-stat), p-values, significance levels, and conclusions. It also includes calculations for confidence intervals and prevalence proportions in different ethnic groups. Specific questions address comparing means of different doses, analyzing vaccine prevalence, and assessing the relationship between intravenous drug use and Hepatitis C. The solutions provide detailed steps and interpretations, demonstrating the application of statistical methods in public health research. The final conclusion emphasizes statistically significant differences in various scenarios based on the hypothesis testing outcomes.

STATISTICS
STUDENT ID:
[Pick the date]
STUDENT ID:
[Pick the date]
Paraphrase This Document
Need a fresh take? Get an instant paraphrase of this document with our AI Paraphraser

Question 1
(a) Null and alternative hypothesis
Null hypothesis Ho : Meanof the three doses are equal .
Alternative hypothesis H1 : At least one of themean s of the three does is not equal .
(b) Hypothesis testing
Step 1: Null and alternative hypothesis
Null hypothesis Ho : Meanof the three doses are equal .
Alternative hypothesis H1 : At least one of themean isnot equal .
Step 2: Value of test statistic
The relevant test statistic would be F stat
F stat= MS ( between )
MS ( within ) = 17.73
0.87
F stat=22.53
Step 3: Degree of freedom and p value
The degree of numerator =3
The degree of denominator = 247
The p value would be computed based on the above inputs and comes out to be 0.00.
Step 3: Significance level
1

The given level of significance (Alpha) = 5%
Step 4: Result
It can be seen from the above that p value is clearly lower than the level of significance and
hence, sufficient evidence is present to reject the null hypothesis and to accept the alternative
hypothesis.
Step 5: Conclusion
Therefore, it can be concluded that at least one of the mean of the three doses is not equal which
means statistically significant difference is present between the groups.
Question 2
(a) In present case, the sample size is higher than 30 as well as the population standard deviation
can also be obtained and hence, it can be said that sample size is large enough to say that z
value would be taken into consideration. This is because as per central limit theorem the
distribution would be assumed to be normal when sample size is higher than 30 and
population standard deviation is known.
(b) Hypothesis testing
Step 1: Null and alternative hypothesis
Null hypothesis Ho : p=0.15
Alternative hypothesis H1 : p ≠ 0.15
Step 2: Value of test statistic
The relevant test statistic would be z stat
Sample proportion p(o) = 879/3579 = 0.24559
z stat =(0.24559−0.15)/ √¿= 16.0169
2
⊘ This is a preview!⊘
Do you want full access?
Subscribe today to unlock all pages.

Trusted by 1+ million students worldwide

z stat =16.0169
Step 3: p value
Hypothesis testing = two tailed test
The two tailed hypothesis test p value comes out to be 0.00.
Step 3: Significance level
The given level of significance (Alpha) = 5%
Step 4: Result
It can be seen from the above that p value is clearly lower than the level of significance and
hence, sufficient evidence is present to reject the null hypothesis and to accept the alternative
hypothesis.
Step 5: Conclusion
Therefore, it can be concluded that National vaccine prevalence is significantly difference from
15% in same age demographic.
(c) 95% two sided confidence interval for p
The z value for 95% confidence interval = 1.96
Lower limit = 0.2456 – (1.96* sqrt(0.2456*(1-0.2456)/3579) = 0.2315
Upper limit = 0.2456 + (1.96* sqrt(0.2456*(1-0.2456)/3579) = 0.2597
95% confidence interval = [0.2315 0.2597]
It is apparent from the above that 0.15 does not fall in the range and hence, it can be concluded
that national vaccine prevalence is not 15%. Hence, the null hypothesis would be rejected.
d) It is evident that in case of both the above outputs, the null hypothesis is rejected and the
alternative hypothesis is accepted. Hence, it would be fair to conclude that the national vaccine
prevalence is not upto 15% and infact greater than that.
3
Paraphrase This Document
Need a fresh take? Get an instant paraphrase of this document with our AI Paraphraser

Question 3
(a) Contingency table
Particulars Hepatitis C Not Hepatitis Total
Intravenous drug use
(IDU) 432 255 687
No Intravenous drug
use (No IDU) 369 4442 4811
Total 801 4697 5498
(b) Expected frequencies
Particulars Hepatitis C Not Hepatitis Total
Intravenous drug use
(IDU)
=(687/5498)*801
=100.09
=(687/5498)*4697
=586.91 687
No Intravenous drug
use (No IDU)
=(4811/5498)*801
=700.91
=(4811/5498)*4697
=4110.09 4811
Total 801 4697 5498
Question 4
(a) Prevalence proportions in the ethnic groups
Prevalence proportion in African- American group p(1)= 242/1049= 0.2307
Prevalence proportion in other group p(2) = 165/1864 = 0.0885
4

(b) Hypothesis testing
Step 1: Null and alternative hypothesis
Null hypothesis Ho : p ( 1 ) −P(2)=0
Alternative hypothesis H1 : p ( 1 ) −P (2)≠ 0
Step 2: Value of test statistic
The relevant test statistic would be z stat
p(1)= 242/1049= 0.2307
p(2) = 165/1864 = 0.0885
n(1) =1049
n(2) = 1864
Difference in proportion = p(1)-p(2) =0.1422
Pooled proportion p = (242+165)/(1049+1864) = 0.1397
Standard error = sqrt{(p(1)* (1-p(1)*{(1/(n1)) +(1/(n2))}} = 0.0134
Hence, the z stat = {p(1)-p(2)}/ Standard error = 10.627
z stat =16.0169
Step3: p value
Hypothesis testing = two tailed test
The two tailed hypothesis test p value comes out to be 0.00.
Step 4: Significance level
The given level of significance (Alpha) = 5%
Step 5: Result
5
⊘ This is a preview!⊘
Do you want full access?
Subscribe today to unlock all pages.

Trusted by 1+ million students worldwide

It can be seen from the above that p value is clearly lower than the level of significance and
hence, sufficient evidence is present to reject the null hypothesis and to accept the alternative
hypothesis.
Step 6: Conclusion
Therefore, it can be concluded that there is statistically significant difference is present in the
prevalence proportion between the two ethnic groups.
6
hence, sufficient evidence is present to reject the null hypothesis and to accept the alternative
hypothesis.
Step 6: Conclusion
Therefore, it can be concluded that there is statistically significant difference is present in the
prevalence proportion between the two ethnic groups.
6
1 out of 7
Related Documents

Your All-in-One AI-Powered Toolkit for Academic Success.
+13062052269
info@desklib.com
Available 24*7 on WhatsApp / Email
Unlock your academic potential
Copyright © 2020–2025 A2Z Services. All Rights Reserved. Developed and managed by ZUCOL.