Statistical Analysis of Diabetes Prevalence in Public Health Study

Verified

Added on  2023/01/09

|6
|1267
|40
Homework Assignment
AI Summary
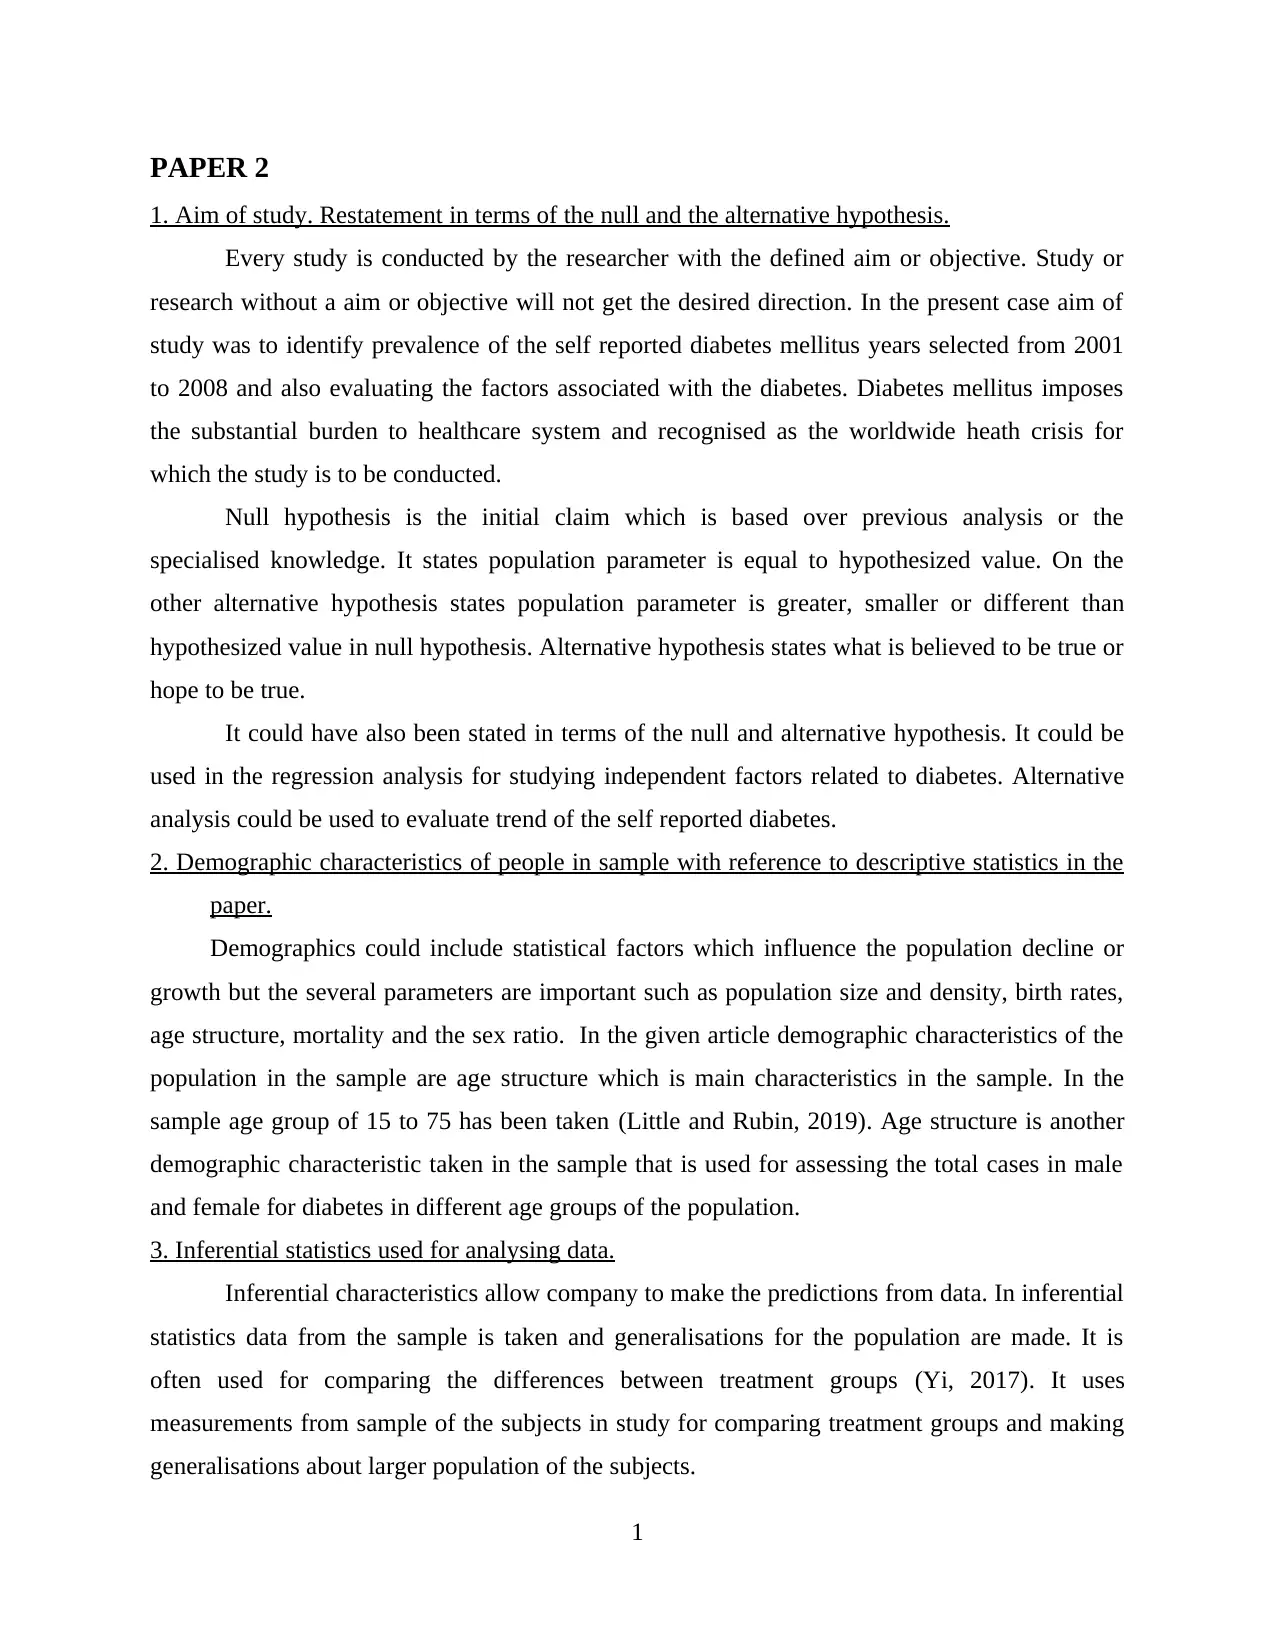
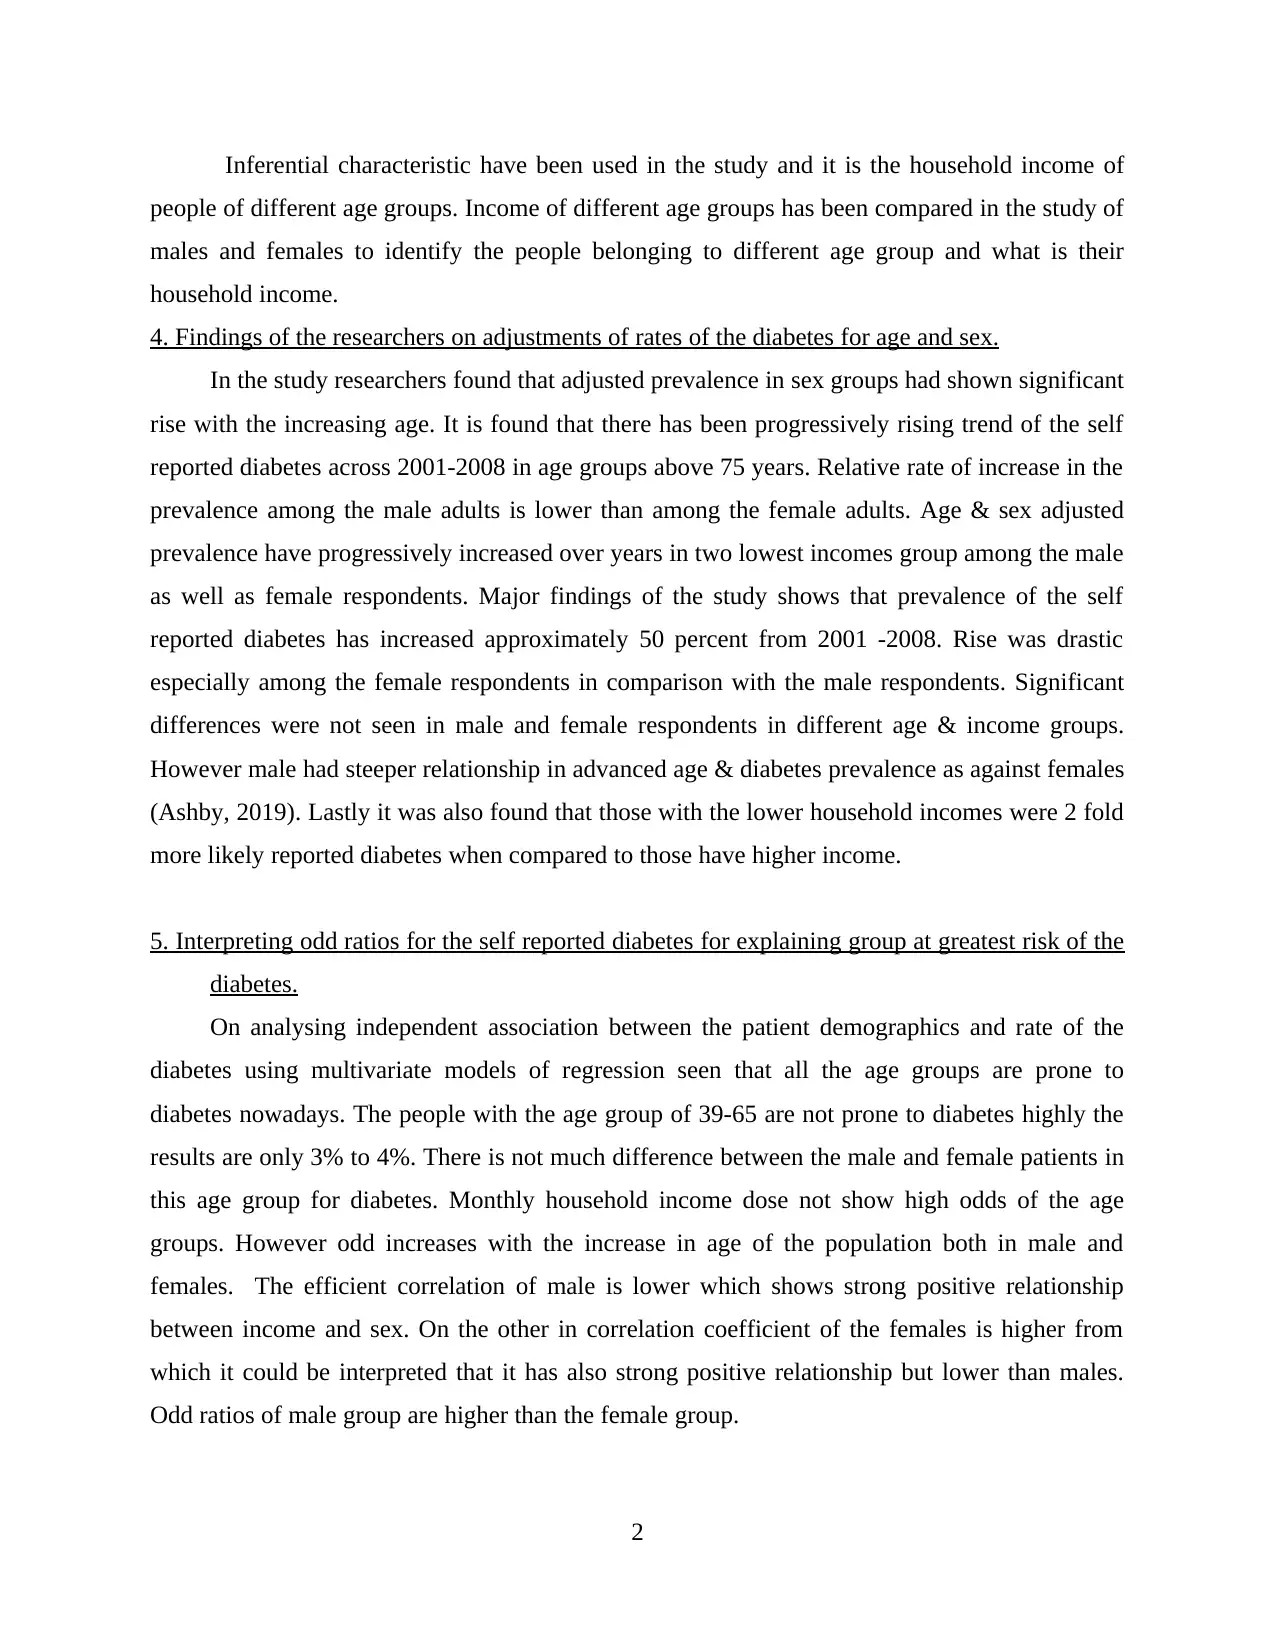
This assignment analyzes a study on diabetes prevalence within a public health context. It begins by restating the study's aim in terms of null and alternative hypotheses. The assignment then examines the demographic characteristics of the sample population, focusing on age structure and its role in diabetes assessment. It delves into the inferential statistics employed to analyze the data, including the comparison of income levels across different age groups and genders. Furthermore, the assignment explores the researchers' findings on the adjustments made to diabetes rates for age and sex, highlighting the rising trend of self-reported diabetes, especially among females and those with lower incomes. The interpretation of odd ratios for self-reported diabetes is discussed, identifying groups at greatest risk, and the impact of the study's limitations on the reliability of its results is evaluated, considering factors like lifecycle factors, family history, and body mass index. The assignment concludes with references to relevant sources.
Document Page
STATISTICS FOR THE
PUBLIC HEALTH
tabler-icon-diamond-filled.svg

Paraphrase This Document

Need a fresh take? Get an instant paraphrase of this document with our AI Paraphraser
Document Page
TABLE OF CONTENTS
TABLE OF CONTENTS................................................................................................................2
PAPER 2..........................................................................................................................................1
1. Aim of study. Restatement in terms of the null and the alternative hypothesis......................1
2. Demographic characteristics of people in sample with reference to descriptive statistics in
the paper.......................................................................................................................................1
3. Inferential statistics used for analysing data............................................................................1
4. Findings of the researchers on adjustments of rates of the diabetes for age and sex..............2
5. Interpreting odd ratios for the self reported diabetes for explaining group at greatest risk of
the diabetes..................................................................................................................................2
6. Impact of the limitations described by researchers over the reliability of the results.............3
REFERENCES................................................................................................................................4
Document Page
PAPER 2
1. Aim of study. Restatement in terms of the null and the alternative hypothesis.
Every study is conducted by the researcher with the defined aim or objective. Study or
research without a aim or objective will not get the desired direction. In the present case aim of
study was to identify prevalence of the self reported diabetes mellitus years selected from 2001
to 2008 and also evaluating the factors associated with the diabetes. Diabetes mellitus imposes
the substantial burden to healthcare system and recognised as the worldwide heath crisis for
which the study is to be conducted.
Null hypothesis is the initial claim which is based over previous analysis or the
specialised knowledge. It states population parameter is equal to hypothesized value. On the
other alternative hypothesis states population parameter is greater, smaller or different than
hypothesized value in null hypothesis. Alternative hypothesis states what is believed to be true or
hope to be true.
It could have also been stated in terms of the null and alternative hypothesis. It could be
used in the regression analysis for studying independent factors related to diabetes. Alternative
analysis could be used to evaluate trend of the self reported diabetes.
2. Demographic characteristics of people in sample with reference to descriptive statistics in the
paper.
Demographics could include statistical factors which influence the population decline or
growth but the several parameters are important such as population size and density, birth rates,
age structure, mortality and the sex ratio. In the given article demographic characteristics of the
population in the sample are age structure which is main characteristics in the sample. In the
sample age group of 15 to 75 has been taken (Little and Rubin, 2019). Age structure is another
demographic characteristic taken in the sample that is used for assessing the total cases in male
and female for diabetes in different age groups of the population.
3. Inferential statistics used for analysing data.
Inferential characteristics allow company to make the predictions from data. In inferential
statistics data from the sample is taken and generalisations for the population are made. It is
often used for comparing the differences between treatment groups (Yi, 2017). It uses
measurements from sample of the subjects in study for comparing treatment groups and making
generalisations about larger population of the subjects.
1
Document Page
Inferential characteristic have been used in the study and it is the household income of
people of different age groups. Income of different age groups has been compared in the study of
males and females to identify the people belonging to different age group and what is their
household income.
4. Findings of the researchers on adjustments of rates of the diabetes for age and sex.
In the study researchers found that adjusted prevalence in sex groups had shown significant
rise with the increasing age. It is found that there has been progressively rising trend of the self
reported diabetes across 2001-2008 in age groups above 75 years. Relative rate of increase in the
prevalence among the male adults is lower than among the female adults. Age & sex adjusted
prevalence have progressively increased over years in two lowest incomes group among the male
as well as female respondents. Major findings of the study shows that prevalence of the self
reported diabetes has increased approximately 50 percent from 2001 -2008. Rise was drastic
especially among the female respondents in comparison with the male respondents. Significant
differences were not seen in male and female respondents in different age & income groups.
However male had steeper relationship in advanced age & diabetes prevalence as against females
(Ashby, 2019). Lastly it was also found that those with the lower household incomes were 2 fold
more likely reported diabetes when compared to those have higher income.
5. Interpreting odd ratios for the self reported diabetes for explaining group at greatest risk of the
diabetes.
On analysing independent association between the patient demographics and rate of the
diabetes using multivariate models of regression seen that all the age groups are prone to
diabetes nowadays. The people with the age group of 39-65 are not prone to diabetes highly the
results are only 3% to 4%. There is not much difference between the male and female patients in
this age group for diabetes. Monthly household income dose not show high odds of the age
groups. However odd increases with the increase in age of the population both in male and
females. The efficient correlation of male is lower which shows strong positive relationship
between income and sex. On the other in correlation coefficient of the females is higher from
which it could be interpreted that it has also strong positive relationship but lower than males.
Odd ratios of male group are higher than the female group.
2
tabler-icon-diamond-filled.svg

Paraphrase This Document

Need a fresh take? Get an instant paraphrase of this document with our AI Paraphraser
Document Page
6. Impact of the limitations described by researchers over the reliability of the results.
Limitations are to be analysed for knowing the extent of reliability that could be imposed
over the results that are drawn by the researchers. Researcher in the study has not taken account
lifecycle factors, family history of the diabetes and the body mass index. The study is also
conducted on the basis of stratified random sampling. Regression analysis used has shown 20%
of variability of the diabetes prevalence.
The above results have influence over the diabetes and causes of diabetes. Researcher has
not taken the factors that cause the diabetes as the study was aimed at identifying the diabetic
prevalence in different groups (Stehlik-Barry and Babinec, 2017). Factors influencing are taken
such as age and income where the family history and body mass are of not much relevance for
study. 20%variatons are enough to identify and make assumptions. Therefore the outcomes of
the study could be relied by the users and researcher as limitations do not have high influence
over the results.
3
Document Page
REFERENCES
Books and Journals
Little, R.J. and Rubin, D.B., 2019. Statistical analysis with missing data (Vol. 793). John Wiley
& Sons.
Ashby, F.G., 2019. Statistical analysis of fMRI data. MIT press.
Yi, G.Y., 2017. Statistical analysis with measurement error or misclassification: strategy,
method and application. Springer.
Stehlik-Barry, K. and Babinec, A.J., 2017. Data analysis with IBM SPSS statistics. Packt
Publishing Ltd.
4
chevron_up_icon
1 out of 6
circle_padding
hide_on_mobile
zoom_out_icon
[object Object]