BUS708 Data Analysis Report: Recommendations for NSW Transport System
VerifiedAdded on 2023/06/07
|10
|2442
|484
Report
AI Summary
This report analyzes NSW transport data from the period of August 8th to 14th, 2016, focusing on Opal tap on and off locations to provide recommendations for the public transport system. The analysis includes two datasets: one provided by Transport for NSW (Dataset 1) and another collected through an offline survey (Dataset 2). Dataset 1 examines the usage of buses, trains, ferries, and light rail, revealing that trains were the most used mode of transport. The report also analyzes the data for three stations (Bankstown, Gosford, and Parramatta) and concludes that Parramatta station had the highest tap on/off activity, suggesting the need for an underground railway station. Dataset 2 provides insights into gender preferences for different transport modes. Statistical methods, including single proportion tests and ANOVA, are used to derive conclusions. The report recommends building an underground railway station from Parramatta station to central and also suggests that female prefer train transport than male and male prefers bus than female.
Table of Contents
Executive summary:................................................................................................................................2
Section 1: Introduction...........................................................................................................................2
Section 2: Analysis of single variable in Dataset 1.................................................................................3
Section 3: Analysis of two variables in Dataset 1...................................................................................5
Section 4: Collect and analysis Dataset2:...............................................................................................7
Section 5: Discussion & Conclusion........................................................................................................8
References:..............................................................................................................................................9
Paraphrase This Document
Need a fresh take? Get an instant paraphrase of this document with our AI Paraphraser
Executive summary:
The analysis based on data of opal tap on and tap off location between 8th to 14th August 2016 in
Australia and to provide recommendations for public transport system.
According to the analysis of the sample data, the employees was using buses 46.3% and trains 50.30% as
a choice of public transport. There are 50% of public transport users in NSW use the train mode of
transport.
Parramatta station have mostly used tap on/off location, so government can build underground railway
station from Parramatta station to central. Also, NSW government can build underground railway
station from Parramatta station to central.
Section 1: Introduction
a. The article based on the analysis of public transport system. The data for the study has been provided
by transport for NSW, the provided data is a subset of opal tap on and tap off location between 8th to
14th August 2016 in Australia.
Consider the article “Transport systems and their impact con gender equity”,
(https://www.sciencedirect.com/science/article/pii/S2352146517305355), the analysis shows that there
are variances in transport convenience between men and women, and women have less accessibility
because of the higher travel times and percentage of income spent in transport. In the higher income
regions, men and women mark comparable number of journeys per day and spend comparable
percentages of their income. Also, it was exciting to see that, women chose cheapest mode, and at
whatever time possible, women preferred the private vehicle like car or taxi among the public transport
modes.
The requirement of the study is to provide the recommendations to improve public transport system.
So, business question can be assume as, is there a significance difference between the proportions of
particular mode of transport.
b. The data collection can be divided into two types, the first one is Primary data, which collected
directly from the employees on the basis of designed questionnaire. The other one is Secondary data,
which collected from some other resources according to the requirement of analysis. (Goodwin, 2012).
The dataset 1 has been provided by transport for NSW, it is a subset of opal tap on and tap off location
between 8th to 14th August 2016 in Australia. Thus, dataset 1 is collected by other source. Hence, it is a
secondary data.
The collected data can be further categorized as qualitative or quantitative measurements, the
qualitative data contains the values for the ordinal level and the nominal level of measurements.
And, the quantitative data contain the values of interval or ratio level measurements. (Morgan, 2013).
The dataset-1 contains data of 1000 peoples which have 5 variables that are as follows:
1. Mode type of public transport which are Bus, Train, Ferry and Light Rail indicated by the variable
mode. The variable mode has divided into four categories, so it is a nominal level variable.
2. Date of tap on/off held which is date, the variable date indicates the time when the tap on/off happed
by the passenger. It contains the continuous values, so it is an interval level of measurement.
3. The tap on/off which is tap have two attributes as tap on/off, so it is a nominal level variable.
4. Time of tap on/off held which is time, the variable time indicates the time when the tap on/off
happed by the passenger. It contains the continuous values, so it is an interval level of measurement.
5. locations of spots which is “loc” indicates the location of tap on/off.
6. Count, the variable count indicates the number of tap on/off at the particular location and time. The
variable count contains, the numeric values, so it is an interval level of measurement.
c. The dataset-2 collected by offline survey, I asked questions to employed people about their transport
type, tap on/off and gender type. Thus, it is directly collected from the working people, thus dataset 2 is
a primary data.
The dataset2 is collected by 40 working people, which is greater than sample size 30. Thus, the results
obtained from the study will not be biased. The variable mode indicated the type of public transport
which are Bus, Train, Ferry and Light Rail indicated by the variable mode. The variable mode has divided
into four categories, so it will be nominal level variable.
The variable tap specifies the tap type which has divided into 2 categories (on and off), so it is a nominal
level variable. The variable gender specifies the type of gender which has divided into 2 categories (male
or female), so it is a nominal level variable.
Section 2: Analysis of single variable in Dataset 1
a. The numerical for the type of public transport is shown below:
Row Labels Count of mode Percentage of mode
bus 463 46.30%
ferry 19 1.90%
lightrail 15 1.50%
train 503 50.30%
Grand Total 1000
According to the above numerical summary, out of 1000 times, buses was used 463 times, trains was
used 503 times, ferry was used 19 times and lightrail was used 15. The people mostly prefer the train
(50.30%) and the bus (46.30%) for the public transport. Thus, train was most used by the NSW people
during 8th to 14th of August 2016.
⊘ This is a preview!⊘
Do you want full access?
Subscribe today to unlock all pages.
Trusted by 1+ million students worldwide
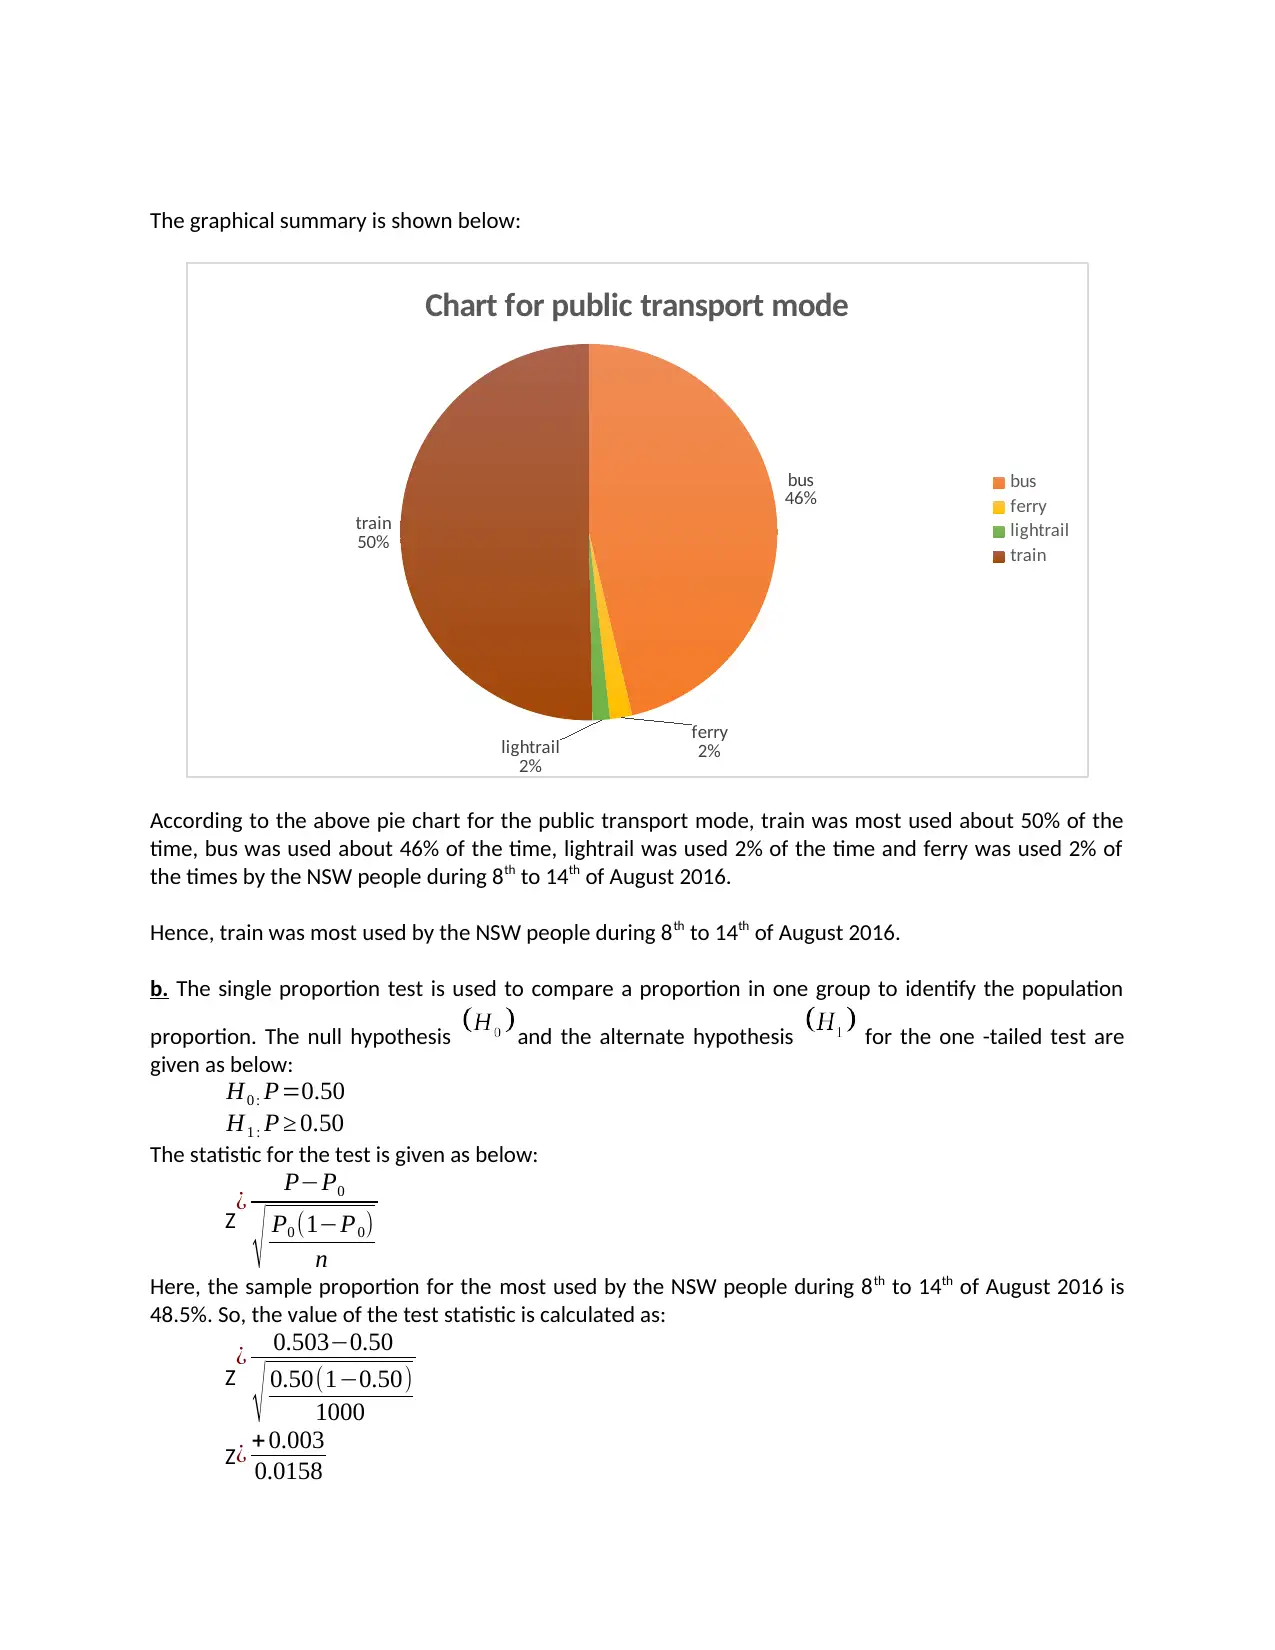
The graphical summary is shown below:
bus
46%
ferry
2%lightrail
2%
train
50%
Chart for public transport mode
bus
ferry
lightrail
train
According to the above pie chart for the public transport mode, train was most used about 50% of the
time, bus was used about 46% of the time, lightrail was used 2% of the time and ferry was used 2% of
the times by the NSW people during 8th to 14th of August 2016.
Hence, train was most used by the NSW people during 8th to 14th of August 2016.
b. The single proportion test is used to compare a proportion in one group to identify the population
proportion. The null hypothesis and the alternate hypothesis for the one -tailed test are
given as below:
H0 : P=0.50
H1 : P ≥ 0.50
The statistic for the test is given as below:
Z
¿ P−P0
√ P0 (1−P0)
n
Here, the sample proportion for the most used by the NSW people during 8th to 14th of August 2016 is
48.5%. So, the value of the test statistic is calculated as:
Z
¿ 0.503−0.50
√ 0.50(1−0.50)
1000
Z¿ + 0.003
0.0158
bus
46%
ferry
2%lightrail
2%
train
50%
Chart for public transport mode
bus
ferry
lightrail
train
According to the above pie chart for the public transport mode, train was most used about 50% of the
time, bus was used about 46% of the time, lightrail was used 2% of the time and ferry was used 2% of
the times by the NSW people during 8th to 14th of August 2016.
Hence, train was most used by the NSW people during 8th to 14th of August 2016.
b. The single proportion test is used to compare a proportion in one group to identify the population
proportion. The null hypothesis and the alternate hypothesis for the one -tailed test are
given as below:
H0 : P=0.50
H1 : P ≥ 0.50
The statistic for the test is given as below:
Z
¿ P−P0
√ P0 (1−P0)
n
Here, the sample proportion for the most used by the NSW people during 8th to 14th of August 2016 is
48.5%. So, the value of the test statistic is calculated as:
Z
¿ 0.503−0.50
√ 0.50(1−0.50)
1000
Z¿ + 0.003
0.0158
Paraphrase This Document
Need a fresh take? Get an instant paraphrase of this document with our AI Paraphraser
Z
¿ 0.1898
Now use, the standard normal probability table for one tailed test, the p-value is about 0.425.
From the results, it is observed that p-value is 0.425. Now, compare the p-value with level of significance
say 0.05. As p-Value > level of significance (0.05), the null hypothesis is accepted and thus there is
sufficient evidence to conclude there are more than 50% of public transport users in NSW use the train
mode of transport found in Part a.
Section 3: Analysis of two variables in Dataset 1
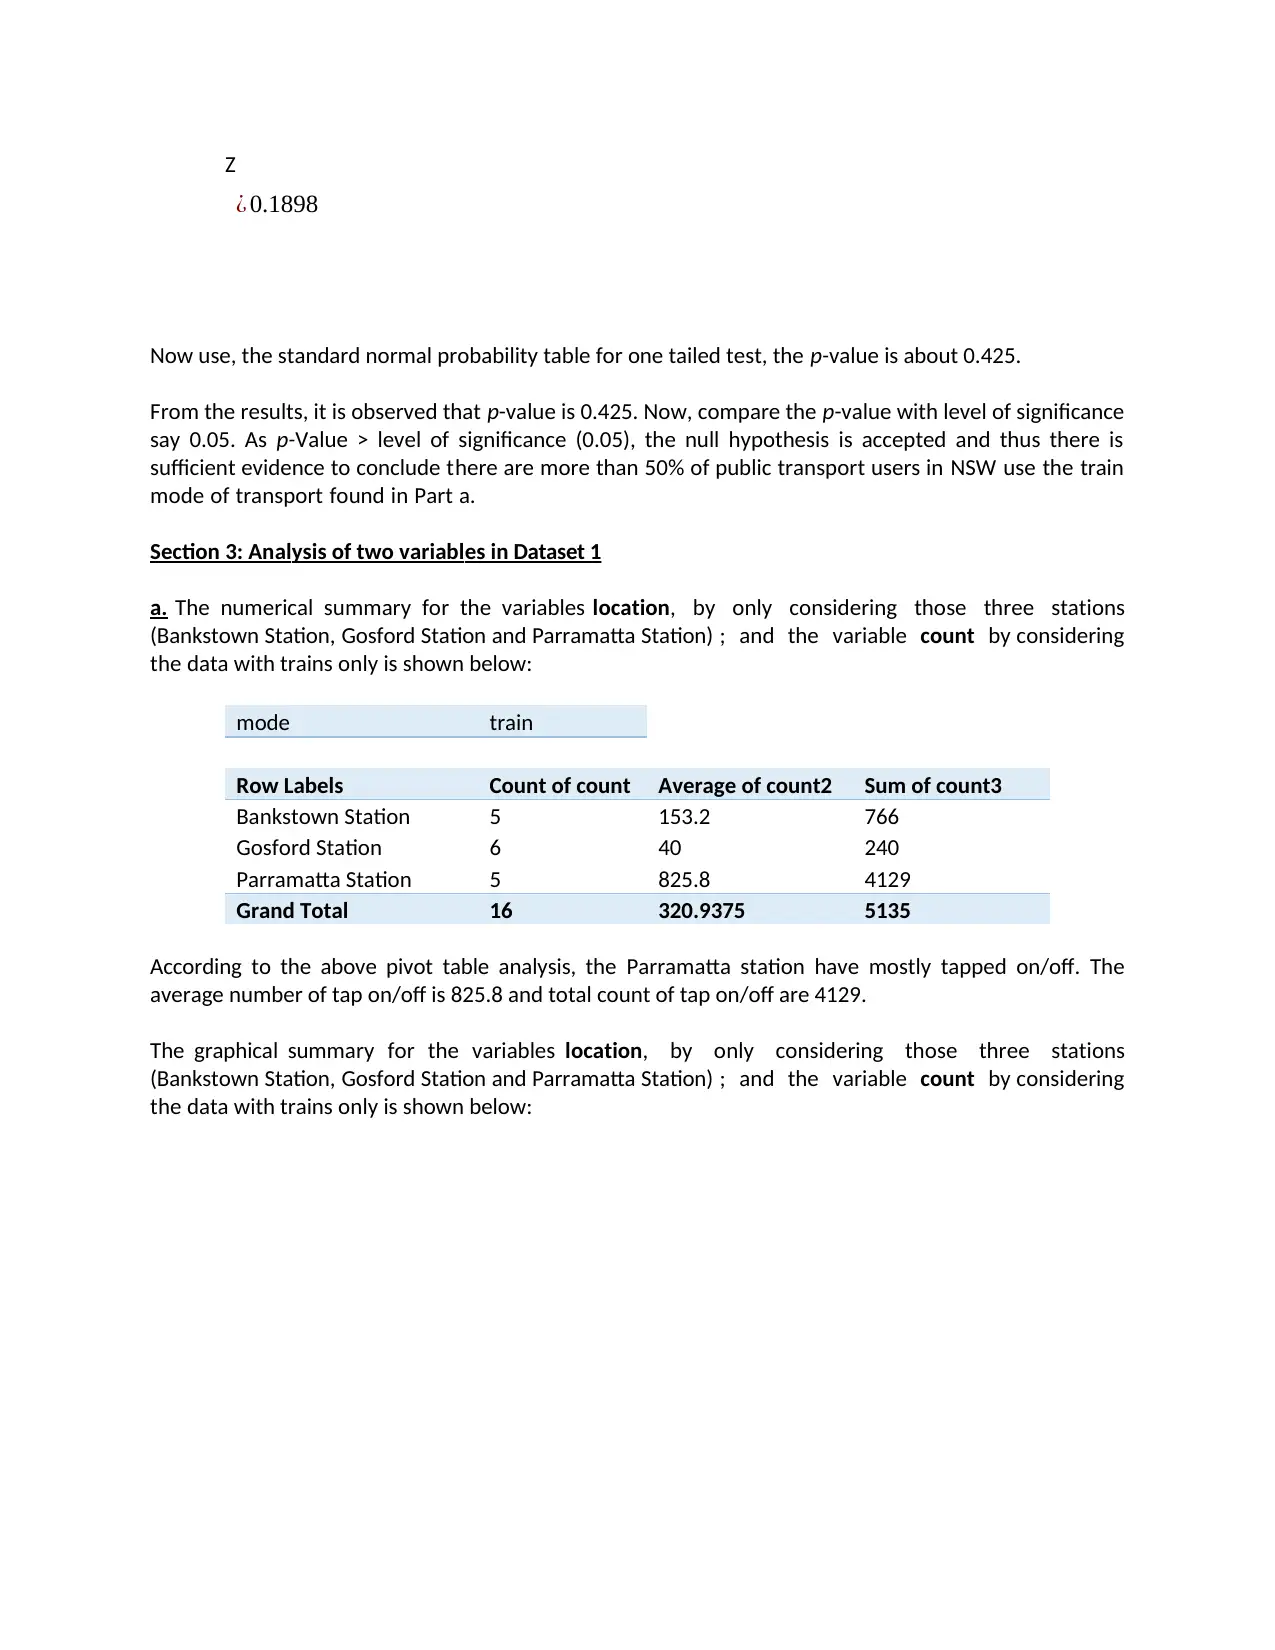
a. The numerical summary for the variables location, by only considering those three stations
(Bankstown Station, Gosford Station and Parramatta Station) ; and the variable count by considering
the data with trains only is shown below:
mode train
Row Labels Count of count Average of count2 Sum of count3
Bankstown Station 5 153.2 766
Gosford Station 6 40 240
Parramatta Station 5 825.8 4129
Grand Total 16 320.9375 5135
According to the above pivot table analysis, the Parramatta station have mostly tapped on/off. The
average number of tap on/off is 825.8 and total count of tap on/off are 4129.
The graphical summary for the variables location, by only considering those three stations
(Bankstown Station, Gosford Station and Parramatta Station) ; and the variable count by considering
the data with trains only is shown below:
¿ 0.1898
Now use, the standard normal probability table for one tailed test, the p-value is about 0.425.
From the results, it is observed that p-value is 0.425. Now, compare the p-value with level of significance
say 0.05. As p-Value > level of significance (0.05), the null hypothesis is accepted and thus there is
sufficient evidence to conclude there are more than 50% of public transport users in NSW use the train
mode of transport found in Part a.
Section 3: Analysis of two variables in Dataset 1
a. The numerical summary for the variables location, by only considering those three stations
(Bankstown Station, Gosford Station and Parramatta Station) ; and the variable count by considering
the data with trains only is shown below:
mode train
Row Labels Count of count Average of count2 Sum of count3
Bankstown Station 5 153.2 766
Gosford Station 6 40 240
Parramatta Station 5 825.8 4129
Grand Total 16 320.9375 5135
According to the above pivot table analysis, the Parramatta station have mostly tapped on/off. The
average number of tap on/off is 825.8 and total count of tap on/off are 4129.
The graphical summary for the variables location, by only considering those three stations
(Bankstown Station, Gosford Station and Parramatta Station) ; and the variable count by considering
the data with trains only is shown below:
Bankstown Station Gosford Station Parramatta Station
0
500
1000
1500
2000
2500
3000
3500
4000
4500
5 6 5
153.2 40
825.8766
240
4129
Count of count
Average of count2
Sum of count3
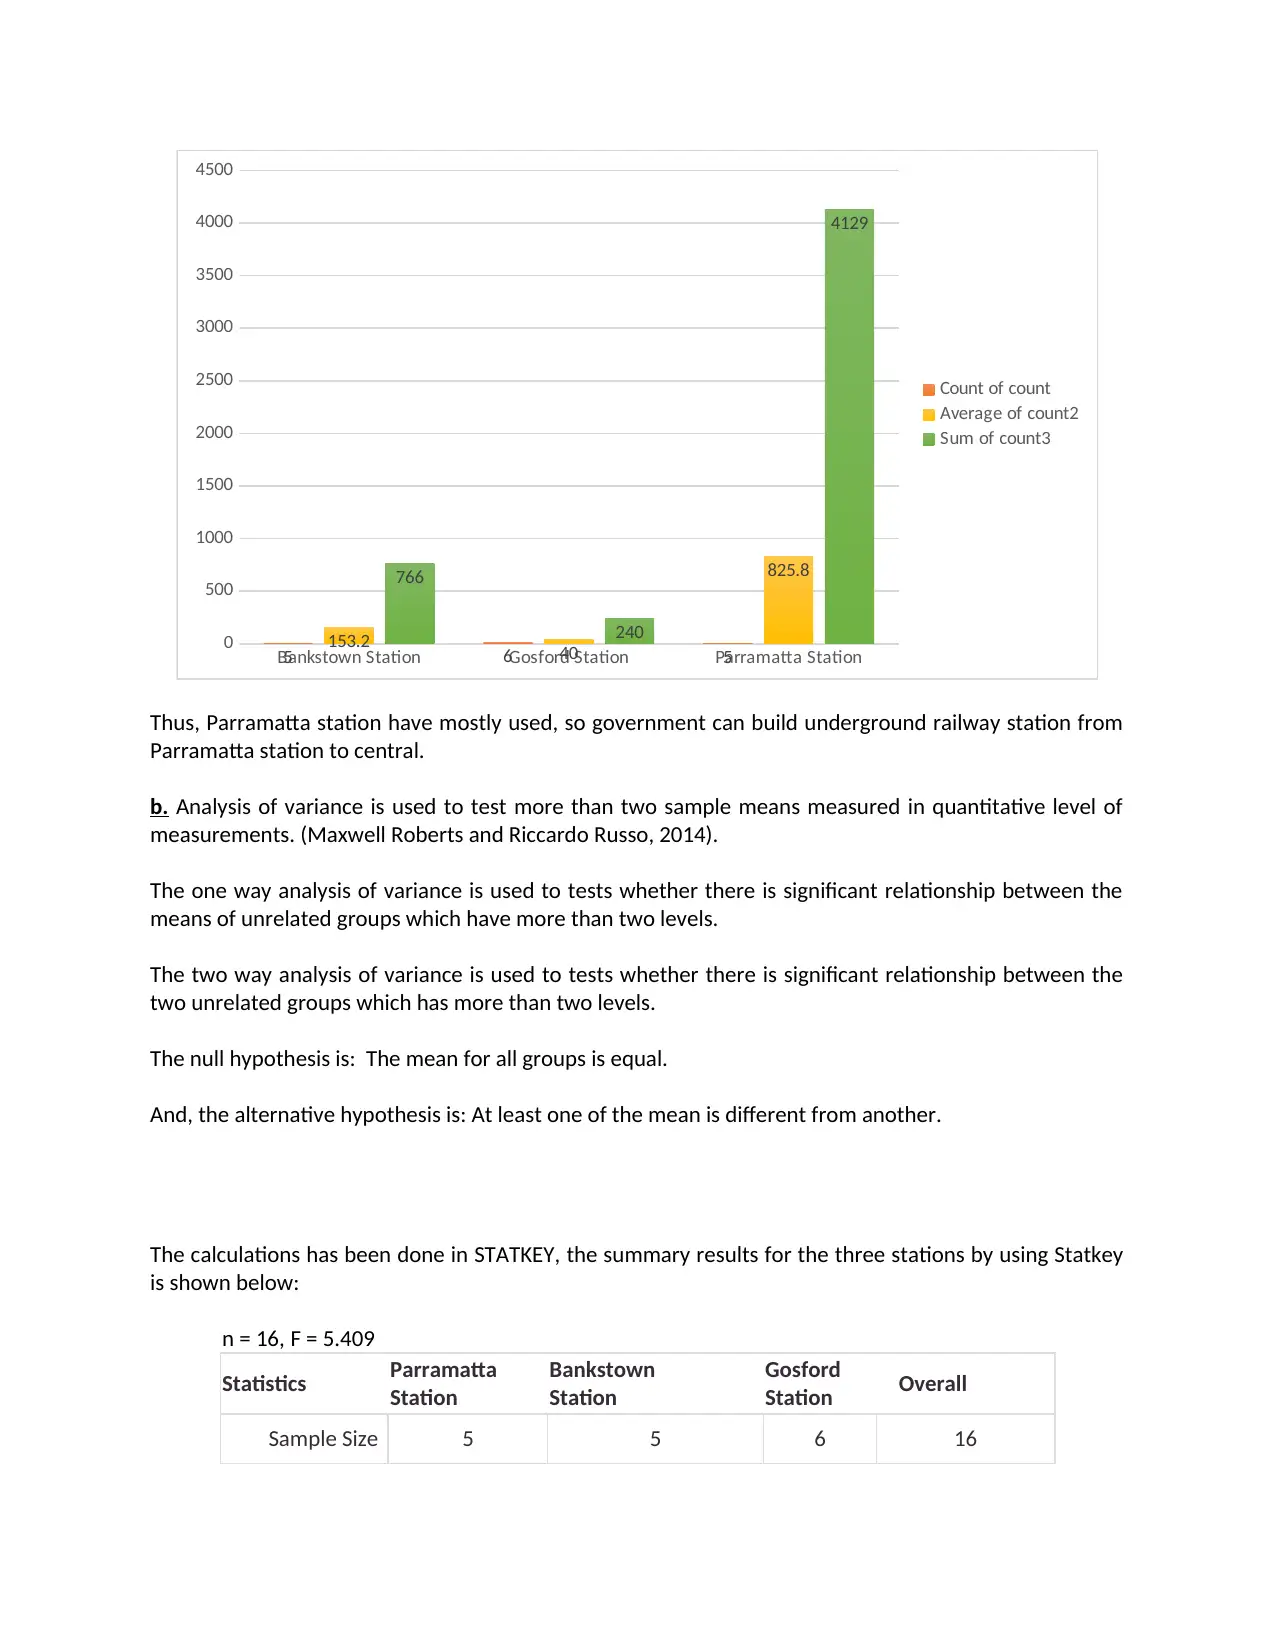
Thus, Parramatta station have mostly used, so government can build underground railway station from
Parramatta station to central.
b. Analysis of variance is used to test more than two sample means measured in quantitative level of
measurements. (Maxwell Roberts and Riccardo Russo, 2014).
The one way analysis of variance is used to tests whether there is significant relationship between the
means of unrelated groups which have more than two levels.
The two way analysis of variance is used to tests whether there is significant relationship between the
two unrelated groups which has more than two levels.
The null hypothesis is: The mean for all groups is equal.
And, the alternative hypothesis is: At least one of the mean is different from another.
The calculations has been done in STATKEY, the summary results for the three stations by using Statkey
is shown below:
n = 16, F = 5.409
Statistics Parramatta
Station
Bankstown
Station
Gosford
Station Overall
Sample Size 5 5 6 16
0
500
1000
1500
2000
2500
3000
3500
4000
4500
5 6 5
153.2 40
825.8766
240
4129
Count of count
Average of count2
Sum of count3
Thus, Parramatta station have mostly used, so government can build underground railway station from
Parramatta station to central.
b. Analysis of variance is used to test more than two sample means measured in quantitative level of
measurements. (Maxwell Roberts and Riccardo Russo, 2014).
The one way analysis of variance is used to tests whether there is significant relationship between the
means of unrelated groups which have more than two levels.
The two way analysis of variance is used to tests whether there is significant relationship between the
two unrelated groups which has more than two levels.
The null hypothesis is: The mean for all groups is equal.
And, the alternative hypothesis is: At least one of the mean is different from another.
The calculations has been done in STATKEY, the summary results for the three stations by using Statkey
is shown below:
n = 16, F = 5.409
Statistics Parramatta
Station
Bankstown
Station
Gosford
Station Overall
Sample Size 5 5 6 16
⊘ This is a preview!⊘
Do you want full access?
Subscribe today to unlock all pages.
Trusted by 1+ million students worldwide
Statistics Parramatta
Station
Bankstown
Station
Gosford
Station Overall
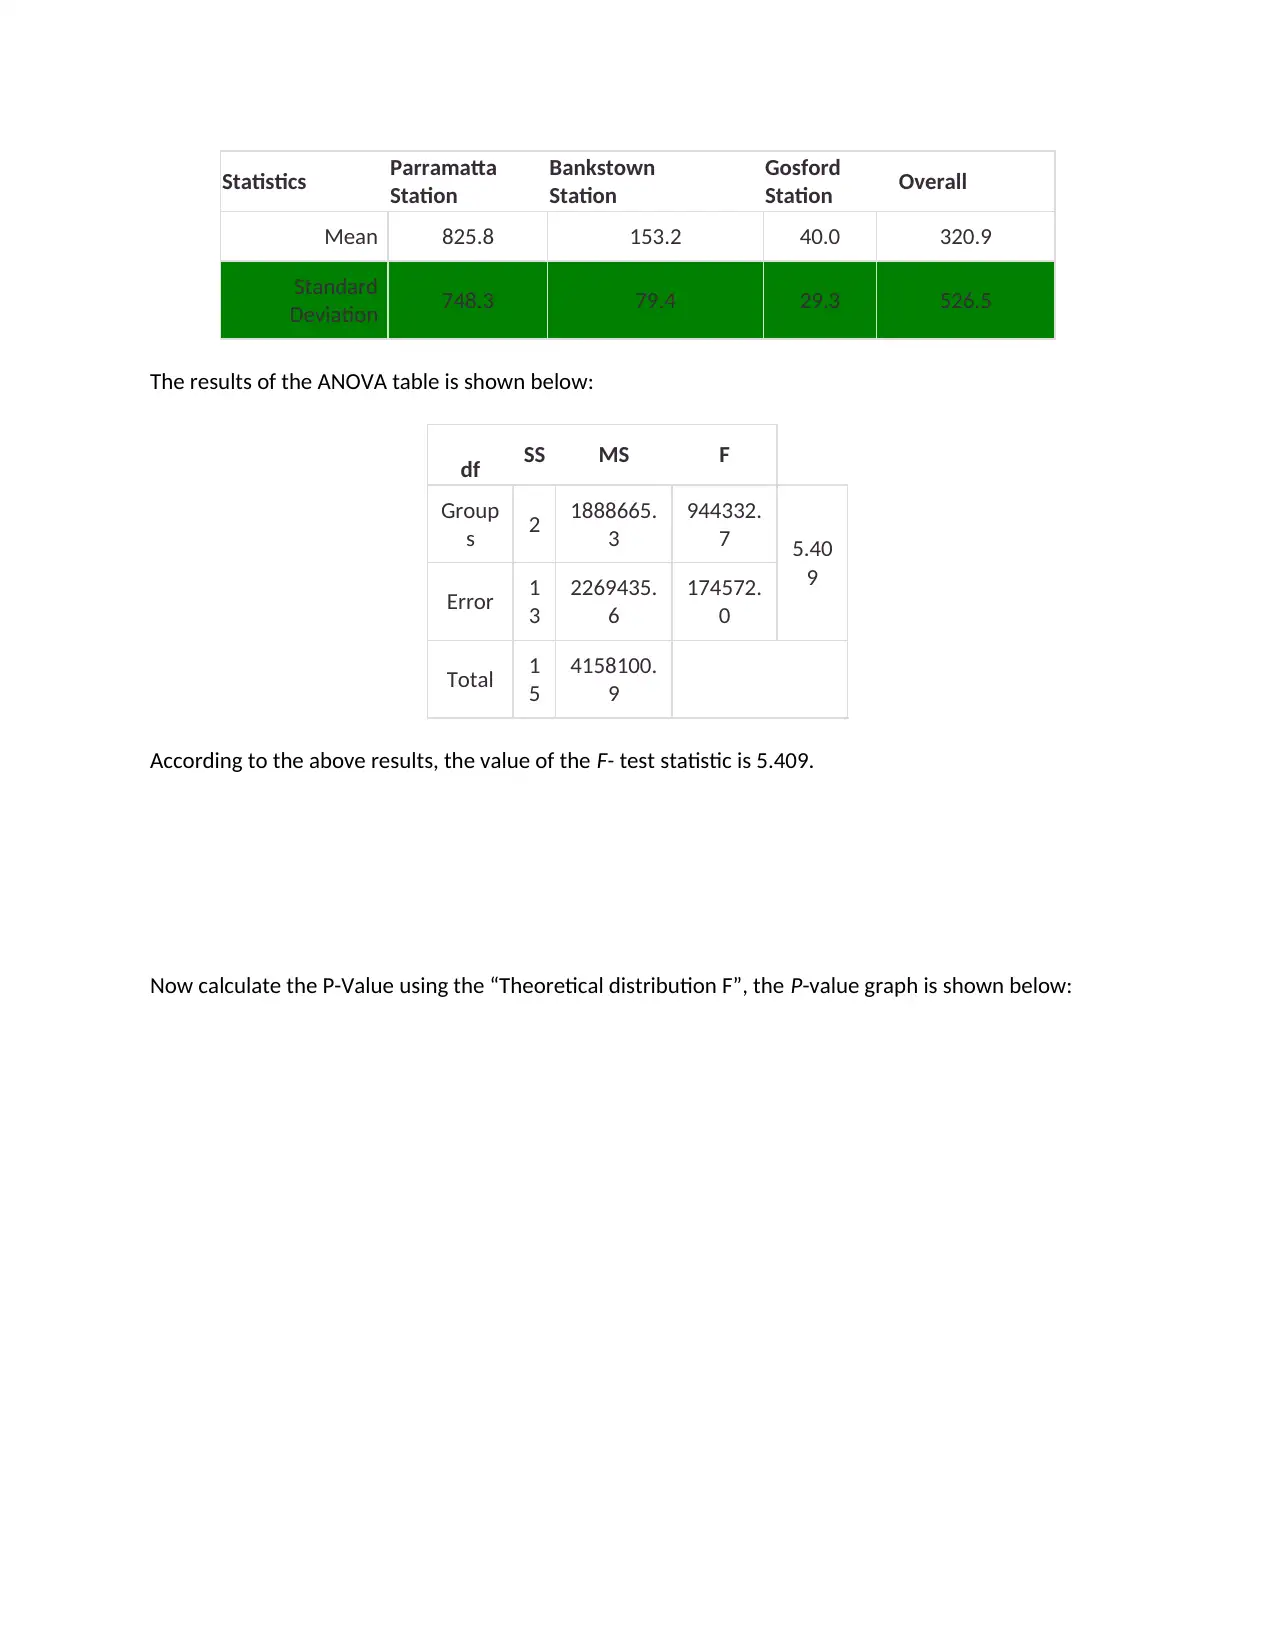
Mean 825.8 153.2 40.0 320.9
Standard
Deviation 748.3 79.4 29.3 526.5
The results of the ANOVA table is shown below:
df SS MS F
Group
s 2 1888665.
3
944332.
7 5.40
9
Error 1
3
2269435.
6
174572.
0
Total 1
5
4158100.
9
According to the above results, the value of the F- test statistic is 5.409.
Now calculate the P-Value using the “Theoretical distribution F”, the P-value graph is shown below:
Station
Bankstown
Station
Gosford
Station Overall
Mean 825.8 153.2 40.0 320.9
Standard
Deviation 748.3 79.4 29.3 526.5
The results of the ANOVA table is shown below:
df SS MS F
Group
s 2 1888665.
3
944332.
7 5.40
9
Error 1
3
2269435.
6
174572.
0
Total 1
5
4158100.
9
According to the above results, the value of the F- test statistic is 5.409.
Now calculate the P-Value using the “Theoretical distribution F”, the P-value graph is shown below:
Paraphrase This Document
Need a fresh take? Get an instant paraphrase of this document with our AI Paraphraser
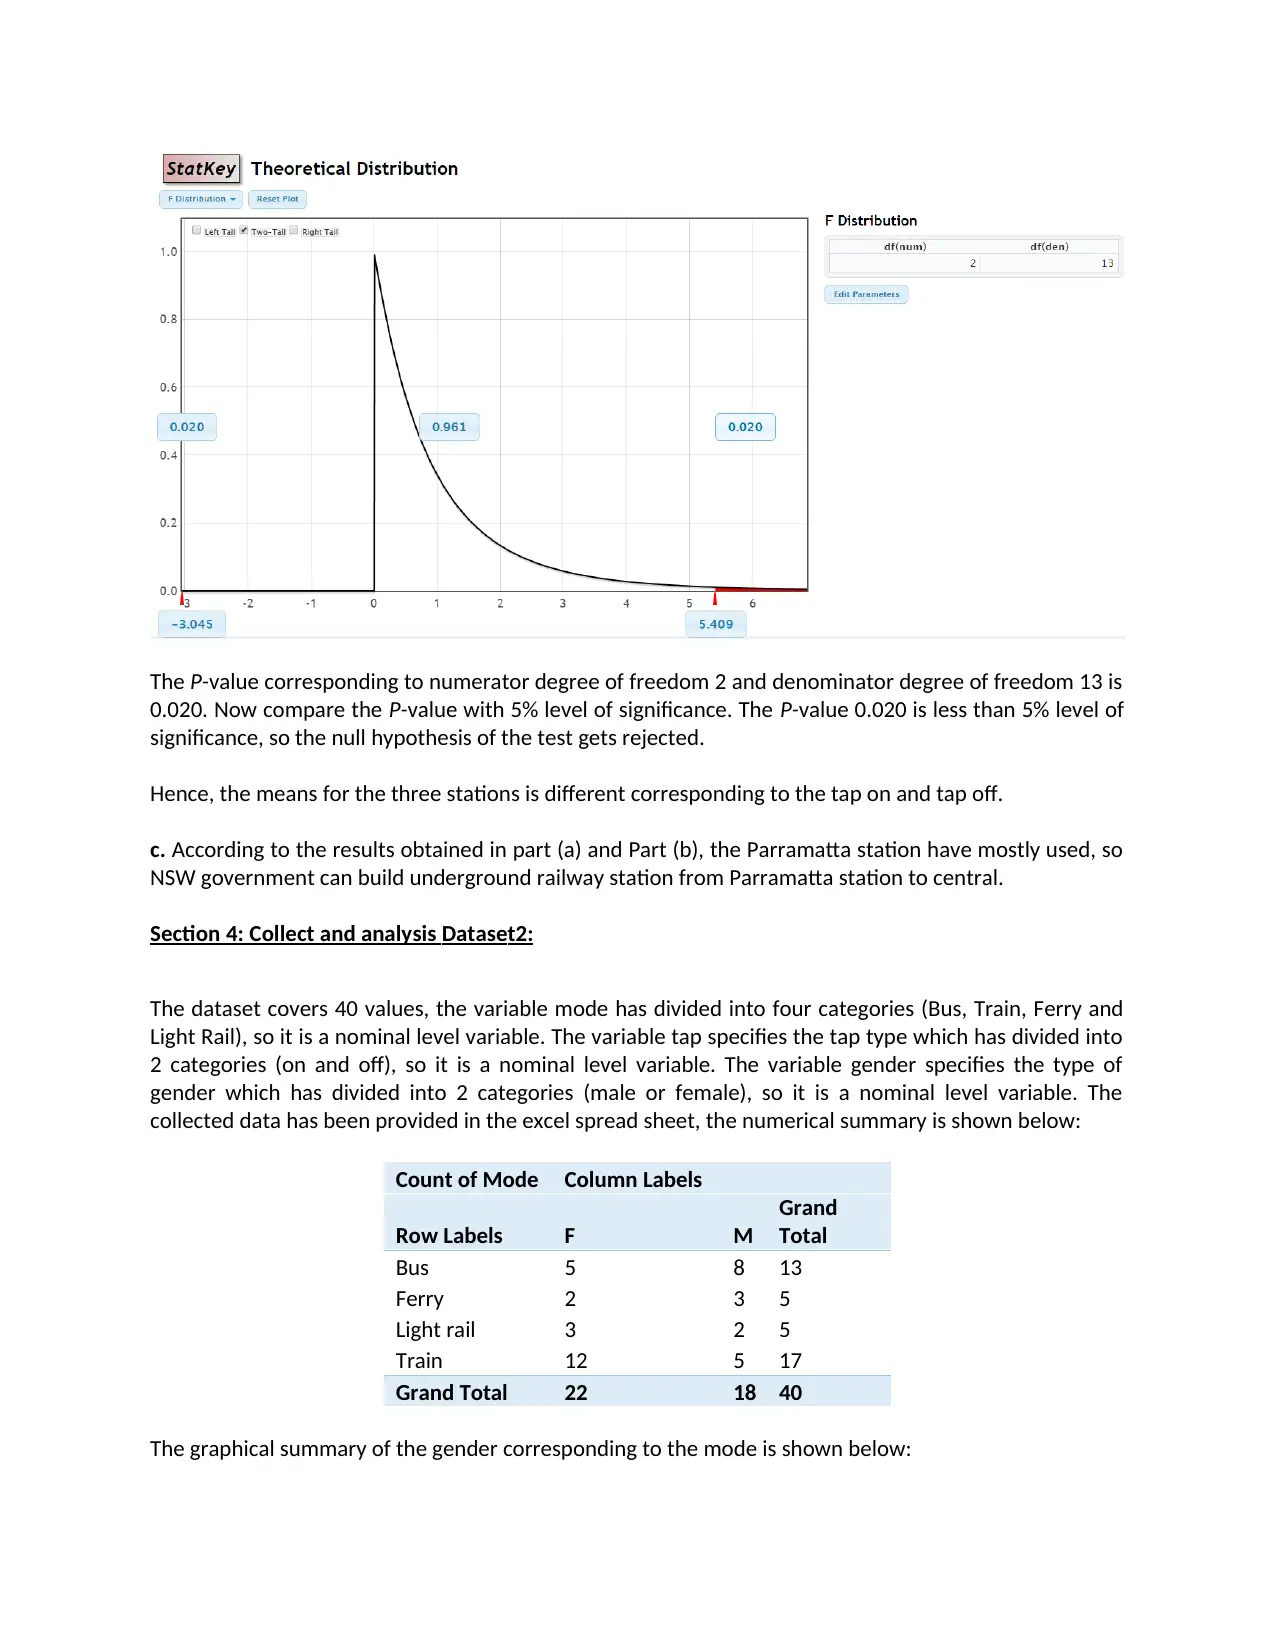
The P-value corresponding to numerator degree of freedom 2 and denominator degree of freedom 13 is
0.020. Now compare the P-value with 5% level of significance. The P-value 0.020 is less than 5% level of
significance, so the null hypothesis of the test gets rejected.
Hence, the means for the three stations is different corresponding to the tap on and tap off.
c. According to the results obtained in part (a) and Part (b), the Parramatta station have mostly used, so
NSW government can build underground railway station from Parramatta station to central.
Section 4: Collect and analysis Dataset2:
The dataset covers 40 values, the variable mode has divided into four categories (Bus, Train, Ferry and
Light Rail), so it is a nominal level variable. The variable tap specifies the tap type which has divided into
2 categories (on and off), so it is a nominal level variable. The variable gender specifies the type of
gender which has divided into 2 categories (male or female), so it is a nominal level variable. The
collected data has been provided in the excel spread sheet, the numerical summary is shown below:
Count of Mode Column Labels
Row Labels F M
Grand
Total
Bus 5 8 13
Ferry 2 3 5
Light rail 3 2 5
Train 12 5 17
Grand Total 22 18 40
The graphical summary of the gender corresponding to the mode is shown below:
Bus Ferry Light rail Train
0
2
4
6
8
10
12
14
Female
Male
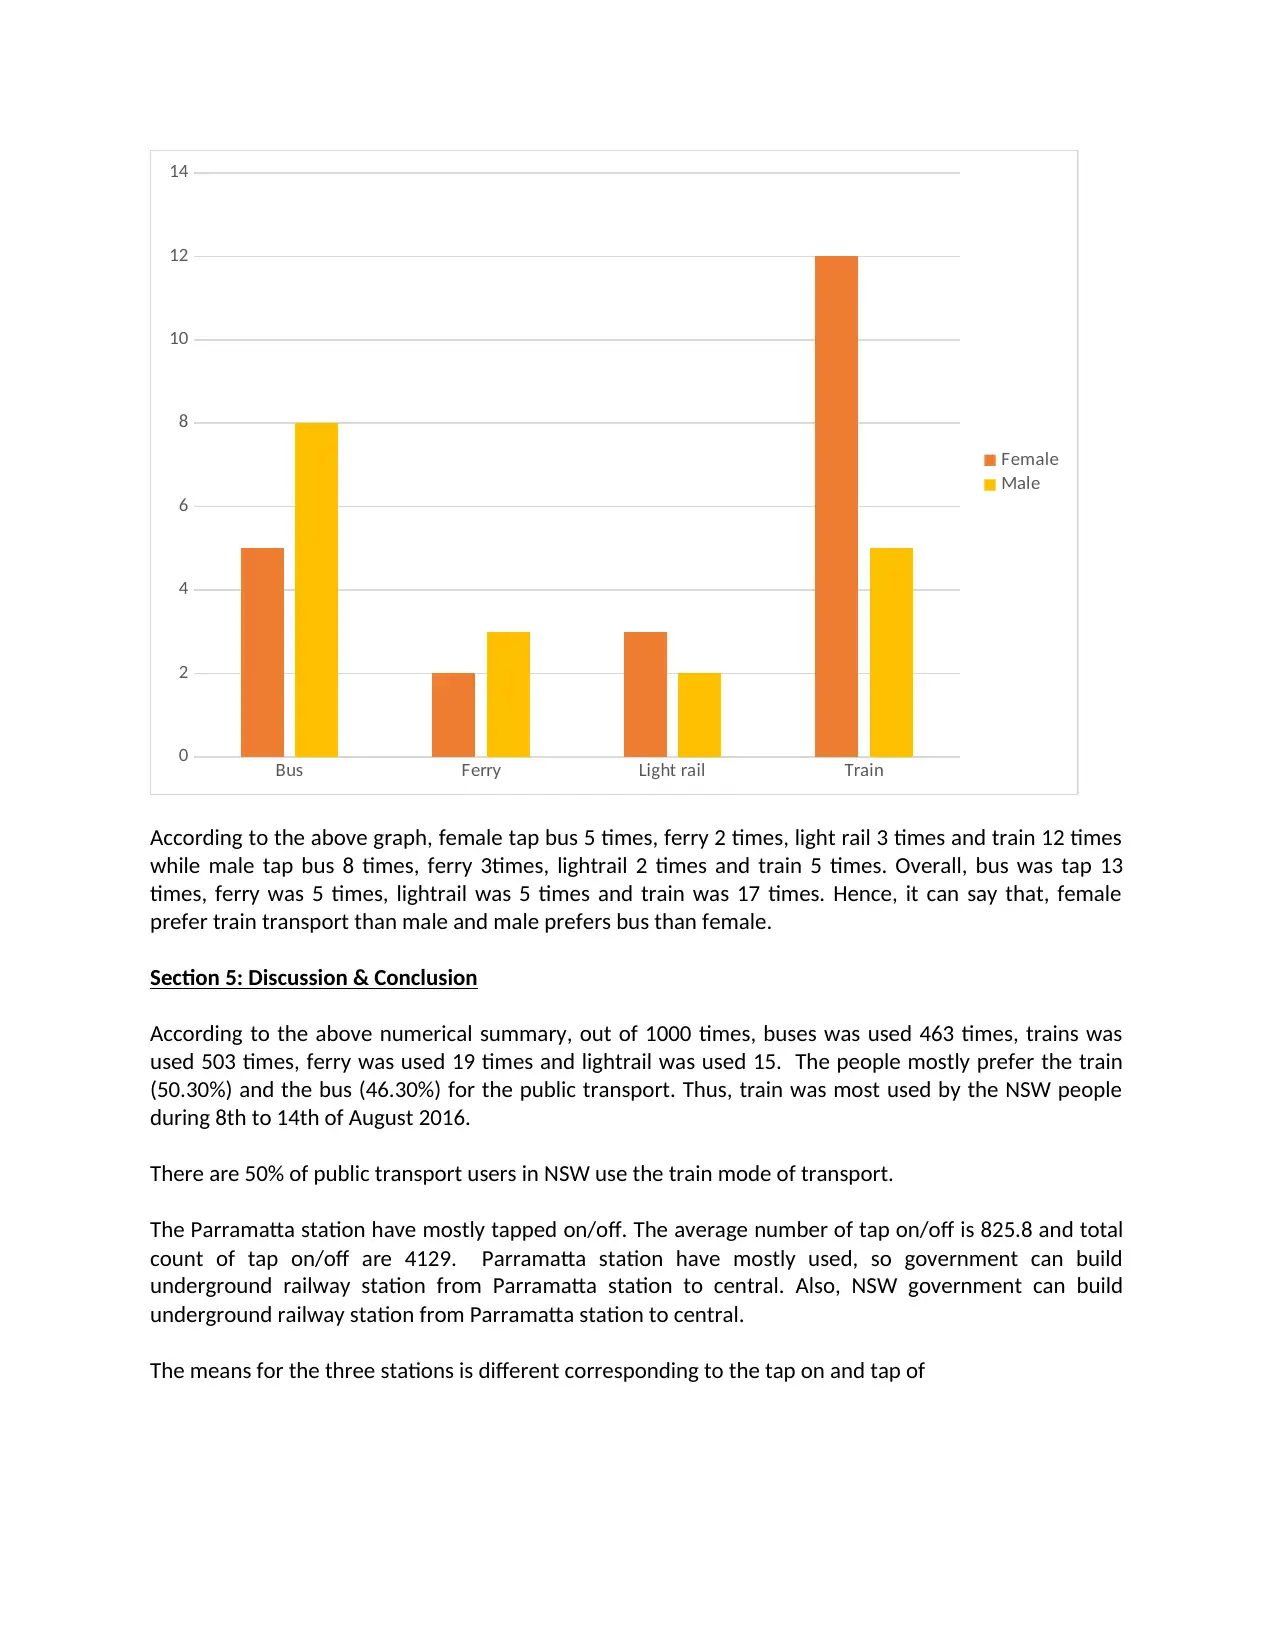
According to the above graph, female tap bus 5 times, ferry 2 times, light rail 3 times and train 12 times
while male tap bus 8 times, ferry 3times, lightrail 2 times and train 5 times. Overall, bus was tap 13
times, ferry was 5 times, lightrail was 5 times and train was 17 times. Hence, it can say that, female
prefer train transport than male and male prefers bus than female.
Section 5: Discussion & Conclusion
According to the above numerical summary, out of 1000 times, buses was used 463 times, trains was
used 503 times, ferry was used 19 times and lightrail was used 15. The people mostly prefer the train
(50.30%) and the bus (46.30%) for the public transport. Thus, train was most used by the NSW people
during 8th to 14th of August 2016.
There are 50% of public transport users in NSW use the train mode of transport.
The Parramatta station have mostly tapped on/off. The average number of tap on/off is 825.8 and total
count of tap on/off are 4129. Parramatta station have mostly used, so government can build
underground railway station from Parramatta station to central. Also, NSW government can build
underground railway station from Parramatta station to central.
The means for the three stations is different corresponding to the tap on and tap of
0
2
4
6
8
10
12
14
Female
Male
According to the above graph, female tap bus 5 times, ferry 2 times, light rail 3 times and train 12 times
while male tap bus 8 times, ferry 3times, lightrail 2 times and train 5 times. Overall, bus was tap 13
times, ferry was 5 times, lightrail was 5 times and train was 17 times. Hence, it can say that, female
prefer train transport than male and male prefers bus than female.
Section 5: Discussion & Conclusion
According to the above numerical summary, out of 1000 times, buses was used 463 times, trains was
used 503 times, ferry was used 19 times and lightrail was used 15. The people mostly prefer the train
(50.30%) and the bus (46.30%) for the public transport. Thus, train was most used by the NSW people
during 8th to 14th of August 2016.
There are 50% of public transport users in NSW use the train mode of transport.
The Parramatta station have mostly tapped on/off. The average number of tap on/off is 825.8 and total
count of tap on/off are 4129. Parramatta station have mostly used, so government can build
underground railway station from Parramatta station to central. Also, NSW government can build
underground railway station from Parramatta station to central.
The means for the three stations is different corresponding to the tap on and tap of
⊘ This is a preview!⊘
Do you want full access?
Subscribe today to unlock all pages.
Trusted by 1+ million students worldwide

References:
Goodwin, S. (2012) SAGE secondary data analysis. India: SAGE publications Pvt. Ltd.
Morgan, D. (2013) Integrating Qualitative and Quantitative methods: A Pragmatic Approach. India:
SAGE publications Pvt. Ltd.
Maxwell, R. and Riccardo, R. (2014). A Student's Guide to Analysis of Variance. Routledge.
Goodwin, S. (2012) SAGE secondary data analysis. India: SAGE publications Pvt. Ltd.
Morgan, D. (2013) Integrating Qualitative and Quantitative methods: A Pragmatic Approach. India:
SAGE publications Pvt. Ltd.
Maxwell, R. and Riccardo, R. (2014). A Student's Guide to Analysis of Variance. Routledge.
1 out of 10
Related Documents


Your All-in-One AI-Powered Toolkit for Academic Success.
+13062052269
info@desklib.com
Available 24*7 on WhatsApp / Email
![[object Object]](/_next/static/media/star-bottom.7253800d.svg)
Unlock your academic potential
Copyright © 2020–2026 A2Z Services. All Rights Reserved. Developed and managed by ZUCOL.