Comparative Study: Public Transport in Indooroophilly and Carindale
VerifiedAdded on 2020/05/11
|12
|1834
|53
Report
AI Summary
This report provides a comparative analysis of public transport systems in the Brisbane suburbs of Indooroophilly and Carindale. It examines the existing public transport infrastructure, including bus services, and utilizes SEQHTS data to assess passenger travel behavior and patterns. The study incorporates various observation methods, such as structured observation, to analyze passenger activities and travel times. It also discusses the challenges associated with data collection, particularly during peak hours, and the limitations of observational methods in capturing passenger motivations and attitudes. Furthermore, the report evaluates bus priority treatments and their impact on overall travel time, considering factors such as vehicle volume and occupancy. The analysis includes a table presenting travel behavior patterns and graphical representations of the public transport networks in both suburbs. The report concludes with a discussion of the strengths and weaknesses of different observation methods and offers insights into the efficiency and effectiveness of the public transport systems in Indooroophilly and Carindale.
Public transport:
We will compare two suburb, Indooroophilly and Carindale.
Research activities
Indooroophilly valley can be highly ascertained as it well facilitated with an immense public
transport .The place is facilitated with buses that make numerous and fast trips from UQ St
Lucia. The place is also enhanced with public transport buses that make trips even during night
hours. Carindale is one of the largest center in Queensland. It is located in the eastern side of
Brisbane. The town has more than 450 story and is enhanced with numerous parking spaces.
Carindale center has numerous bus stations that provides public transport to the university
student around the Center (Kusakabe, 2016). A proposed Carindale busway station on the
eastern side of the Centre will not only enhance sufficient public transport to the people within
the adjacent town Centre but will enhance an efficient public transport.
The population is also expected to increase in south-east Queensland coastal communities and
regional centers. Carindale has a wide diverse population that can be highly ascertained to have
contributed to the more accommodation of public transport. This has actually resulted to various
challenges, increased lengths of road per capita and high transport (Lazzarini, 2016). The state
age population is also ageing and thus there should be an integrated approach that should be
established so as to manage the impact of population growth. This result in harnessed
opportunities and mitigation of associated risks that include increased congestion.
Paraphrase This Document
Need a fresh take? Get an instant paraphrase of this document with our AI Paraphraser

Young adults have incorporated the enormous trend of travelling frequently by means of public
shuttle bus. This has resulted to reduced overall travel cost. Tourism is expanding at an alarming
rate in Queensland (Hajkowicz, 2013). Production of minerals and other commodities have also
increased the overall demand of public transport in Carindale Centre. In order to address so of
the key challenges in the sector it’s important to make some balanced choices across the
conflicting and competing options with the provided funding.
Direct observation of human behavior can be used in many disciplines. Ethnographic
observation, qualitative method is among the methods that can immensely conduct a public
transport passenger studies. Incorporating a structured observation can also enhance the research
method in the public transport sector.
In order to design a structured observation it’s important to ensure that you arise to some
decisions. They include sampling which categories the type of passengers to observe, modes of
transport for example public shuttle bus or passenger trains, time of the day that most people
travel for example early in the morning and during evening, week and season to conduct the
research observation (McArthur, 2017). A structured observation also categorizes the behaviors
and factors to consider in the observation. Last but not the least the analysis and reporting is
enhanced.
The paper below compares and critique the research conducted through observation so as to
enhance a passengers travel time activities. There exist some challenges that exist during data
collection. For instance observation passengers on a long train may be easy but observing the
crowded and intense activity during the rush-hour makes it difficult for appropriate
methodological data collection. There exist some underlying issues in the structured observation
study in the public transport. It only answers questions that include the manifestation behavior
while on the other hand it doesn’t accommodate other questions that incorporate motivations,
feelings and altitudes which can only be facilitated by non- observational research methods. A
structured observation field does not only enhance an extensive data, but also enhances
background information that can ensure that researchers obtain day to day experiences of
passengers. This research work investigates the behavioral patterns of public transport
passengers in two suburbs, Indooroophilly and Carindale. The research work has incorporated
the use of SEQTS data for Indooroophilly and Carindale for purposes of assessment.
Ways of observing passengers.
Various observation methods can be incorporated when it comes to observing public transport
passengers. This method is inefficient when it comes to the interpretation of data. Various types
of observation methods can be accommodated in the public sector. They include participant,
non- participant, unstructured, simple and contrived observation (Narbón-Perpiñá, 2017).
Structured observation can also be accommodated. Participant observation involves the use of
qualitative methods where the researcher is immersed over time in an attempt to understand the
behavioral patterns ideas and patterns.
Ethnographic observation studies in the public transport
This method involves a detailed observation, and also focuses on behavior in a specific setting.
For instance there exist different kind of behaviors and relationship when comparing the old-
timer and drivers in instances of working out the timetable and timing the bus.
Structured observation
⊘ This is a preview!⊘
Do you want full access?
Subscribe today to unlock all pages.
Trusted by 1+ million students worldwide
This can be used to study and assess the public transport passenger safety behavior and risk.
Research conducted using the sequential mixed method design and used different methods and
phases of data collection (Doohan, 2017). In the first phase, observation of 812 passengers was
facilitated. The second face comprised of qualitative interviews with about 48 passengers
whereas the last phase was a self- completion survey of over a thousand passengers.
Structured observation method in the public transport research is mostly employed because of
various reasons:
It is an unobtrusive method that accommodates some ethical issues.
It takes place in a natural setting in such a way that other passengers are not aware that
they are been observed. This method can be highly ascertained as it can yield a
considerable amount of quantitative data over a short time. It also provide an immense
familiarization with the transport sector as the researcher is able to get to the field
observation of behaviors are conducted in a methodical way.
It provides snapshots of behavior as it can provide a longitudinal data about passengers
on a trip.
There exist some weaknesses during incorporation of the structured method of
observation. The method only provides information that is based upon the passenger
behavior and usually ignores the customer experiences, feelings, attitudes, reasons and
preferences (Camacho, 2017). The researchers also lack the necessary capacity to control
the passengers.
The table below will show the selected passenger activity of
Evaluation of Bus Priority Treatments
Paraphrase This Document
Need a fresh take? Get an instant paraphrase of this document with our AI Paraphraser
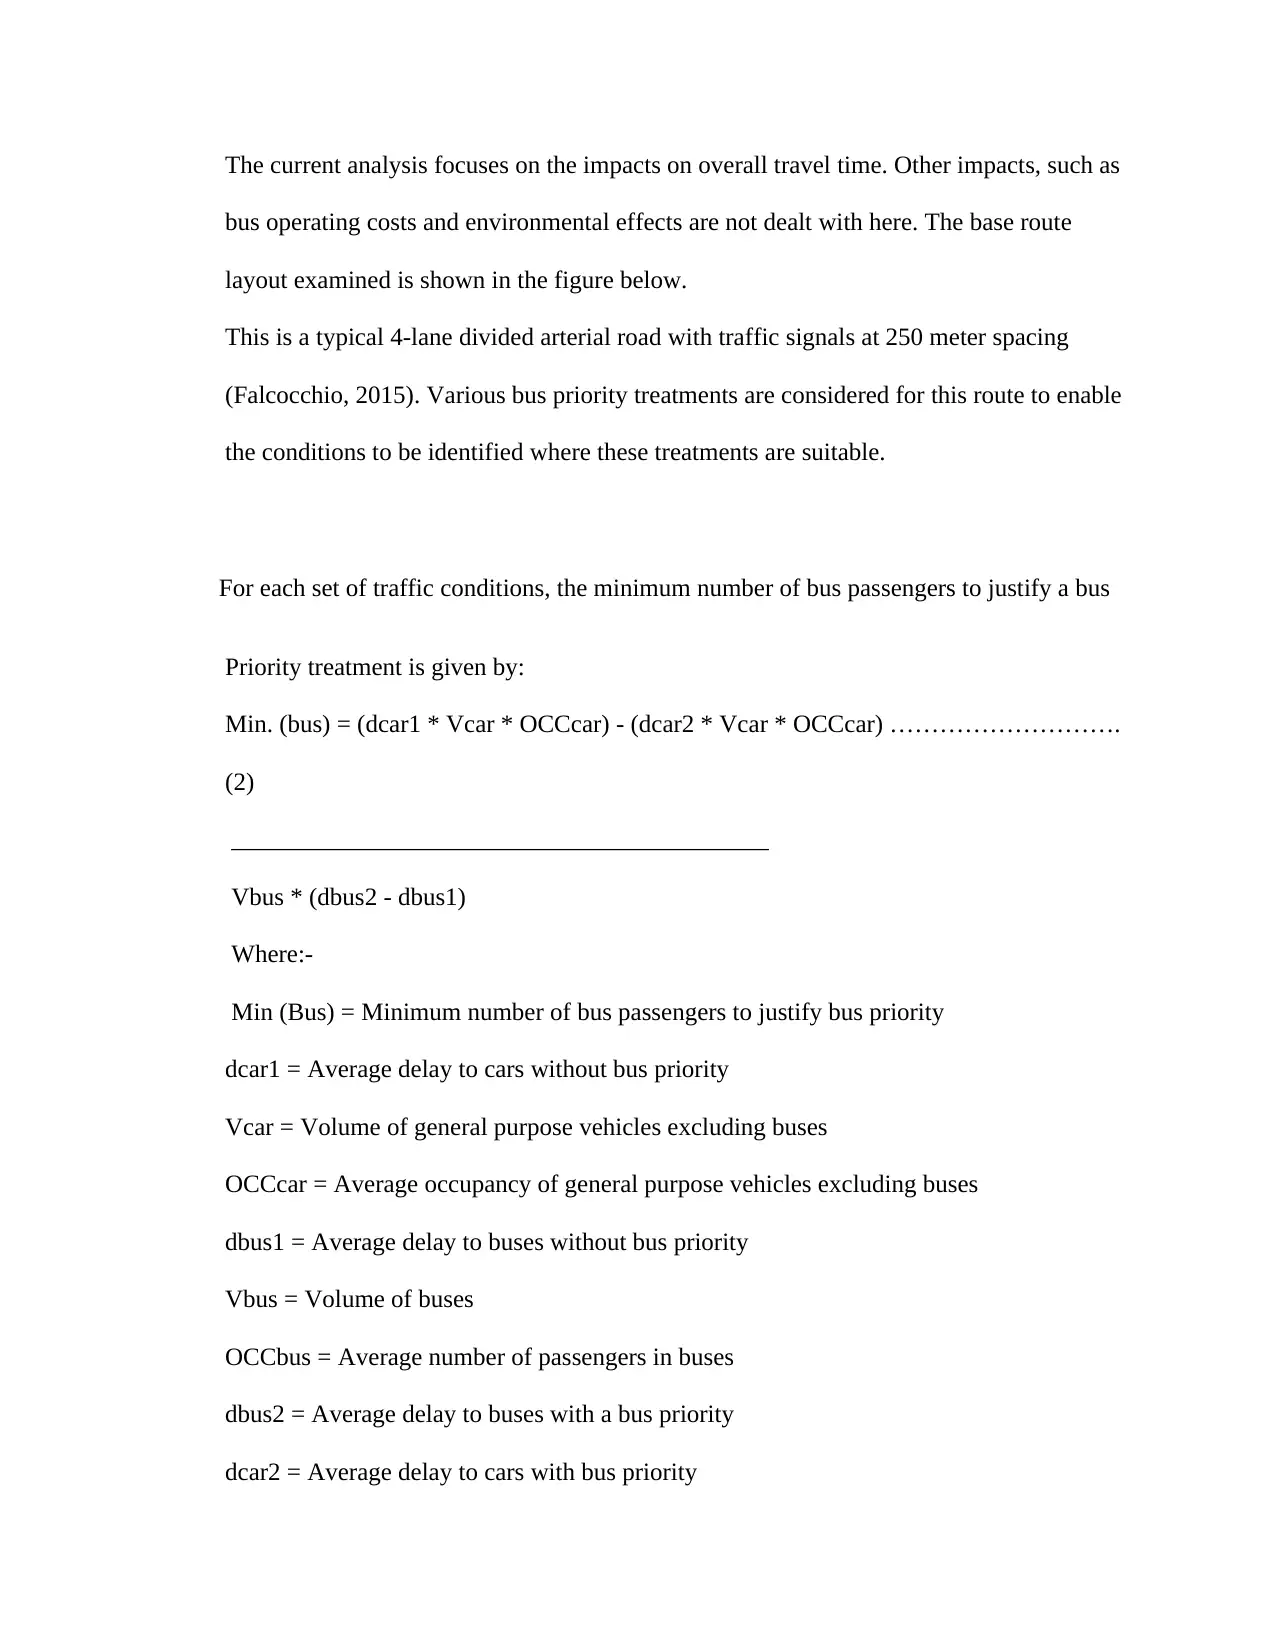
The current analysis focuses on the impacts on overall travel time. Other impacts, such as
bus operating costs and environmental effects are not dealt with here. The base route
layout examined is shown in the figure below.
This is a typical 4-lane divided arterial road with traffic signals at 250 meter spacing
(Falcocchio, 2015). Various bus priority treatments are considered for this route to enable
the conditions to be identified where these treatments are suitable.
For each set of traffic conditions, the minimum number of bus passengers to justify a bus
Priority treatment is given by:
Min. (bus) = (dcar1 * Vcar * OCCcar) - (dcar2 * Vcar * OCCcar) ……………………….
(2)
___________________________________________
Vbus * (dbus2 - dbus1)
Where:-
Min (Bus) = Minimum number of bus passengers to justify bus priority
dcar1 = Average delay to cars without bus priority
Vcar = Volume of general purpose vehicles excluding buses
OCCcar = Average occupancy of general purpose vehicles excluding buses
dbus1 = Average delay to buses without bus priority
Vbus = Volume of buses
OCCbus = Average number of passengers in buses
dbus2 = Average delay to buses with a bus priority
dcar2 = Average delay to cars with bus priority

The table presents the travel behavior pattern of Indooroophilly CBD, QLD 4000
and Carindale QLD 4034. SEQHTS data have been used to enhance the data
assessment for Brisbane in attachment (Brisbane_SEQHTS_09_12.sav).
and Carindale QLD 4034. SEQHTS data have been used to enhance the data
assessment for Brisbane in attachment (Brisbane_SEQHTS_09_12.sav).
⊘ This is a preview!⊘
Do you want full access?
Subscribe today to unlock all pages.
Trusted by 1+ million students worldwide
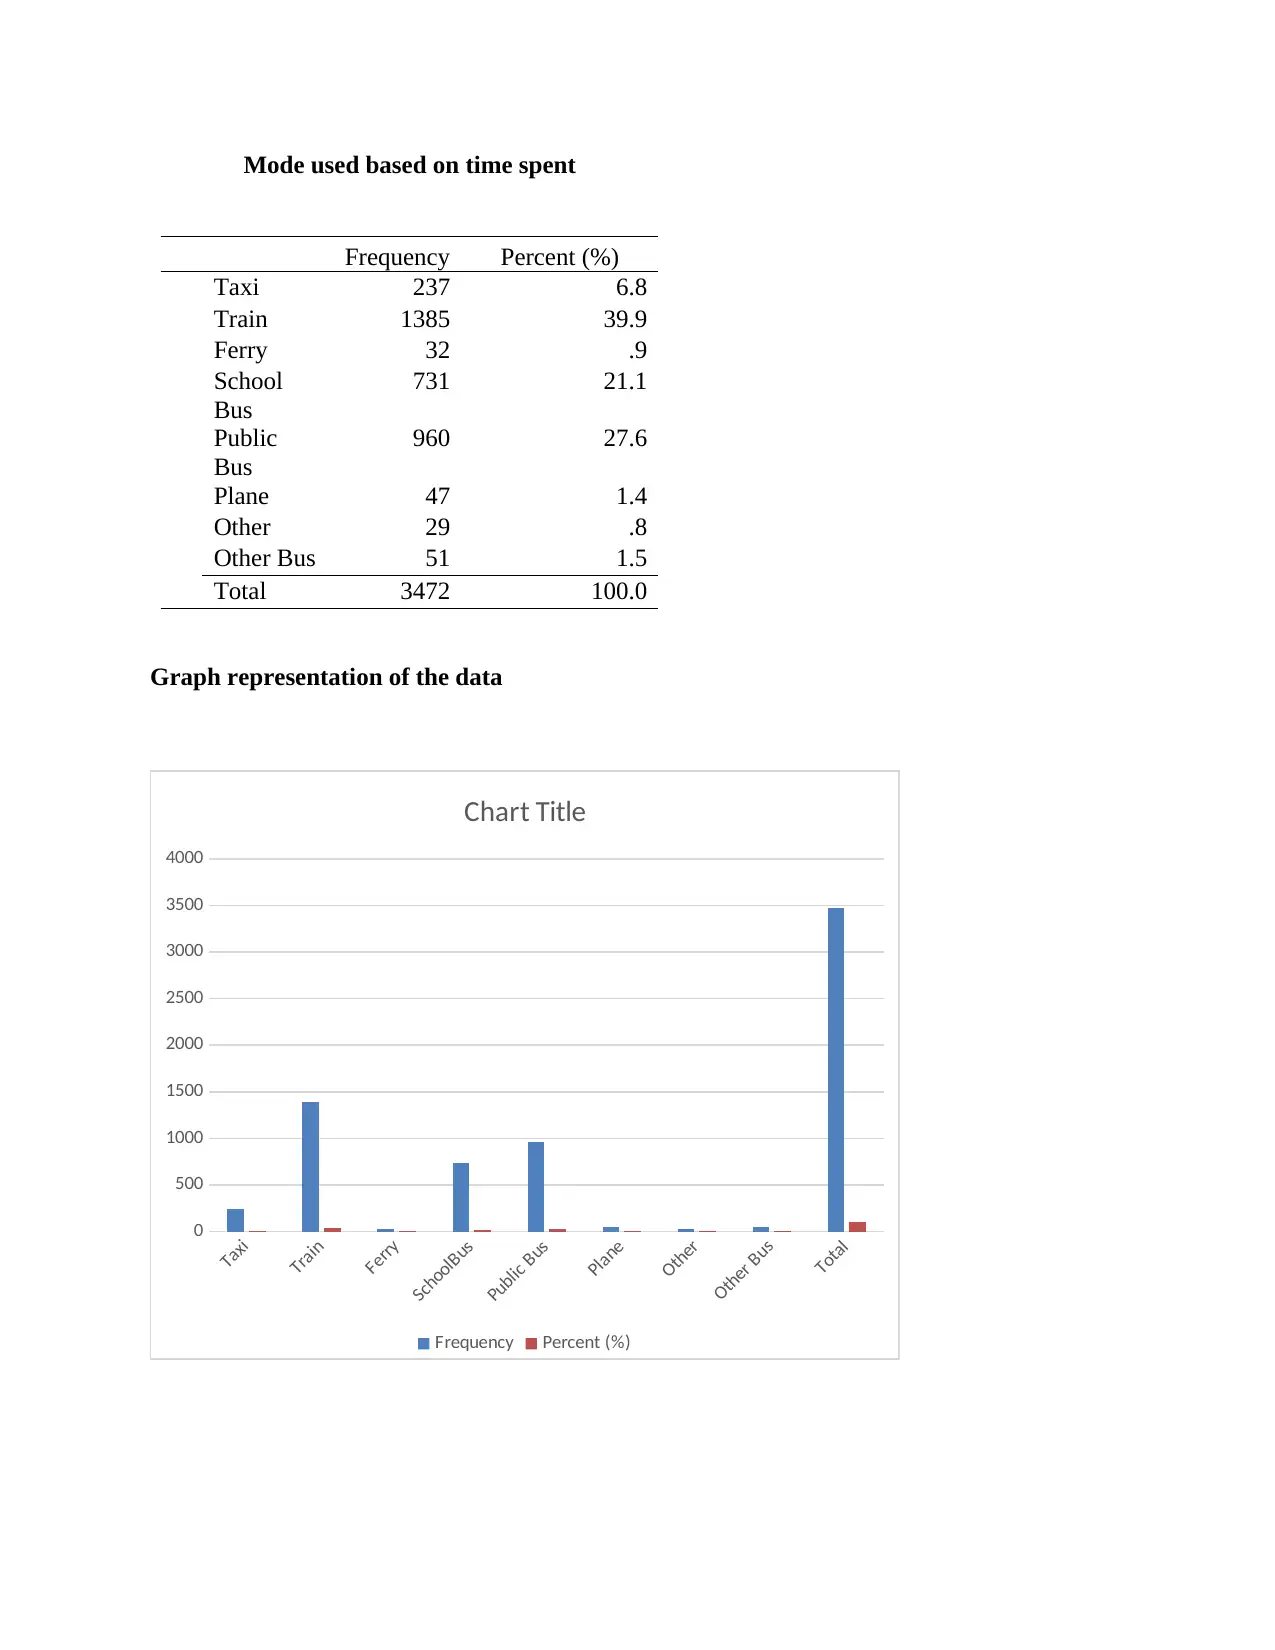
Mode used based on time spent
Frequency Percent (%)
Taxi 237 6.8
Train 1385 39.9
Ferry 32 .9
School
Bus
731 21.1
Public
Bus
960 27.6
Plane 47 1.4
Other 29 .8
Other Bus 51 1.5
Total 3472 100.0
Graph representation of the data
Taxi
Train
Ferry
SchoolBus
Public Bus
Plane
Other
Other Bus
Total
0
500
1000
1500
2000
2500
3000
3500
4000
Chart Title
Frequency Percent (%)
Frequency Percent (%)
Taxi 237 6.8
Train 1385 39.9
Ferry 32 .9
School
Bus
731 21.1
Public
Bus
960 27.6
Plane 47 1.4
Other 29 .8
Other Bus 51 1.5
Total 3472 100.0
Graph representation of the data
Taxi
Train
Ferry
SchoolBus
Public Bus
Plane
Other
Other Bus
Total
0
500
1000
1500
2000
2500
3000
3500
4000
Chart Title
Frequency Percent (%)
Paraphrase This Document
Need a fresh take? Get an instant paraphrase of this document with our AI Paraphraser
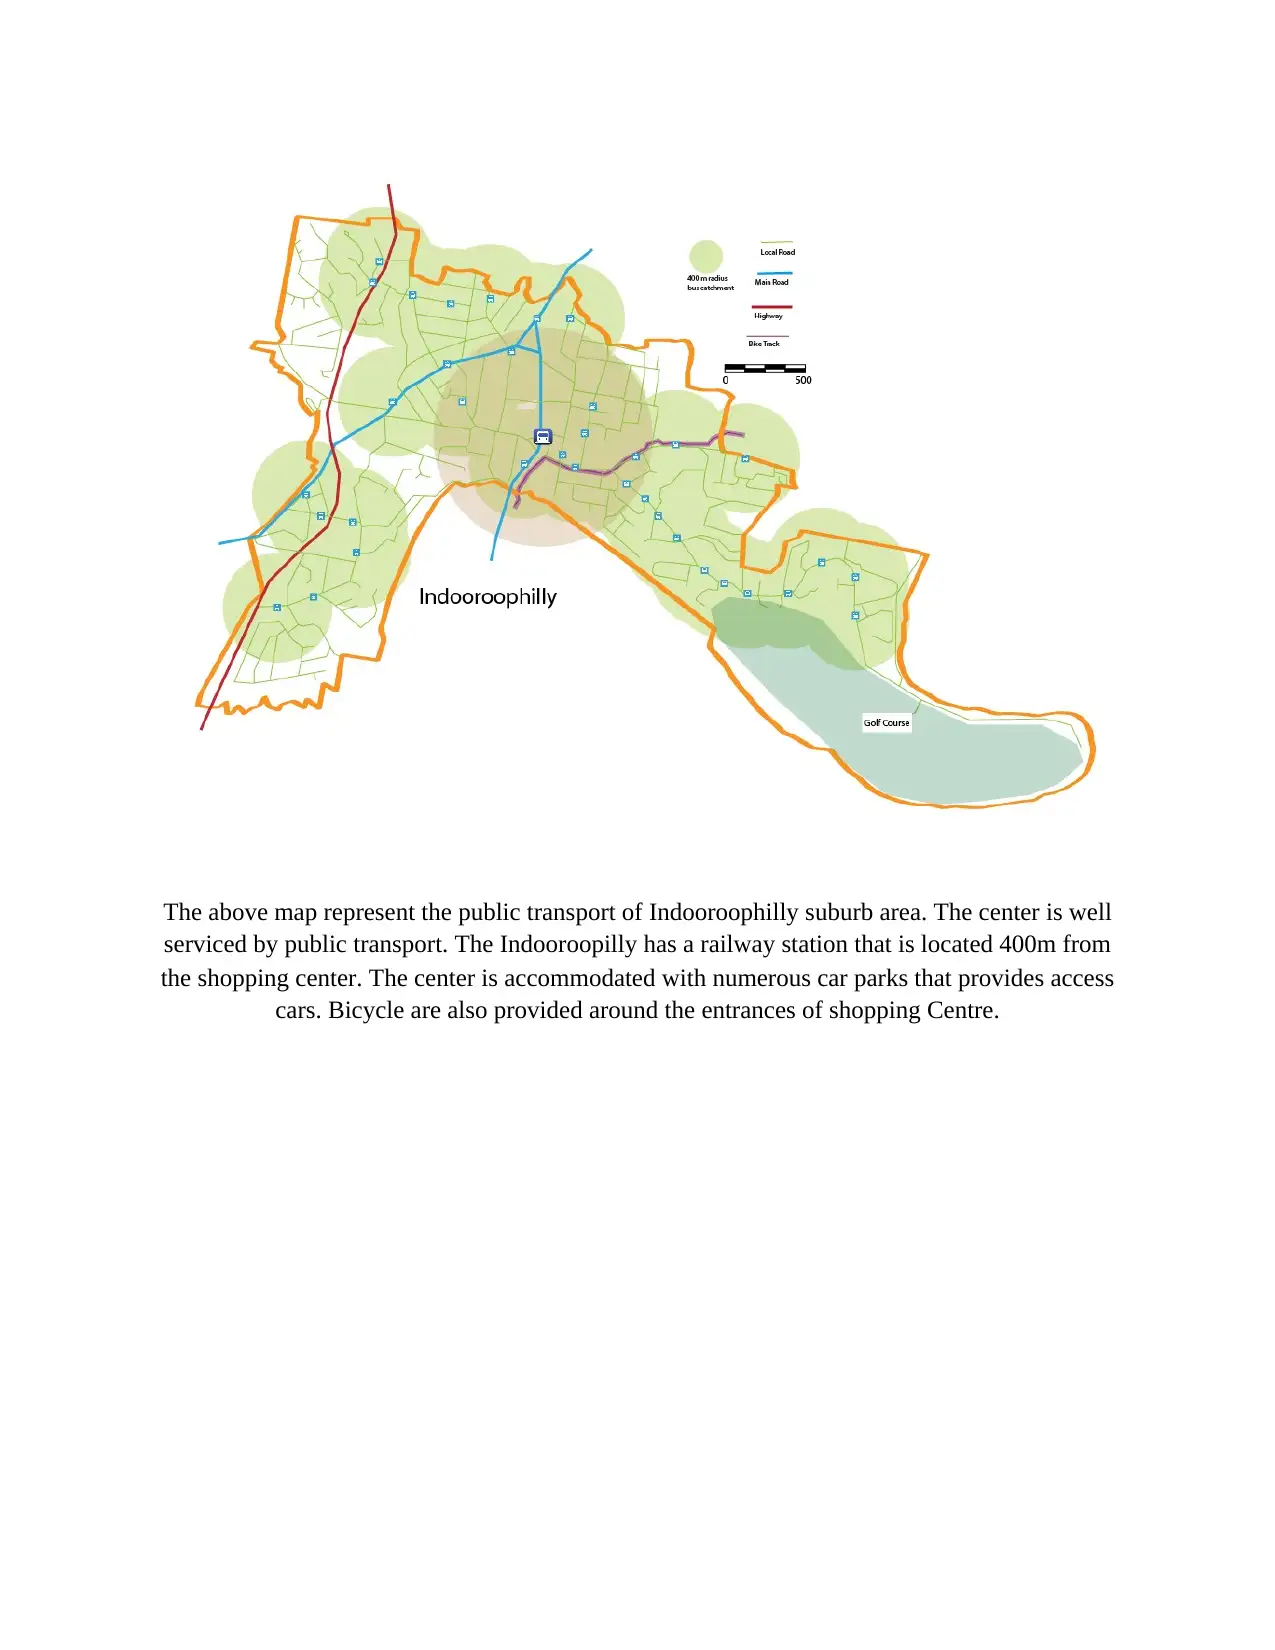
The above map represent the public transport of Indooroophilly suburb area. The center is well
serviced by public transport. The Indooroopilly has a railway station that is located 400m from
the shopping center. The center is accommodated with numerous car parks that provides access
cars. Bicycle are also provided around the entrances of shopping Centre.
serviced by public transport. The Indooroopilly has a railway station that is located 400m from
the shopping center. The center is accommodated with numerous car parks that provides access
cars. Bicycle are also provided around the entrances of shopping Centre.
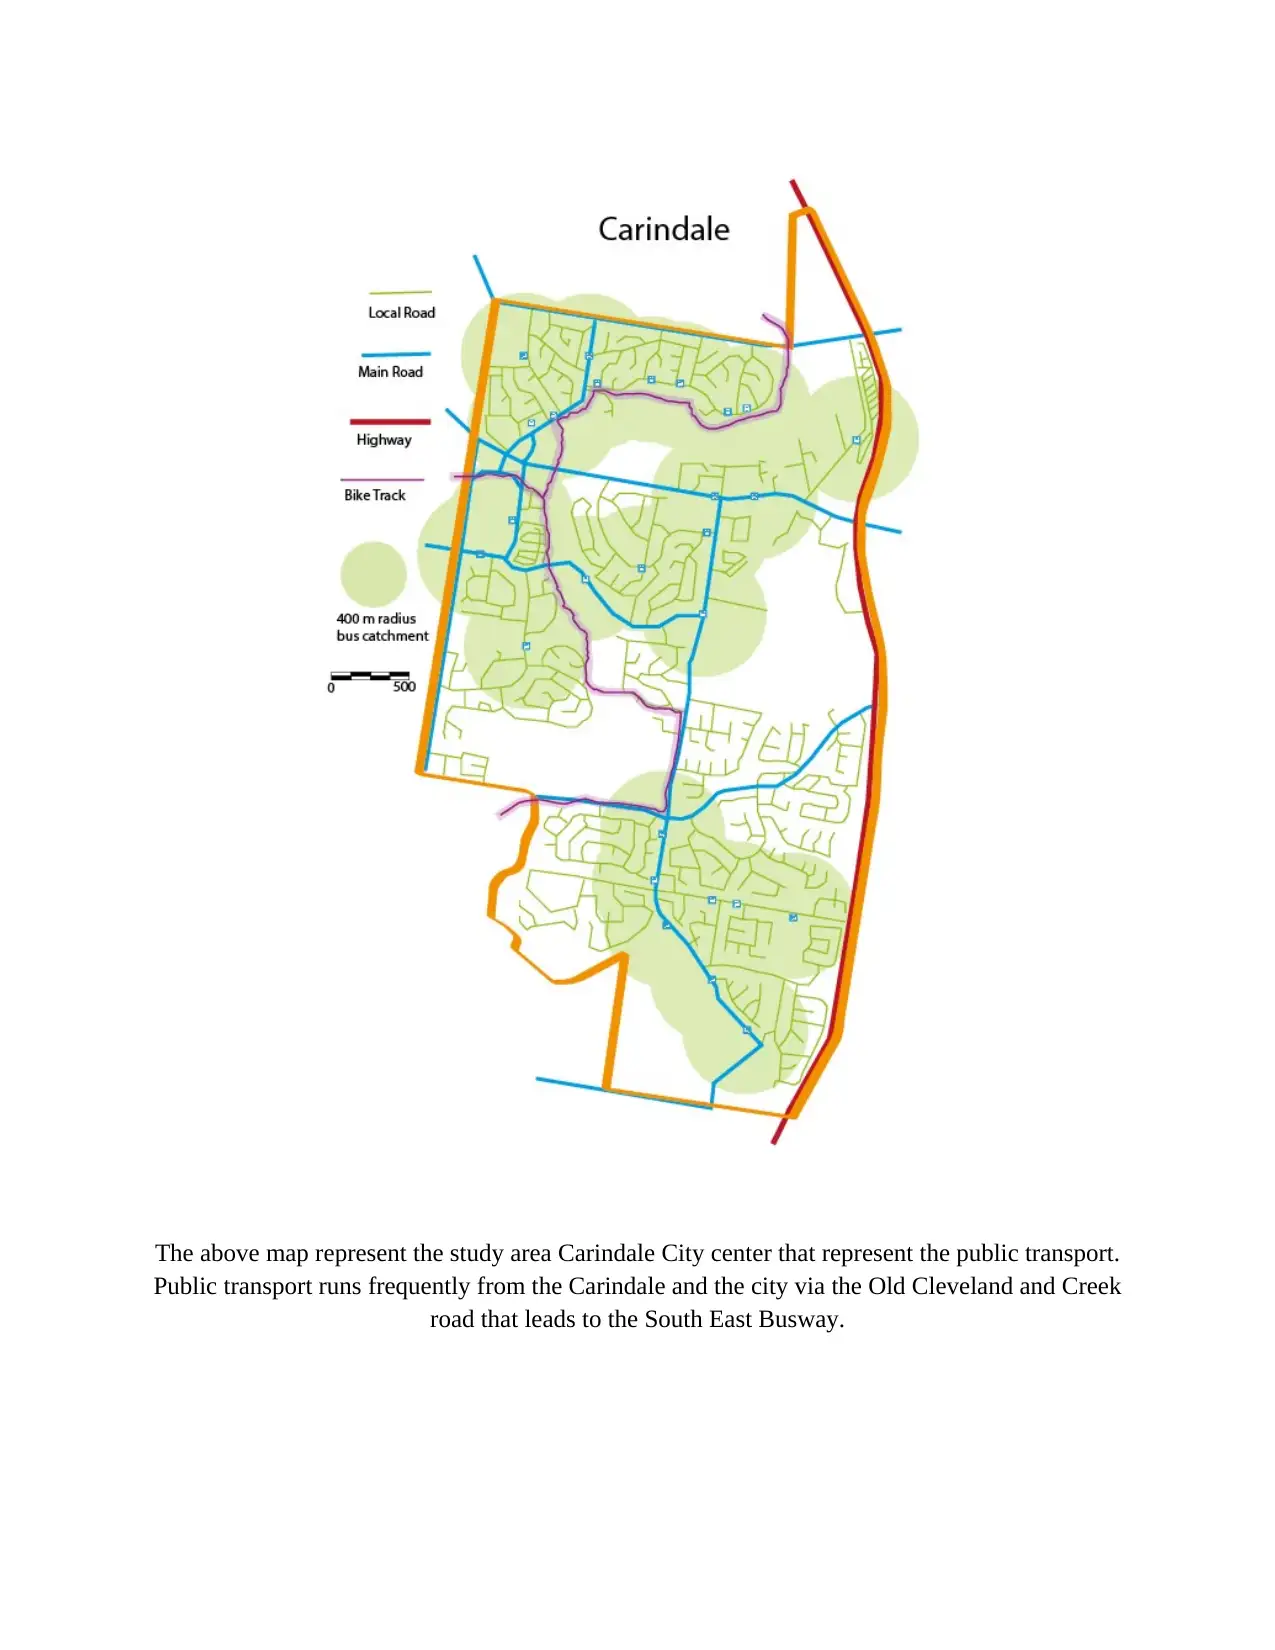
The above map represent the study area Carindale City center that represent the public transport.
Public transport runs frequently from the Carindale and the city via the Old Cleveland and Creek
road that leads to the South East Busway.
Public transport runs frequently from the Carindale and the city via the Old Cleveland and Creek
road that leads to the South East Busway.
⊘ This is a preview!⊘
Do you want full access?
Subscribe today to unlock all pages.
Trusted by 1+ million students worldwide
References
Camacho, T., Foth, M., Rakotonirainy, A., & Rittenbruch, M. (2017). Understanding urban rail
in-vehicle activities: an activity theory approach. Transportation research part F: traffic
psychology and behaviour, 46, 70-86.
Doohan, I., Björnstig, U., Östlund, U., & Saveman, B. I. (2017). Exploring injury panorama,
consequences, and recovery among bus crash survivors: a mixed-methods research study.
Prehospital and disaster medicine, 32(2), 165-174.
Falcocchio, J. C., & Levinson, H. S. (2015). Adaptation Strategies for Managing Recurring
Congestion—Operational Improvements. In Road Traffic Congestion: A Concise Guide
(pp. 213-244). Springer International Publishing.
Hajkowicz, S., Cook, H., & Boughen, N. (2013). The Future of Tourism in Queensland:
Megatrends Creating Opportunities and Challenges over the Coming Twenty Years.
Australia: CSIRO.
Kusakabe, T., Tsubota, T., & Bhaskar, A. (2016). Validation Study of Naïve Bayes Probabilistic
Model for Transit Passengers’ Trip Purpose Estimation: Case Study Exploiting Detailed
Brisbane Household Travel Survey Data. In Transportation Research Board 95th Annual
Meeting (No. 16-2539).
Lazzarini, S. J. (2016). Development stages of a road management strategy suitable to the
Burdekin shire.
McArthur, J., Zerjav, V., & Edkins, A. (2017). Strategic Value Creation in Infrastructure
Projects: Decision-Makers’ Perspectives on Urban Transportation Developments.
Narbón-Perpiñá, I., Balaguer-Coll, M., & Tortosa-Ausina, E. (2017). Evaluating local
government performance in times of crisis (No. 2017/05).
Paraphrase This Document
Need a fresh take? Get an instant paraphrase of this document with our AI Paraphraser


⊘ This is a preview!⊘
Do you want full access?
Subscribe today to unlock all pages.
Trusted by 1+ million students worldwide
1 out of 12
Your All-in-One AI-Powered Toolkit for Academic Success.
+13062052269
info@desklib.com
Available 24*7 on WhatsApp / Email
![[object Object]](/_next/static/media/star-bottom.7253800d.svg)
Unlock your academic potential
Copyright © 2020–2026 A2Z Services. All Rights Reserved. Developed and managed by ZUCOL.