PUH 5302, Applied Biostatistics Unit III Problem Solving Assignment

Verified

Added on  2022/11/29

|3
|966
|468
Homework Assignment
AI Summary
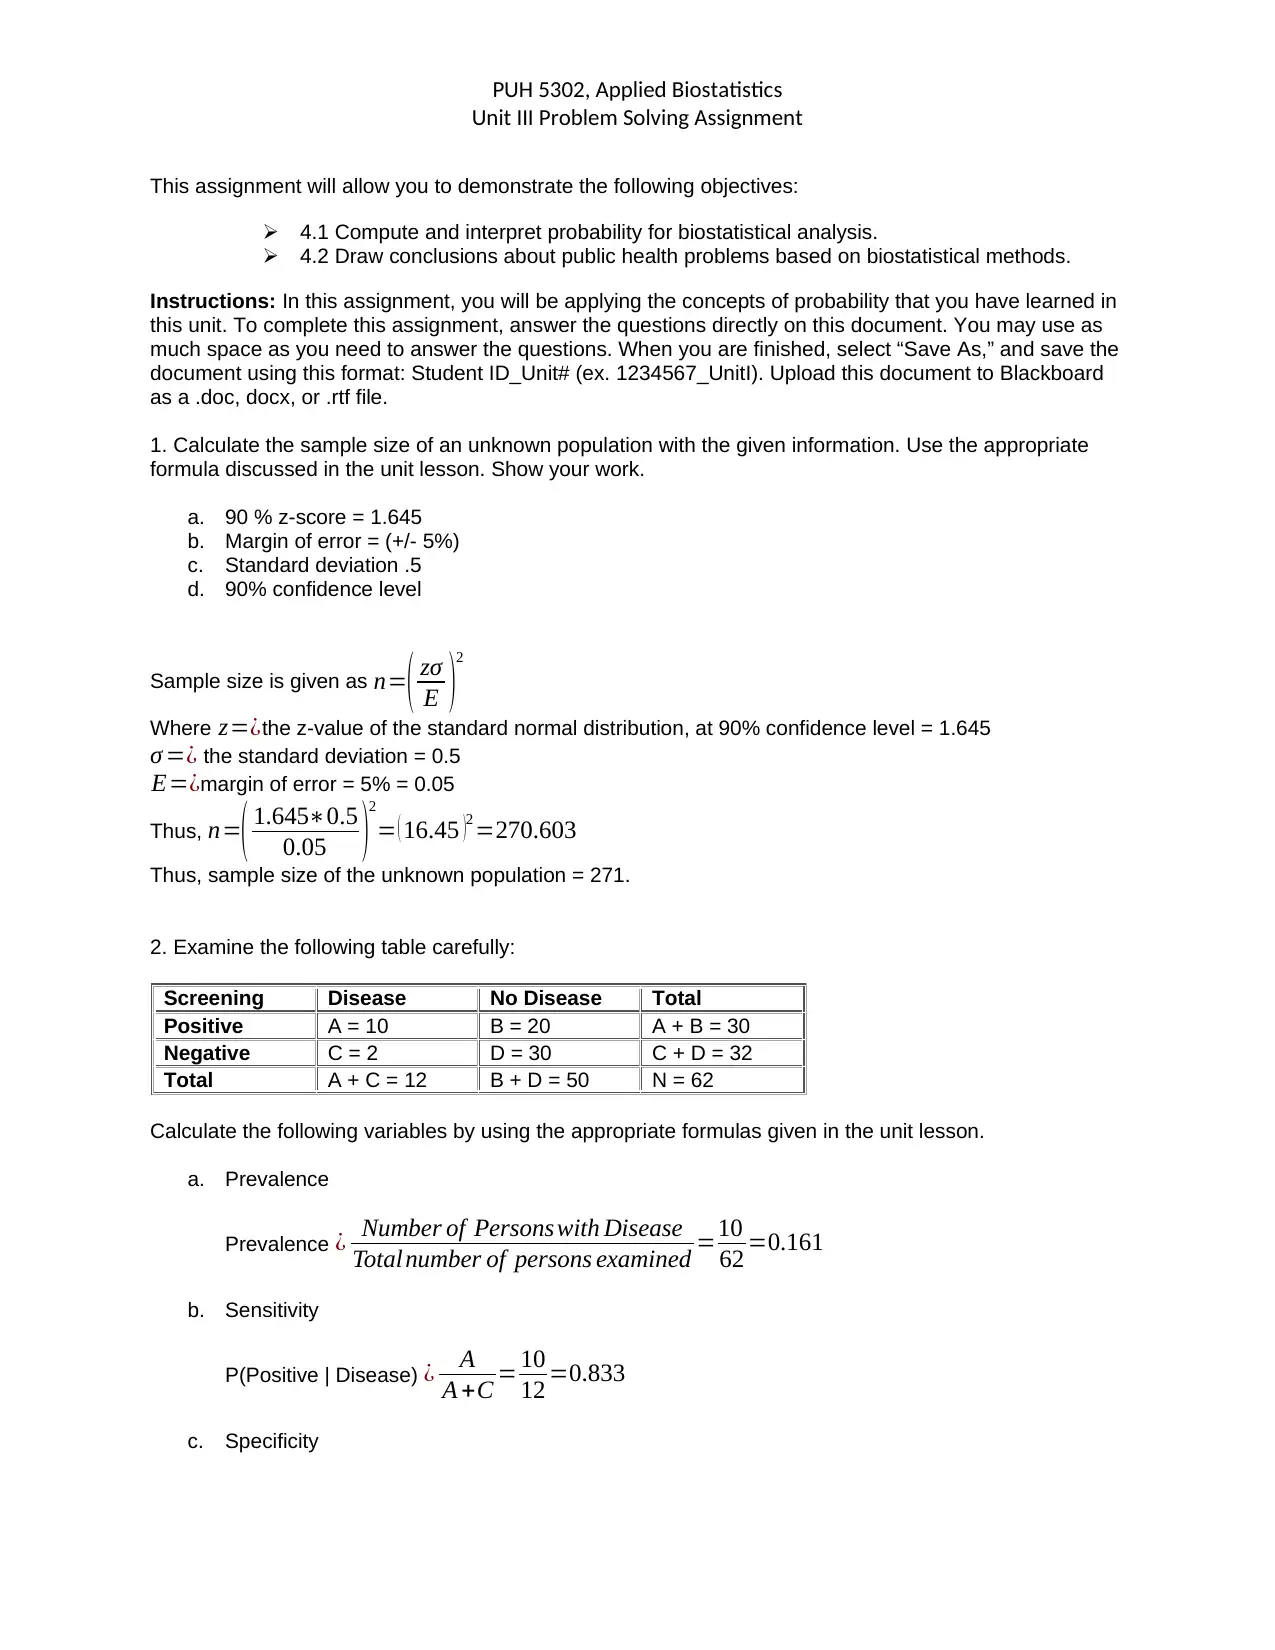
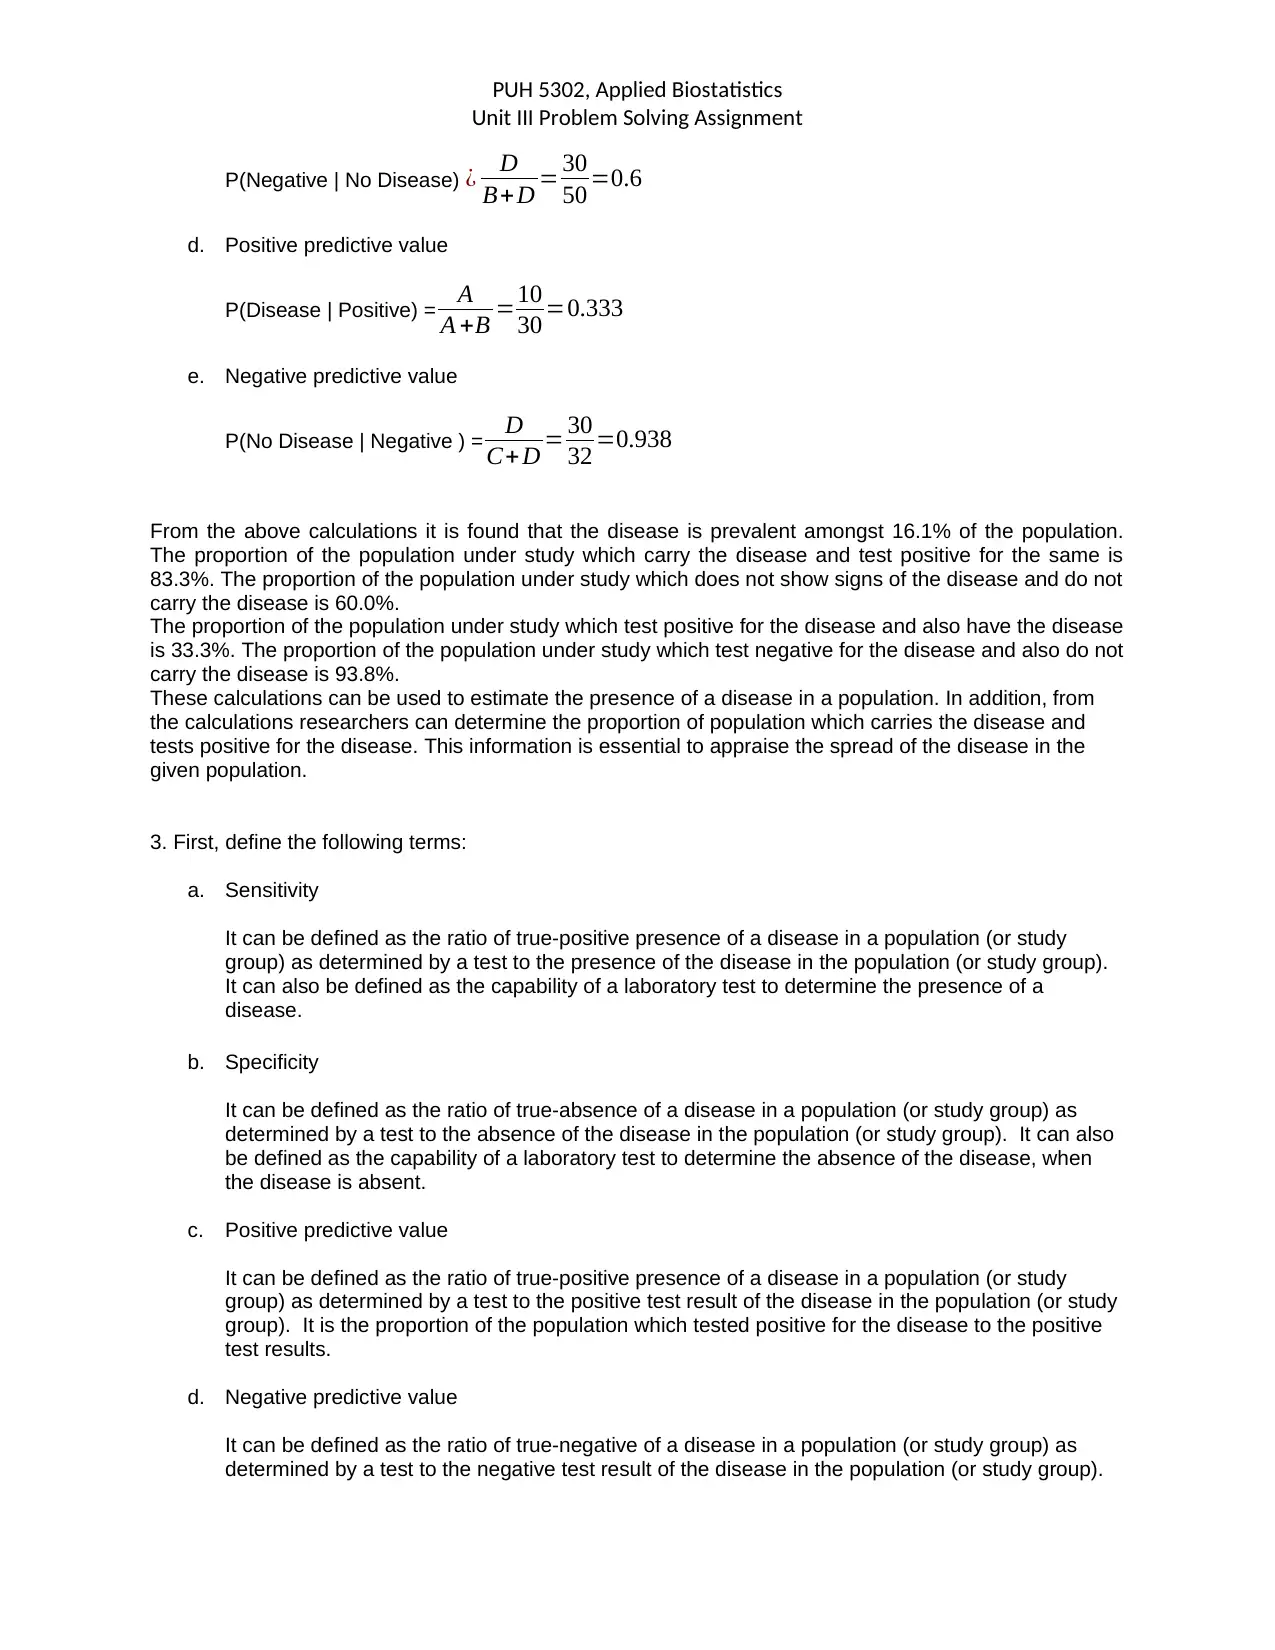
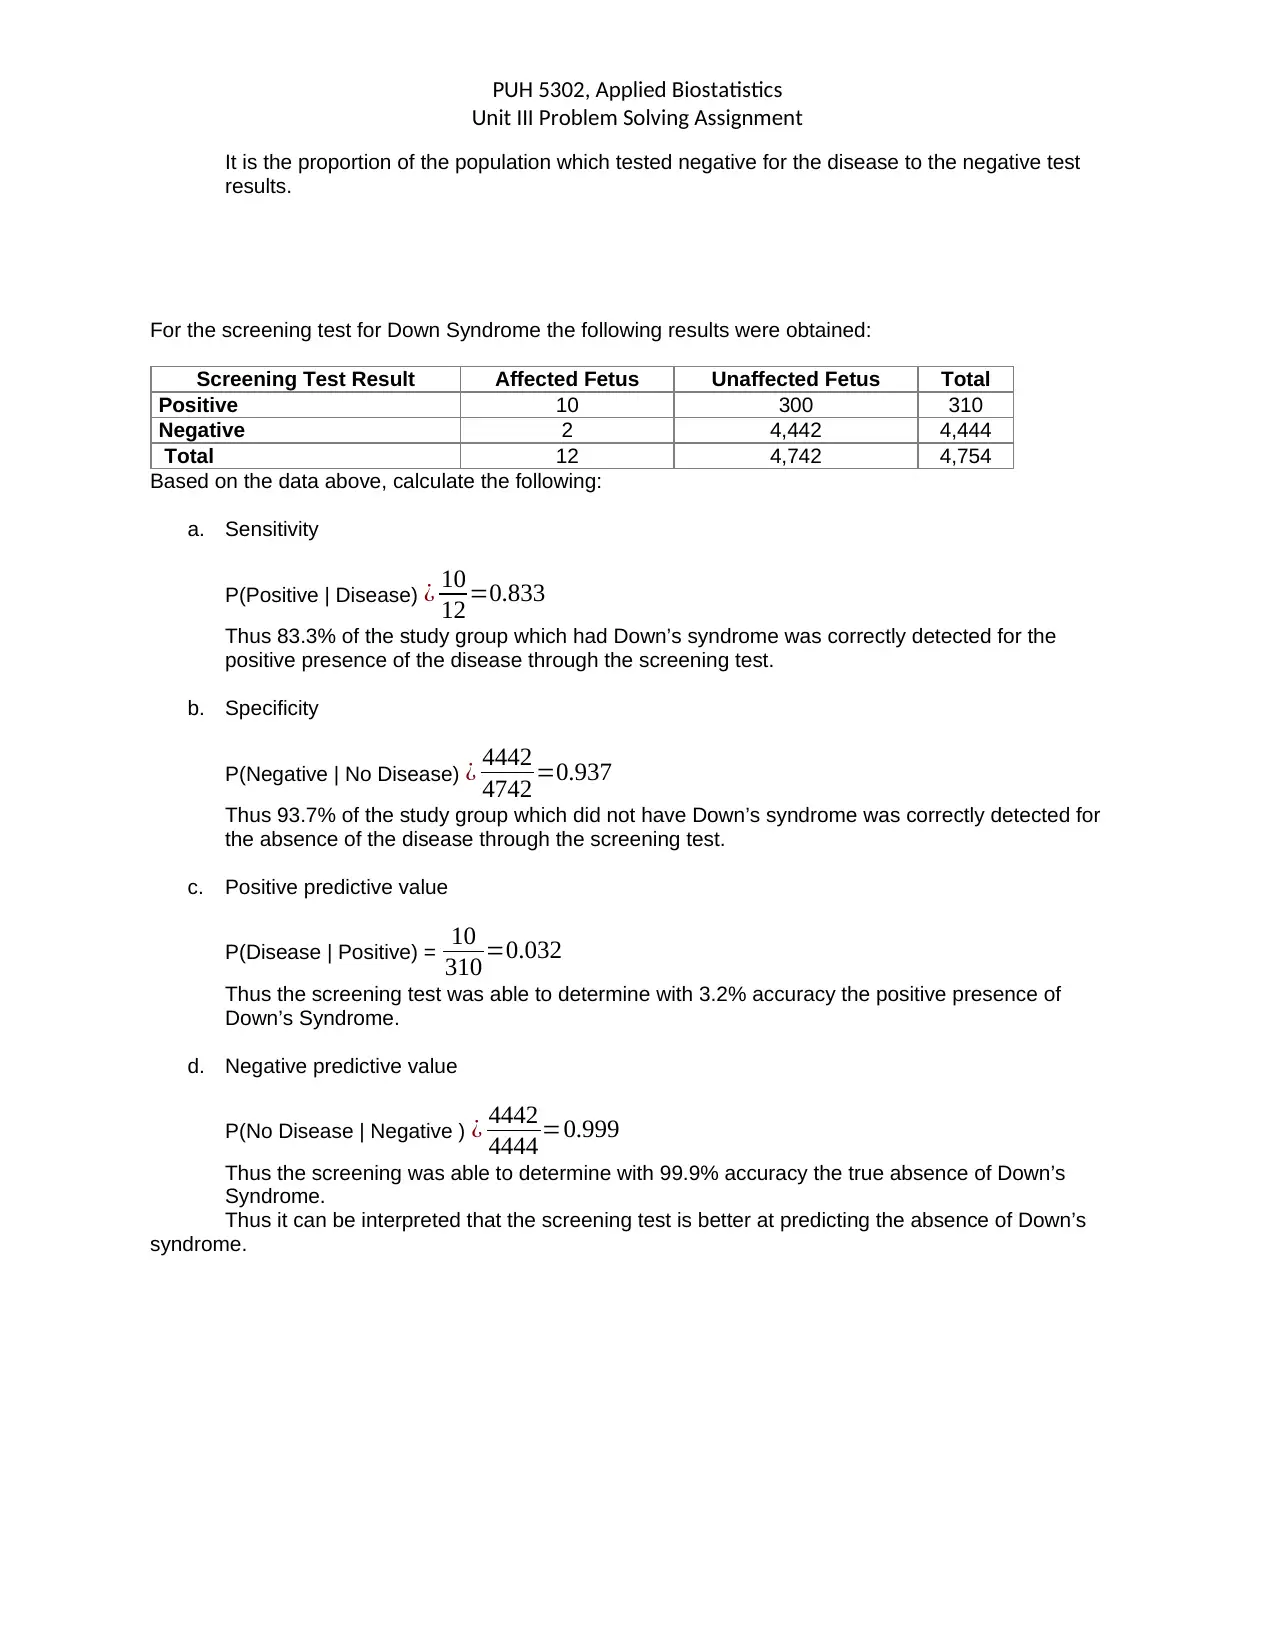
This document presents the solutions to a PUH 5302 Applied Biostatistics Unit III problem-solving assignment. The assignment focuses on applying probability concepts in biostatistical analysis and drawing conclusions about public health problems. The solutions include the calculation of sample size for an unknown population using a given formula, demonstrating the application of z-scores, margin of error, and standard deviation. The assignment also involves the analysis of a contingency table to calculate and interpret prevalence, sensitivity, specificity, positive predictive value, and negative predictive value. These calculations are used to assess the presence and spread of a disease within a population. Furthermore, the assignment requires the definition of key terms like sensitivity, specificity, positive predictive value, and negative predictive value, and the application of these concepts to analyze the results of a screening test for Down Syndrome, calculating and interpreting the same parameters to evaluate the test's accuracy in predicting the presence or absence of the condition. The document provides detailed calculations and interpretations to illustrate the application of biostatistical methods.
Document Page
PUH 5302, Applied Biostatistics
Unit III Problem Solving Assignment
This assignment will allow you to demonstrate the following objectives:
4.1 Compute and interpret probability for biostatistical analysis.
4.2 Draw conclusions about public health problems based on biostatistical methods.
Instructions: In this assignment, you will be applying the concepts of probability that you have learned in
this unit. To complete this assignment, answer the questions directly on this document. You may use as
much space as you need to answer the questions. When you are finished, select “Save As,” and save the
document using this format: Student ID_Unit# (ex. 1234567_UnitI). Upload this document to Blackboard
as a .doc, docx, or .rtf file.
1. Calculate the sample size of an unknown population with the given information. Use the appropriate
formula discussed in the unit lesson. Show your work.
a. 90 % z-score = 1.645
b. Margin of error = (+/- 5%)
c. Standard deviation .5
d. 90% confidence level
Sample size is given as n=(
E )
2
Where z=¿the z-value of the standard normal distribution, at 90% confidence level = 1.645
σ =¿ the standard deviation = 0.5
E=¿margin of error = 5% = 0.05
Thus, n=( 1.6450.5
0.05 )
2
= ( 16.45 )2 =270.603
Thus, sample size of the unknown population = 271.
2. Examine the following table carefully:
Screening Disease No Disease Total
Positive A = 10 B = 20 A + B = 30
Negative C = 2 D = 30 C + D = 32
Total A + C = 12 B + D = 50 N = 62
Calculate the following variables by using the appropriate formulas given in the unit lesson.
a. Prevalence
Prevalence ¿ Number of Persons with Disease
Total number of persons examined =10
62 =0.161
b. Sensitivity
P(Positive | Disease) ¿ A
A +C = 10
12 =0.833
c. Specificity
tabler-icon-diamond-filled.svg

Paraphrase This Document

Need a fresh take? Get an instant paraphrase of this document with our AI Paraphraser
Document Page
PUH 5302, Applied Biostatistics
Unit III Problem Solving Assignment
P(Negative | No Disease) ¿ D
B+D = 30
50 =0.6
d. Positive predictive value
P(Disease | Positive) = A
A +B =10
30 =0.333
e. Negative predictive value
P(No Disease | Negative ) = D
C+D = 30
32 =0.938
From the above calculations it is found that the disease is prevalent amongst 16.1% of the population.
The proportion of the population under study which carry the disease and test positive for the same is
83.3%. The proportion of the population under study which does not show signs of the disease and do not
carry the disease is 60.0%.
The proportion of the population under study which test positive for the disease and also have the disease
is 33.3%. The proportion of the population under study which test negative for the disease and also do not
carry the disease is 93.8%.
These calculations can be used to estimate the presence of a disease in a population. In addition, from
the calculations researchers can determine the proportion of population which carries the disease and
tests positive for the disease. This information is essential to appraise the spread of the disease in the
given population.
3. First, define the following terms:
a. Sensitivity
It can be defined as the ratio of true-positive presence of a disease in a population (or study
group) as determined by a test to the presence of the disease in the population (or study group).
It can also be defined as the capability of a laboratory test to determine the presence of a
disease.
b. Specificity
It can be defined as the ratio of true-absence of a disease in a population (or study group) as
determined by a test to the absence of the disease in the population (or study group). It can also
be defined as the capability of a laboratory test to determine the absence of the disease, when
the disease is absent.
c. Positive predictive value
It can be defined as the ratio of true-positive presence of a disease in a population (or study
group) as determined by a test to the positive test result of the disease in the population (or study
group). It is the proportion of the population which tested positive for the disease to the positive
test results.
d. Negative predictive value
It can be defined as the ratio of true-negative of a disease in a population (or study group) as
determined by a test to the negative test result of the disease in the population (or study group).
Document Page
PUH 5302, Applied Biostatistics
Unit III Problem Solving Assignment
It is the proportion of the population which tested negative for the disease to the negative test
results.
For the screening test for Down Syndrome the following results were obtained:
Screening Test Result Affected Fetus Unaffected Fetus Total
Positive 10 300 310
Negative 2 4,442 4,444
Total 12 4,742 4,754
Based on the data above, calculate the following:
a. Sensitivity
P(Positive | Disease) ¿ 10
12 =0.833
Thus 83.3% of the study group which had Down’s syndrome was correctly detected for the
positive presence of the disease through the screening test.
b. Specificity
P(Negative | No Disease) ¿ 4442
4742 =0.937
Thus 93.7% of the study group which did not have Down’s syndrome was correctly detected for
the absence of the disease through the screening test.
c. Positive predictive value
P(Disease | Positive) = 10
310 =0.032
Thus the screening test was able to determine with 3.2% accuracy the positive presence of
Down’s Syndrome.
d. Negative predictive value
P(No Disease | Negative ) ¿ 4442
4444 =0.999
Thus the screening was able to determine with 99.9% accuracy the true absence of Down’s
Syndrome.
Thus it can be interpreted that the screening test is better at predicting the absence of Down’s
syndrome.
chevron_up_icon
1 out of 3
circle_padding
hide_on_mobile
zoom_out_icon
[object Object]