Corporate Finance Assignment: PUMA's Financial Performance Analysis

Verified

Added on  2022/09/05

|29
|4639
|30
Report
AI Summary
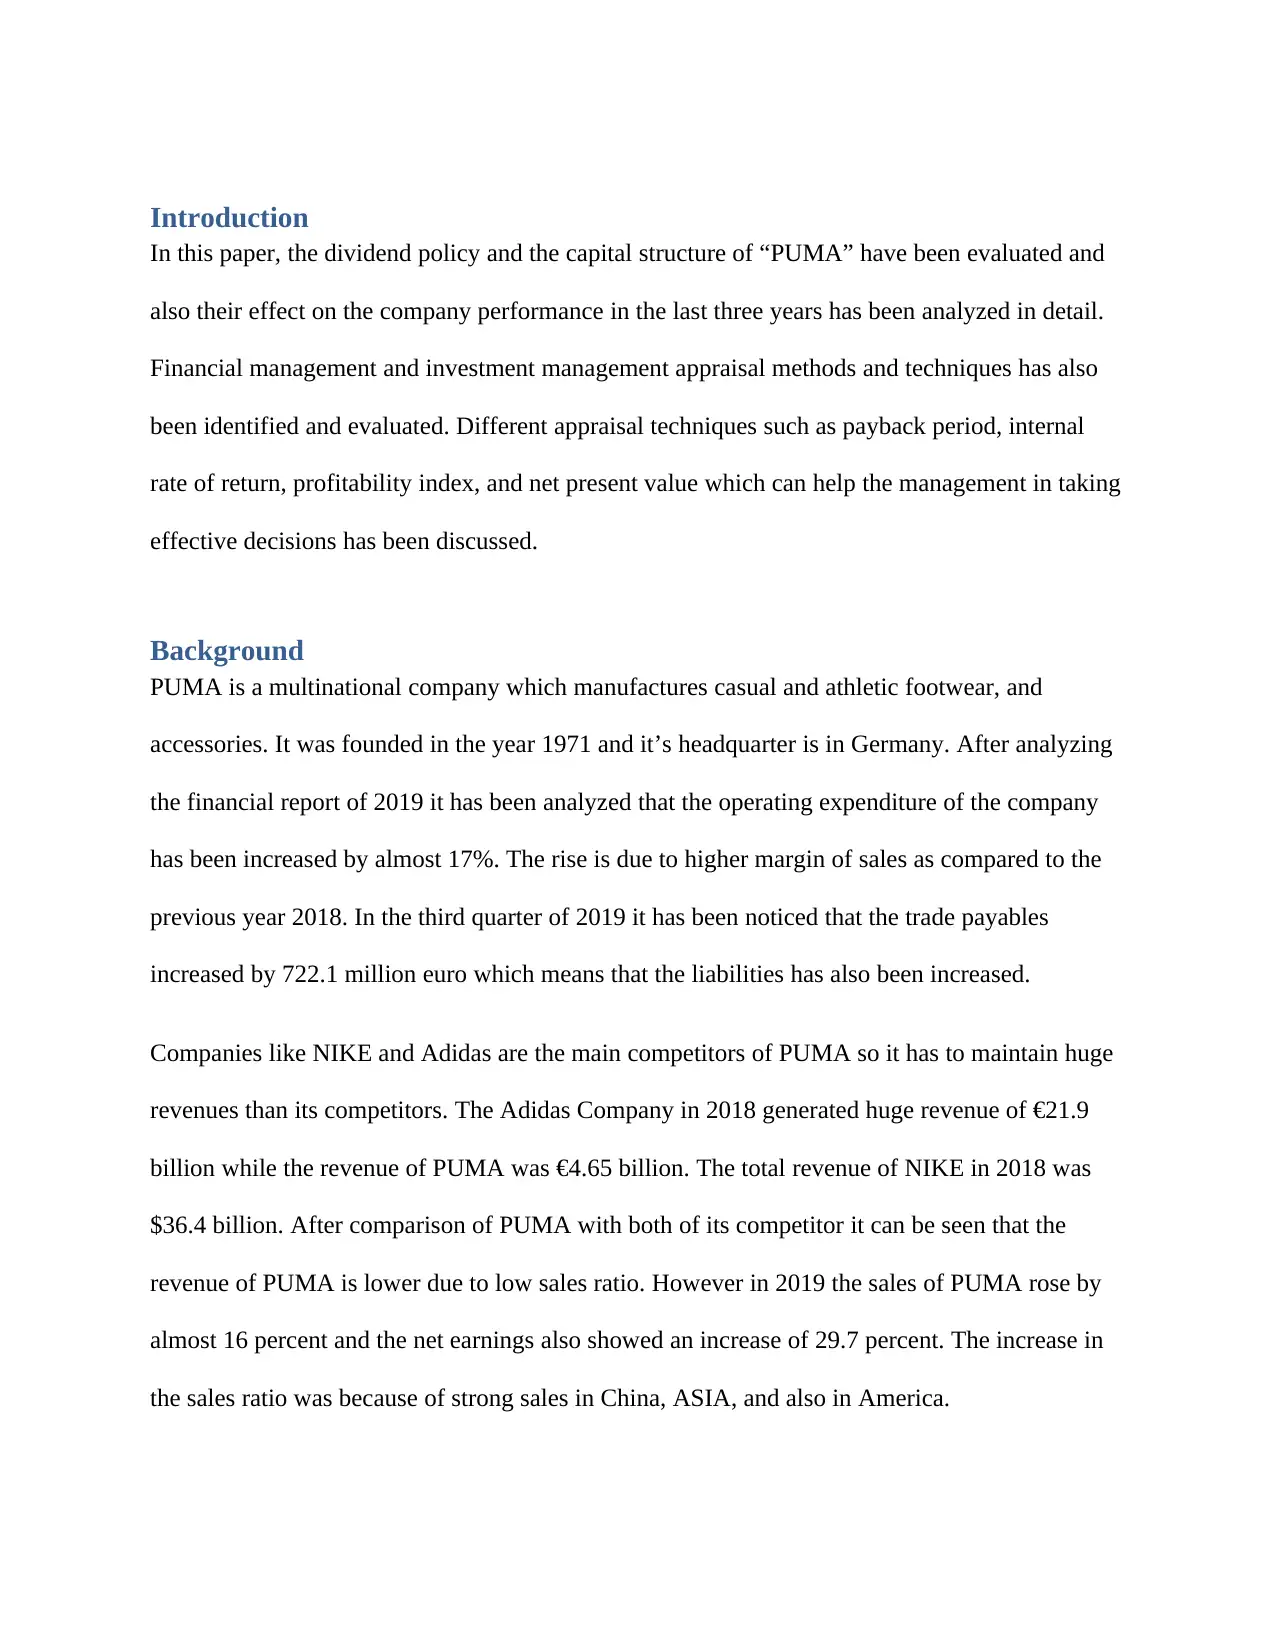
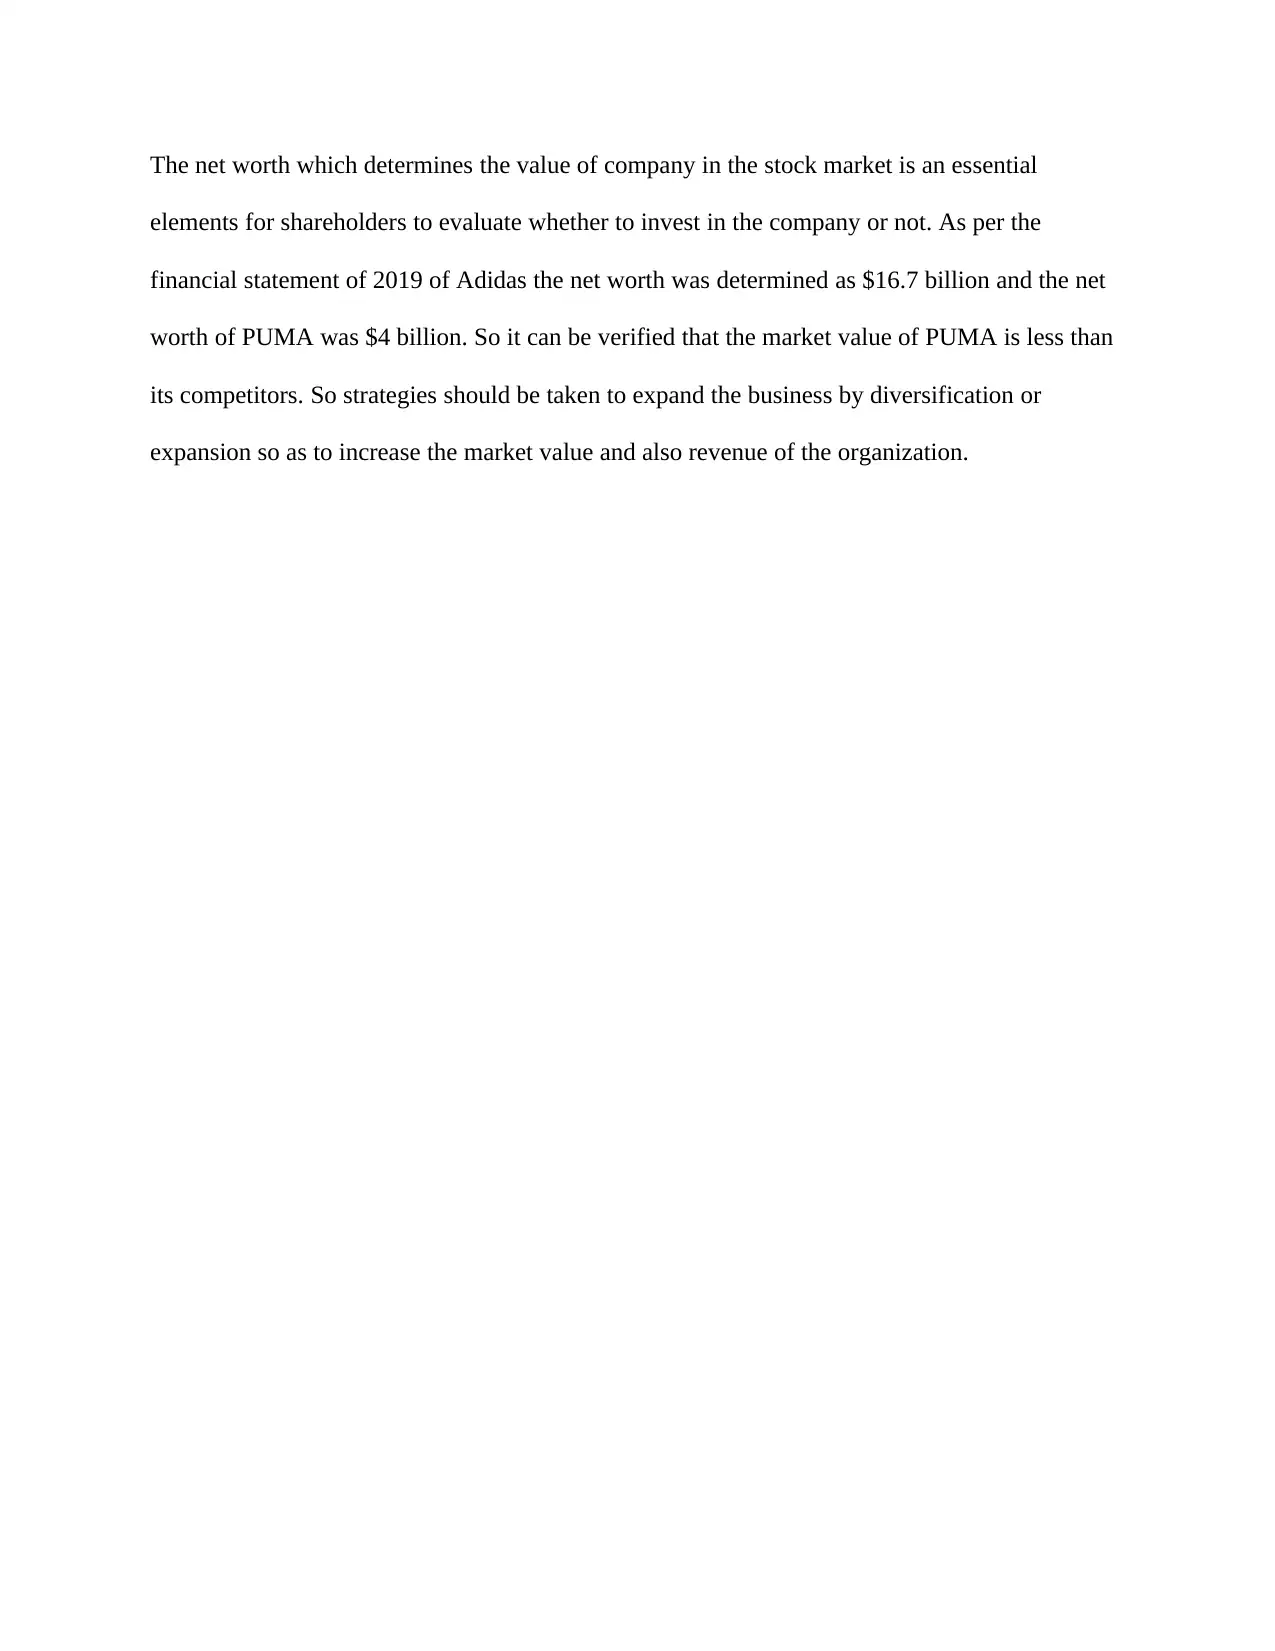
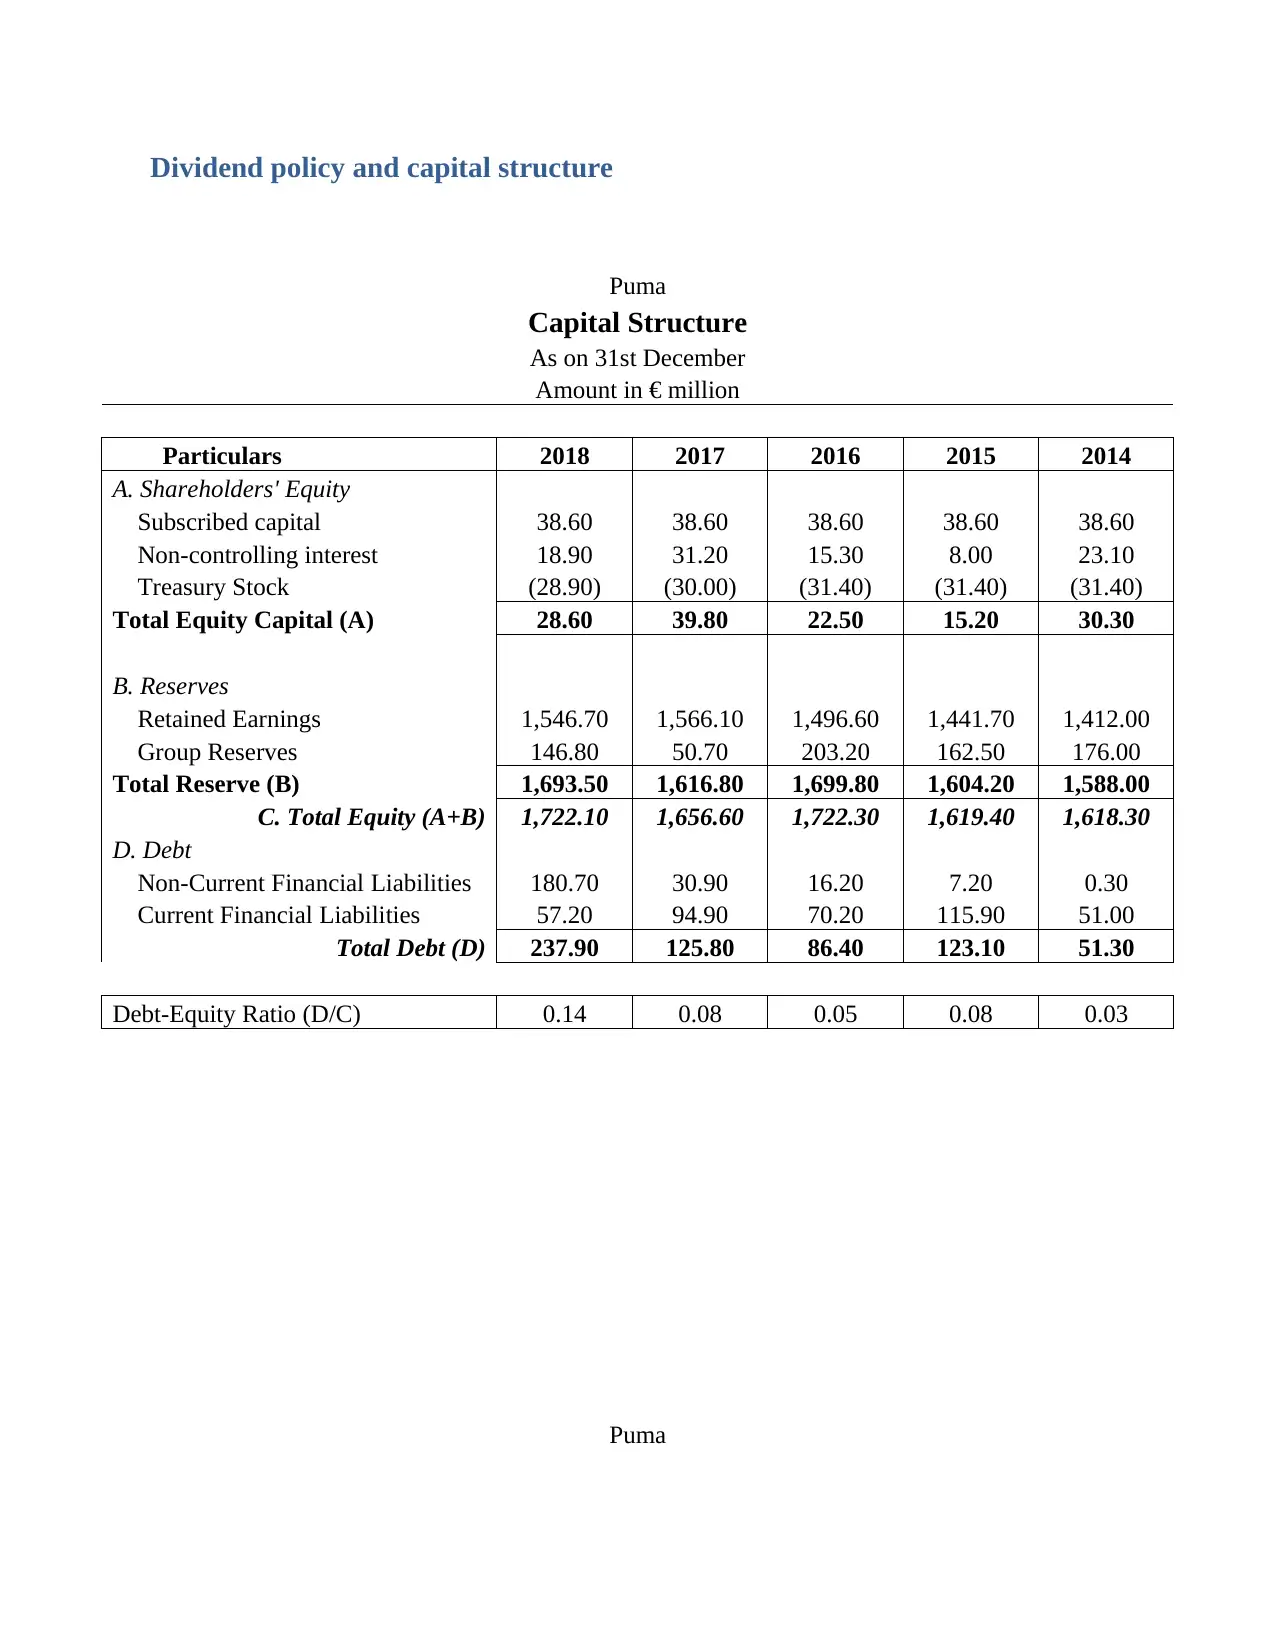
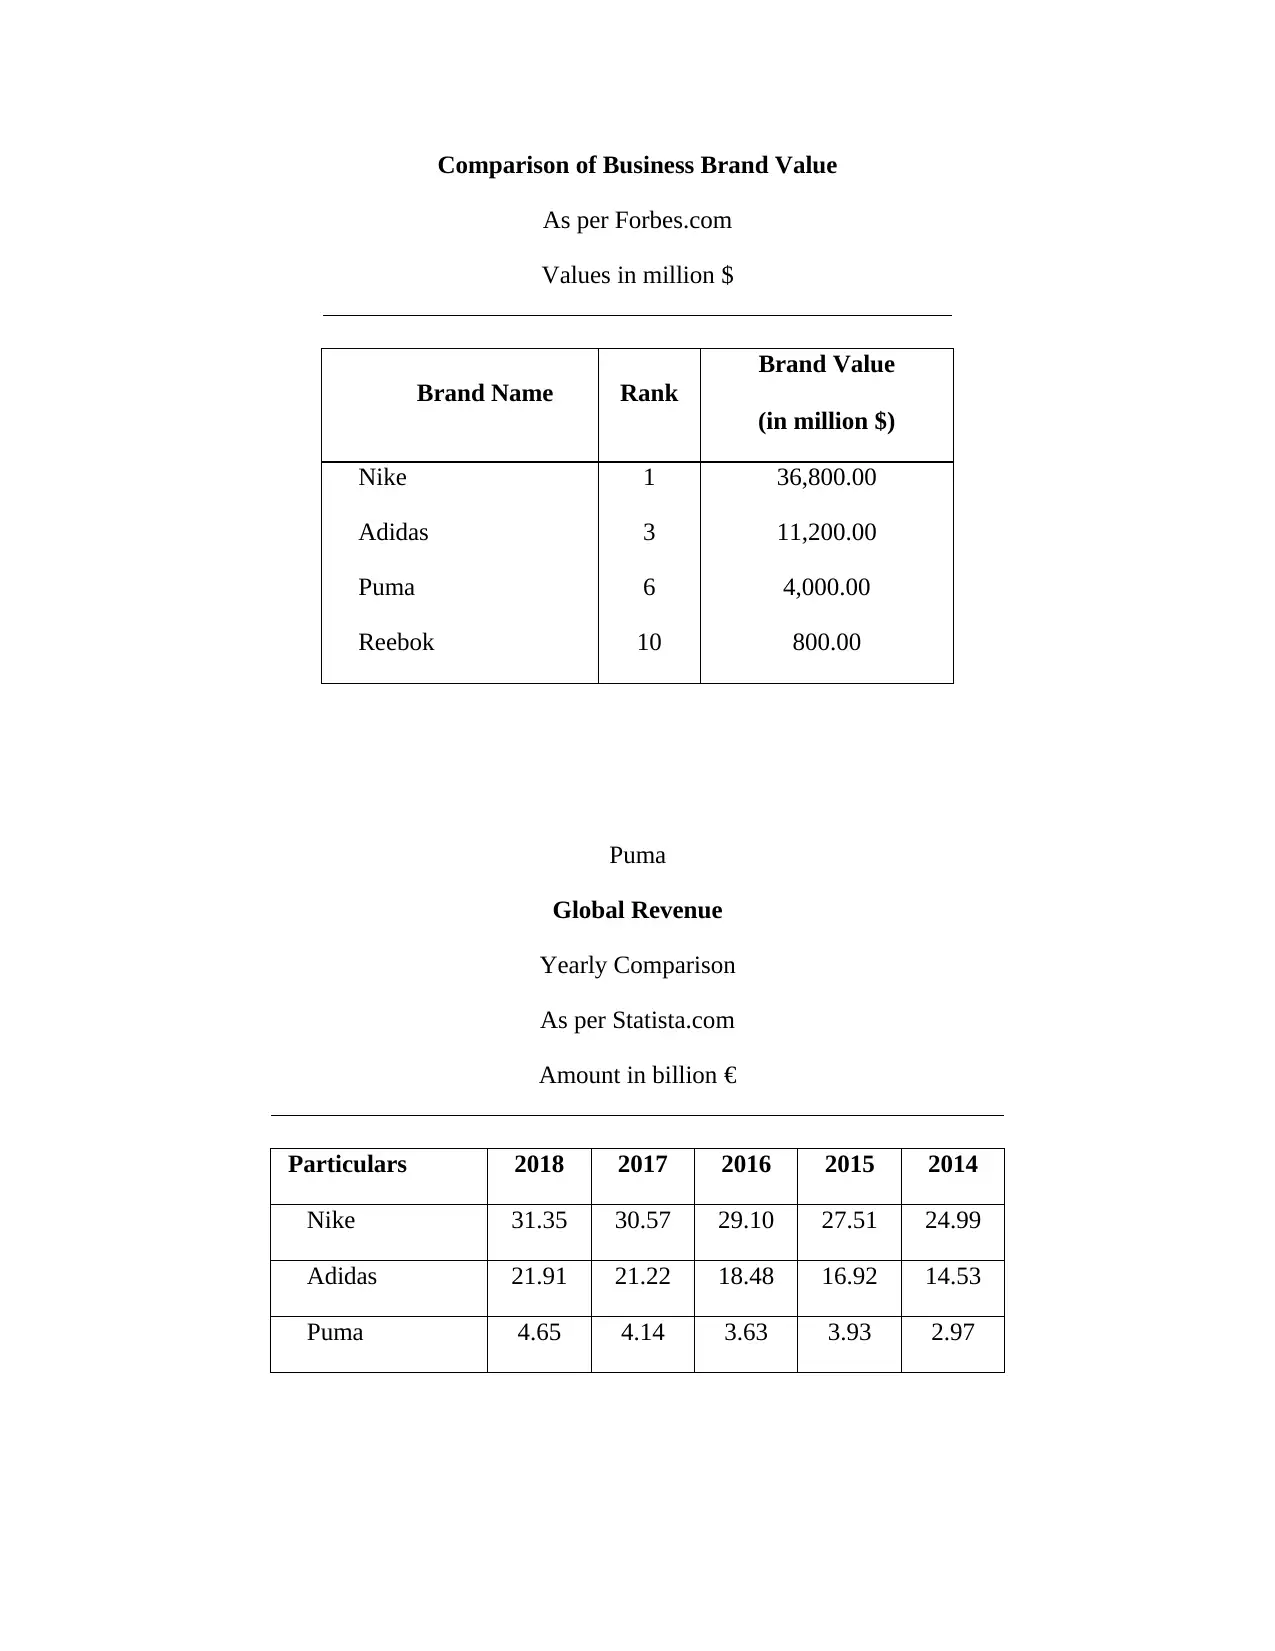
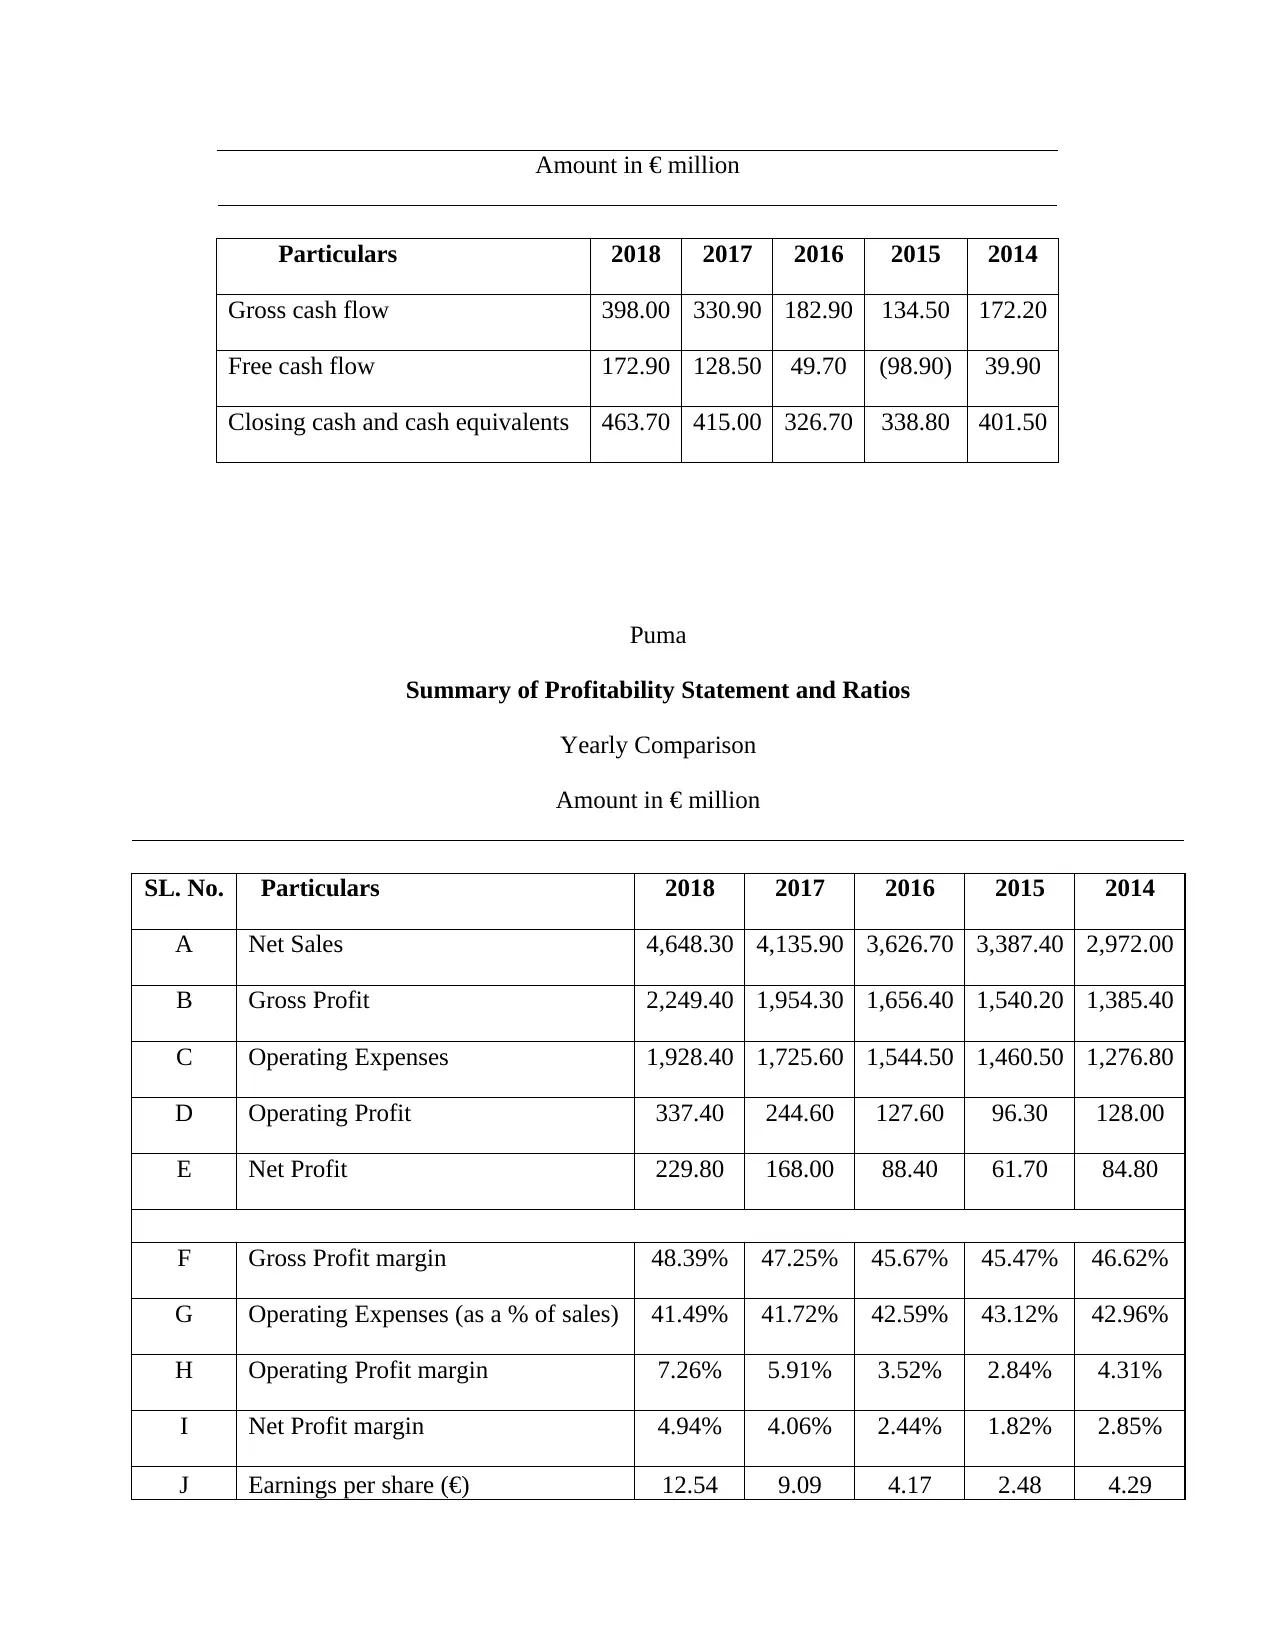
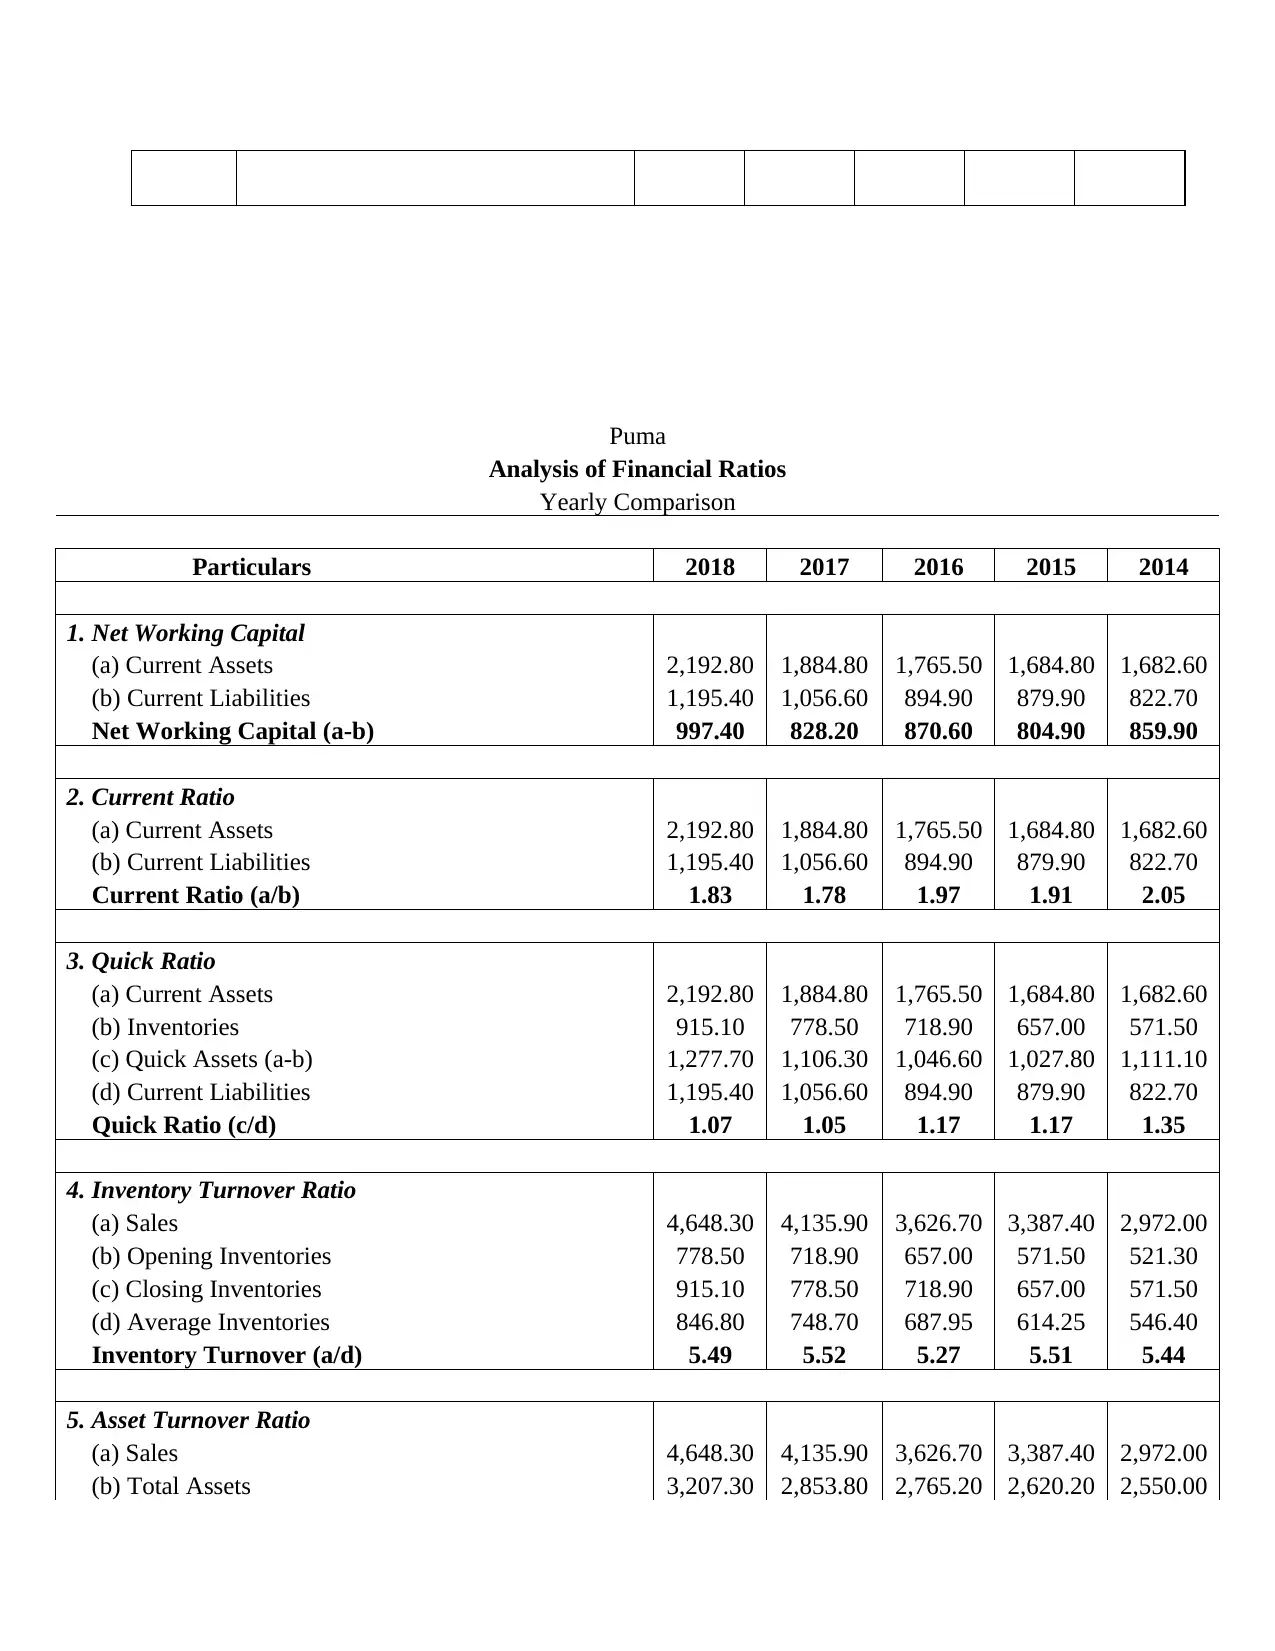
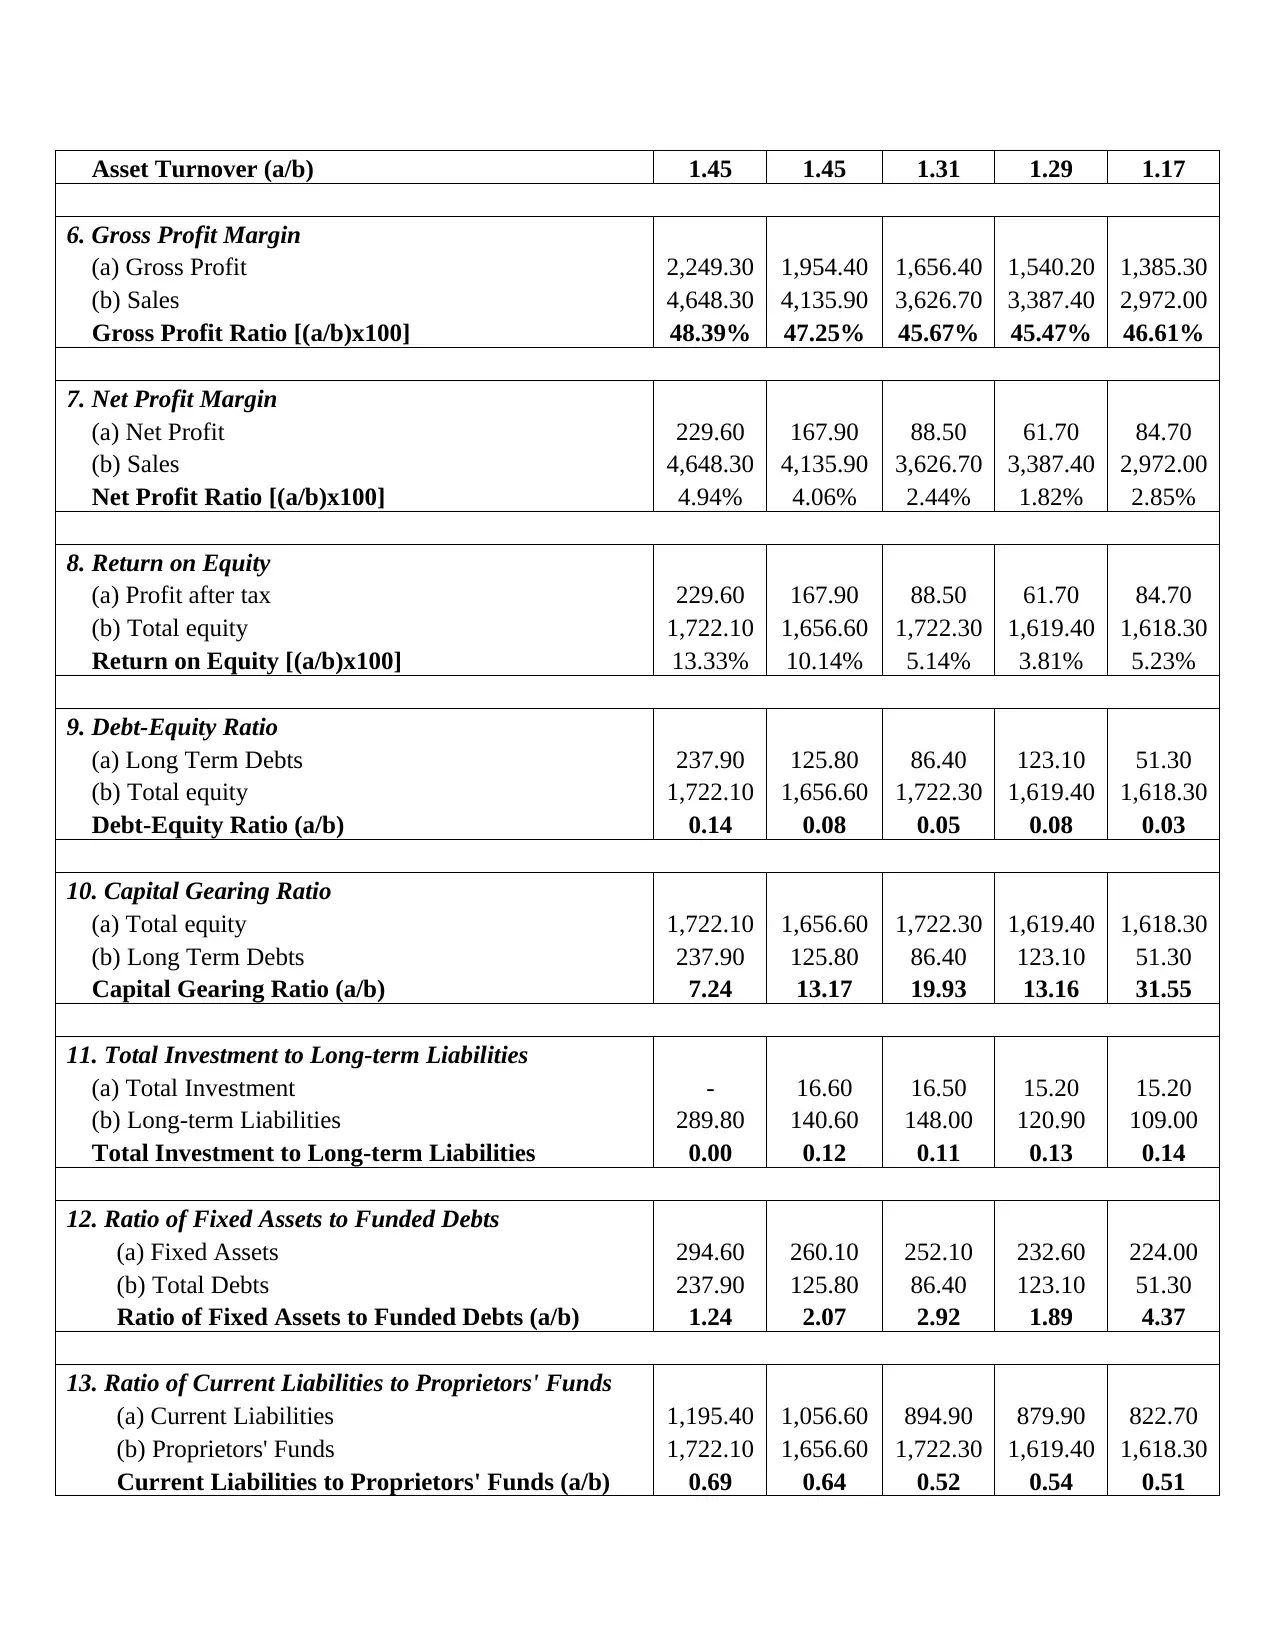
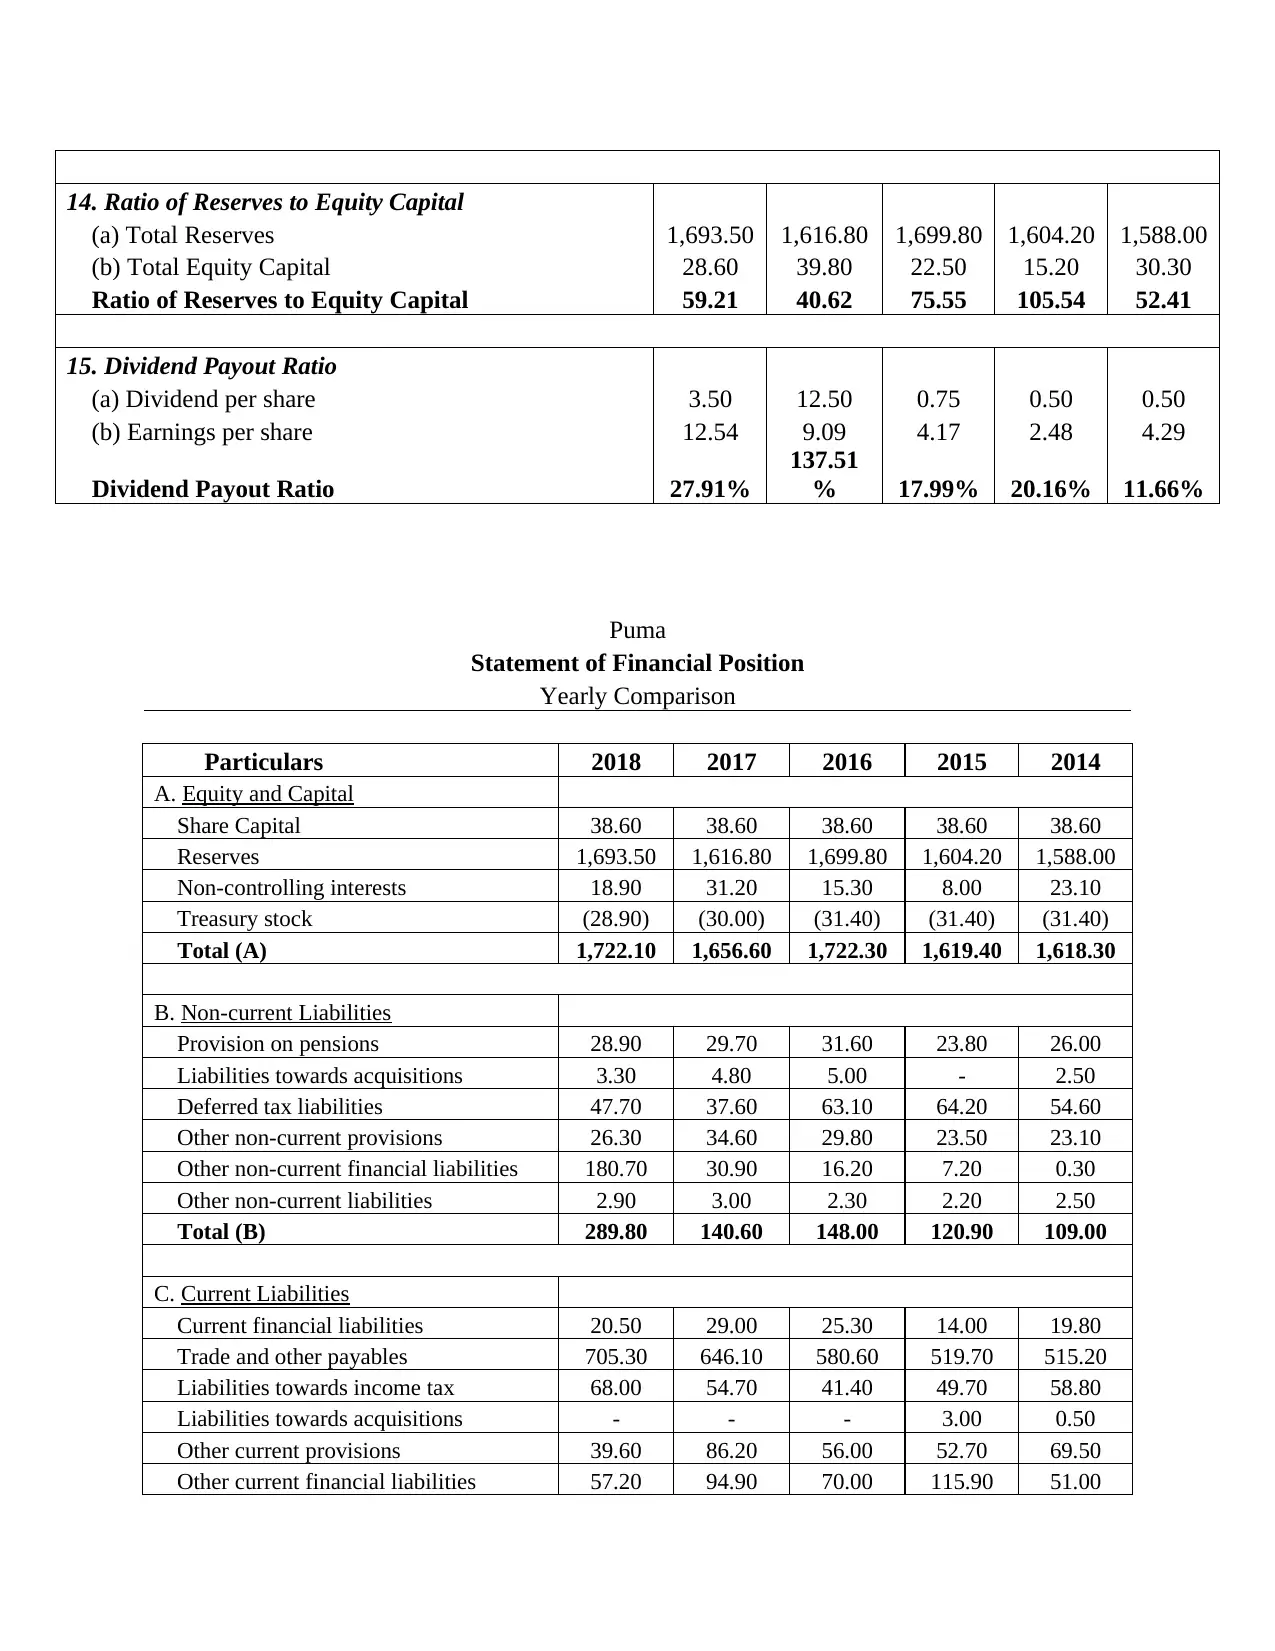
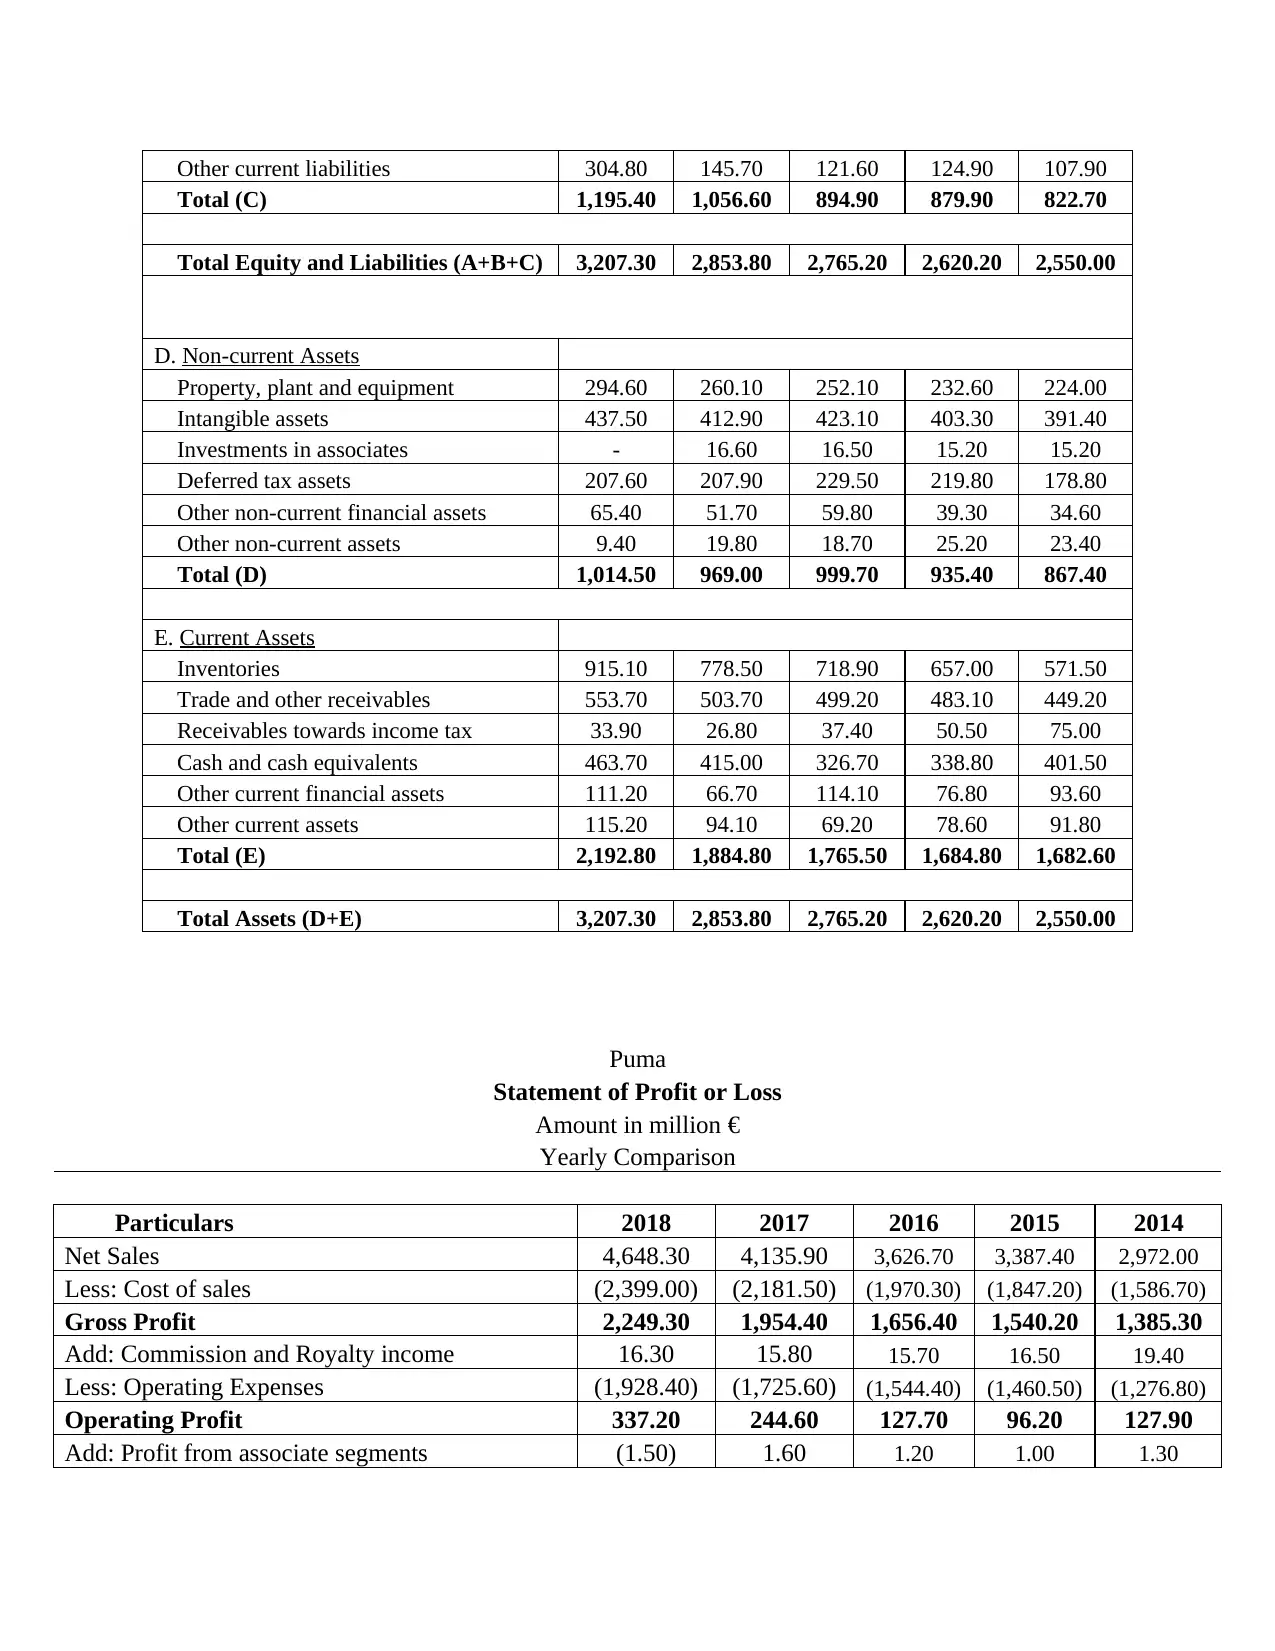
This report provides a comprehensive financial analysis of PUMA, examining its capital structure, dividend policy, and their impact on the company's performance over a three-year period. The analysis includes an overview of PUMA's background, key corporate objectives, and a comparison with competitors like Nike and Adidas. The report delves into PUMA's capital structure, presenting financial data and ratios such as the debt-equity ratio and dividend payout ratio. It also explores various sources of finance, discussing the potential impact of equity shares and debentures. Furthermore, the report identifies and evaluates financial management appraisal techniques, including payback period, internal rate of return, profitability index, and net present value, to aid in effective decision-making. Finally, the report concludes with a discussion of the strengths and weaknesses of the analysis, offering recommendations for future financial strategies. The report uses financial statements, ratios and comparisons to explain the performance of the company and its standing in the market.
Document Page
Corporate Finance Assignment
tabler-icon-diamond-filled.svg

Paraphrase This Document

Need a fresh take? Get an instant paraphrase of this document with our AI Paraphraser
Document Page
Table of Contents
Introduction......................................................................................................................................3
Background......................................................................................................................................3
Dividend policy and capital structure..............................................................................................5
Sources of Finance.........................................................................................................................13
Financial management evaluation (appraisal) techniques.............................................................15
Advantages and disadvantages of Appraisal techniques...............................................................20
Weakness and Strength of the analysis..........................................................................................23
Conclusion.....................................................................................................................................24
Document Page
Introduction
In this paper, the dividend policy and the capital structure of “PUMA” have been evaluated and
also their effect on the company performance in the last three years has been analyzed in detail.
Financial management and investment management appraisal methods and techniques has also
been identified and evaluated. Different appraisal techniques such as payback period, internal
rate of return, profitability index, and net present value which can help the management in taking
effective decisions has been discussed.
Background
PUMA is a multinational company which manufactures casual and athletic footwear, and
accessories. It was founded in the year 1971 and it’s headquarter is in Germany. After analyzing
the financial report of 2019 it has been analyzed that the operating expenditure of the company
has been increased by almost 17%. The rise is due to higher margin of sales as compared to the
previous year 2018. In the third quarter of 2019 it has been noticed that the trade payables
increased by 722.1 million euro which means that the liabilities has also been increased.
Companies like NIKE and Adidas are the main competitors of PUMA so it has to maintain huge
revenues than its competitors. The Adidas Company in 2018 generated huge revenue of €21.9
billion while the revenue of PUMA was €4.65 billion. The total revenue of NIKE in 2018 was
$36.4 billion. After comparison of PUMA with both of its competitor it can be seen that the
revenue of PUMA is lower due to low sales ratio. However in 2019 the sales of PUMA rose by
almost 16 percent and the net earnings also showed an increase of 29.7 percent. The increase in
the sales ratio was because of strong sales in China, ASIA, and also in America.
Document Page
The net worth which determines the value of company in the stock market is an essential
elements for shareholders to evaluate whether to invest in the company or not. As per the
financial statement of 2019 of Adidas the net worth was determined as $16.7 billion and the net
worth of PUMA was $4 billion. So it can be verified that the market value of PUMA is less than
its competitors. So strategies should be taken to expand the business by diversification or
expansion so as to increase the market value and also revenue of the organization.
tabler-icon-diamond-filled.svg

Paraphrase This Document

Need a fresh take? Get an instant paraphrase of this document with our AI Paraphraser
Document Page
Dividend policy and capital structure
Puma
Capital Structure
As on 31st December
Amount in € million
Particulars 2018 2017 2016 2015 2014
A. Shareholders' Equity
Subscribed capital 38.60 38.60 38.60 38.60 38.60
Non-controlling interest 18.90 31.20 15.30 8.00 23.10
Treasury Stock (28.90) (30.00) (31.40) (31.40) (31.40)
Total Equity Capital (A) 28.60 39.80 22.50 15.20 30.30
B. Reserves
Retained Earnings 1,546.70 1,566.10 1,496.60 1,441.70 1,412.00
Group Reserves 146.80 50.70 203.20 162.50 176.00
Total Reserve (B) 1,693.50 1,616.80 1,699.80 1,604.20 1,588.00
C. Total Equity (A+B) 1,722.10 1,656.60 1,722.30 1,619.40 1,618.30
D. Debt
Non-Current Financial Liabilities 180.70 30.90 16.20 7.20 0.30
Current Financial Liabilities 57.20 94.90 70.20 115.90 51.00
Total Debt (D) 237.90 125.80 86.40 123.10 51.30
Debt-Equity Ratio (D/C) 0.14 0.08 0.05 0.08 0.03
Puma
Document Page
Comparison of Business Brand Value
As per Forbes.com
Values in million $
Brand Name Rank
Brand Value
(in million $)
Nike 1 36,800.00
Adidas 3 11,200.00
Puma 6 4,000.00
Reebok 10 800.00
Puma
Global Revenue
Yearly Comparison
As per Statista.com
Amount in billion €
Particulars 2018 2017 2016 2015 2014
Nike 31.35 30.57 29.10 27.51 24.99
Adidas 21.91 21.22 18.48 16.92 14.53
Puma 4.65 4.14 3.63 3.93 2.97
Document Page
Puma
Product Range
Particulars
Team-sport
Running and
training
Basketball
Golf
Motorsport
Sport-style
Licensing
Accessories
Puma
Cash Flow
Yearly Comparison
tabler-icon-diamond-filled.svg

Paraphrase This Document

Need a fresh take? Get an instant paraphrase of this document with our AI Paraphraser
Document Page
Amount in € million
Particulars 2018 2017 2016 2015 2014
Gross cash flow 398.00 330.90 182.90 134.50 172.20
Free cash flow 172.90 128.50 49.70 (98.90) 39.90
Closing cash and cash equivalents 463.70 415.00 326.70 338.80 401.50
Puma
Summary of Profitability Statement and Ratios
Yearly Comparison
Amount in € million
SL. No. Particulars 2018 2017 2016 2015 2014
A Net Sales 4,648.30 4,135.90 3,626.70 3,387.40 2,972.00
B Gross Profit 2,249.40 1,954.30 1,656.40 1,540.20 1,385.40
C Operating Expenses 1,928.40 1,725.60 1,544.50 1,460.50 1,276.80
D Operating Profit 337.40 244.60 127.60 96.30 128.00
E Net Profit 229.80 168.00 88.40 61.70 84.80
F Gross Profit margin 48.39% 47.25% 45.67% 45.47% 46.62%
G Operating Expenses (as a % of sales) 41.49% 41.72% 42.59% 43.12% 42.96%
H Operating Profit margin 7.26% 5.91% 3.52% 2.84% 4.31%
I Net Profit margin 4.94% 4.06% 2.44% 1.82% 2.85%
J Earnings per share (€) 12.54 9.09 4.17 2.48 4.29
Document Page
Puma
Analysis of Financial Ratios
Yearly Comparison
Particulars 2018 2017 2016 2015 2014
1. Net Working Capital
(a) Current Assets 2,192.80 1,884.80 1,765.50 1,684.80 1,682.60
(b) Current Liabilities 1,195.40 1,056.60 894.90 879.90 822.70
Net Working Capital (a-b) 997.40 828.20 870.60 804.90 859.90
2. Current Ratio
(a) Current Assets 2,192.80 1,884.80 1,765.50 1,684.80 1,682.60
(b) Current Liabilities 1,195.40 1,056.60 894.90 879.90 822.70
Current Ratio (a/b) 1.83 1.78 1.97 1.91 2.05
3. Quick Ratio
(a) Current Assets 2,192.80 1,884.80 1,765.50 1,684.80 1,682.60
(b) Inventories 915.10 778.50 718.90 657.00 571.50
(c) Quick Assets (a-b) 1,277.70 1,106.30 1,046.60 1,027.80 1,111.10
(d) Current Liabilities 1,195.40 1,056.60 894.90 879.90 822.70
Quick Ratio (c/d) 1.07 1.05 1.17 1.17 1.35
4. Inventory Turnover Ratio
(a) Sales 4,648.30 4,135.90 3,626.70 3,387.40 2,972.00
(b) Opening Inventories 778.50 718.90 657.00 571.50 521.30
(c) Closing Inventories 915.10 778.50 718.90 657.00 571.50
(d) Average Inventories 846.80 748.70 687.95 614.25 546.40
Inventory Turnover (a/d) 5.49 5.52 5.27 5.51 5.44
5. Asset Turnover Ratio
(a) Sales 4,648.30 4,135.90 3,626.70 3,387.40 2,972.00
(b) Total Assets 3,207.30 2,853.80 2,765.20 2,620.20 2,550.00
Document Page
Asset Turnover (a/b) 1.45 1.45 1.31 1.29 1.17
6. Gross Profit Margin
(a) Gross Profit 2,249.30 1,954.40 1,656.40 1,540.20 1,385.30
(b) Sales 4,648.30 4,135.90 3,626.70 3,387.40 2,972.00
Gross Profit Ratio [(a/b)x100] 48.39% 47.25% 45.67% 45.47% 46.61%
7. Net Profit Margin
(a) Net Profit 229.60 167.90 88.50 61.70 84.70
(b) Sales 4,648.30 4,135.90 3,626.70 3,387.40 2,972.00
Net Profit Ratio [(a/b)x100] 4.94% 4.06% 2.44% 1.82% 2.85%
8. Return on Equity
(a) Profit after tax 229.60 167.90 88.50 61.70 84.70
(b) Total equity 1,722.10 1,656.60 1,722.30 1,619.40 1,618.30
Return on Equity [(a/b)x100] 13.33% 10.14% 5.14% 3.81% 5.23%
9. Debt-Equity Ratio
(a) Long Term Debts 237.90 125.80 86.40 123.10 51.30
(b) Total equity 1,722.10 1,656.60 1,722.30 1,619.40 1,618.30
Debt-Equity Ratio (a/b) 0.14 0.08 0.05 0.08 0.03
10. Capital Gearing Ratio
(a) Total equity 1,722.10 1,656.60 1,722.30 1,619.40 1,618.30
(b) Long Term Debts 237.90 125.80 86.40 123.10 51.30
Capital Gearing Ratio (a/b) 7.24 13.17 19.93 13.16 31.55
11. Total Investment to Long-term Liabilities
(a) Total Investment - 16.60 16.50 15.20 15.20
(b) Long-term Liabilities 289.80 140.60 148.00 120.90 109.00
Total Investment to Long-term Liabilities 0.00 0.12 0.11 0.13 0.14
12. Ratio of Fixed Assets to Funded Debts
(a) Fixed Assets 294.60 260.10 252.10 232.60 224.00
(b) Total Debts 237.90 125.80 86.40 123.10 51.30
Ratio of Fixed Assets to Funded Debts (a/b) 1.24 2.07 2.92 1.89 4.37
13. Ratio of Current Liabilities to Proprietors' Funds
(a) Current Liabilities 1,195.40 1,056.60 894.90 879.90 822.70
(b) Proprietors' Funds 1,722.10 1,656.60 1,722.30 1,619.40 1,618.30
Current Liabilities to Proprietors' Funds (a/b) 0.69 0.64 0.52 0.54 0.51
tabler-icon-diamond-filled.svg

Paraphrase This Document

Need a fresh take? Get an instant paraphrase of this document with our AI Paraphraser
Document Page
14. Ratio of Reserves to Equity Capital
(a) Total Reserves 1,693.50 1,616.80 1,699.80 1,604.20 1,588.00
(b) Total Equity Capital 28.60 39.80 22.50 15.20 30.30
Ratio of Reserves to Equity Capital 59.21 40.62 75.55 105.54 52.41
15. Dividend Payout Ratio
(a) Dividend per share 3.50 12.50 0.75 0.50 0.50
(b) Earnings per share 12.54 9.09 4.17 2.48 4.29
Dividend Payout Ratio 27.91%
137.51
% 17.99% 20.16% 11.66%
Puma
Statement of Financial Position
Yearly Comparison
Particulars 2018 2017 2016 2015 2014
A. Equity and Capital
Share Capital 38.60 38.60 38.60 38.60 38.60
Reserves 1,693.50 1,616.80 1,699.80 1,604.20 1,588.00
Non-controlling interests 18.90 31.20 15.30 8.00 23.10
Treasury stock (28.90) (30.00) (31.40) (31.40) (31.40)
Total (A) 1,722.10 1,656.60 1,722.30 1,619.40 1,618.30
B. Non-current Liabilities
Provision on pensions 28.90 29.70 31.60 23.80 26.00
Liabilities towards acquisitions 3.30 4.80 5.00 - 2.50
Deferred tax liabilities 47.70 37.60 63.10 64.20 54.60
Other non-current provisions 26.30 34.60 29.80 23.50 23.10
Other non-current financial liabilities 180.70 30.90 16.20 7.20 0.30
Other non-current liabilities 2.90 3.00 2.30 2.20 2.50
Total (B) 289.80 140.60 148.00 120.90 109.00
C. Current Liabilities
Current financial liabilities 20.50 29.00 25.30 14.00 19.80
Trade and other payables 705.30 646.10 580.60 519.70 515.20
Liabilities towards income tax 68.00 54.70 41.40 49.70 58.80
Liabilities towards acquisitions - - - 3.00 0.50
Other current provisions 39.60 86.20 56.00 52.70 69.50
Other current financial liabilities 57.20 94.90 70.00 115.90 51.00
Document Page
Other current liabilities 304.80 145.70 121.60 124.90 107.90
Total (C) 1,195.40 1,056.60 894.90 879.90 822.70
Total Equity and Liabilities (A+B+C) 3,207.30 2,853.80 2,765.20 2,620.20 2,550.00
D. Non-current Assets
Property, plant and equipment 294.60 260.10 252.10 232.60 224.00
Intangible assets 437.50 412.90 423.10 403.30 391.40
Investments in associates - 16.60 16.50 15.20 15.20
Deferred tax assets 207.60 207.90 229.50 219.80 178.80
Other non-current financial assets 65.40 51.70 59.80 39.30 34.60
Other non-current assets 9.40 19.80 18.70 25.20 23.40
Total (D) 1,014.50 969.00 999.70 935.40 867.40
E. Current Assets
Inventories 915.10 778.50 718.90 657.00 571.50
Trade and other receivables 553.70 503.70 499.20 483.10 449.20
Receivables towards income tax 33.90 26.80 37.40 50.50 75.00
Cash and cash equivalents 463.70 415.00 326.70 338.80 401.50
Other current financial assets 111.20 66.70 114.10 76.80 93.60
Other current assets 115.20 94.10 69.20 78.60 91.80
Total (E) 2,192.80 1,884.80 1,765.50 1,684.80 1,682.60
Total Assets (D+E) 3,207.30 2,853.80 2,765.20 2,620.20 2,550.00
Puma
Statement of Profit or Loss
Amount in million €
Yearly Comparison
Particulars 2018 2017 2016 2015 2014
Net Sales 4,648.30 4,135.90 3,626.70 3,387.40 2,972.00
Less: Cost of sales (2,399.00) (2,181.50) (1,970.30) (1,847.20) (1,586.70)
Gross Profit 2,249.30 1,954.40 1,656.40 1,540.20 1,385.30
Add: Commission and Royalty income 16.30 15.80 15.70 16.50 19.40
Less: Operating Expenses (1,928.40) (1,725.60) (1,544.40) (1,460.50) (1,276.80)
Operating Profit 337.20 244.60 127.70 96.20 127.90
Add: Profit from associate segments (1.50) 1.60 1.20 1.00 1.30
chevron_up_icon
1 out of 29
circle_padding
hide_on_mobile
zoom_out_icon
[object Object]