University SPSS Analytical Report: PUN105 Assessment 2 on BMD Data
VerifiedAdded on 2022/10/31
|13
|2171
|122
Report
AI Summary
This SPSS analytical report presents a comprehensive analysis of bone mineral density (BMD) data, addressing the requirements of a PUN105 assessment. The report begins with descriptive statistics of demographic and lifestyle variables, including age, sex, ethnicity, BMI, and fracture history. It then explores the relationships between having had any fracture and various factors using chi-square tests. Furthermore, it investigates the relationship between Ward’s triangle BMD and mother's hip fracture history and race/ethnicity using one-way ANOVA. Correlation and multiple linear regression analyses are employed to examine the association between BMD and factors such as age, BMI, sex, and prednisone/cortisone use. Independent sample t-tests are used to compare Ward’s triangle BMD and L1 BMD. The report concludes with multiple linear regression to establish a direct link between BMD and other BMD measurements, providing detailed interpretations of the findings and statistical outputs. The report adheres to the specified methods, including tests of assumptions, and presents results in tables with corresponding interpretations, aligning with the assessment criteria for knowledge, analysis, and interpretation.
Running head: SPSS ANALYTICAL REPORT 1
SPSS Analytical Report
Name
Institution
Author’s Note
Word Count (1479) Excluding Tables, References and Appendix.
SPSS Analytical Report
Name
Institution
Author’s Note
Word Count (1479) Excluding Tables, References and Appendix.
Paraphrase This Document
Need a fresh take? Get an instant paraphrase of this document with our AI Paraphraser
SPSS ANALYTICAL REPORT 2
SPSS Analytical Report
Methods
The descriptive statistics for scale variable (continuous) involve the use of measures
of central tendency and dispersion (Gravetter & Wallnau, 2016). However, for categorical
variables, the descriptive statistics used in the analysis are frequency and count(percentages).
Next for the study of the relationship between categorical variables, the best approach is a
Chi-square test of association alongside crosstabulations (Ali & Bhaskar, 2016). In order to
describe the relationship between one categorical and one quantitative variable (Continuous
or discrete), we use a one-way analysis of variance (ANOVA) approach (Bowers, 2019).
Further, to describe the relationship between the quantitative variable (Continuous), we use
Pearson correlation coefficient statistics (Schober, Boer & Schwarte, 2018).
The last two sections of the report involve regression analysis and test of hypothesis.
Multiple linear regression was used to establish a direct link between response and
independent variables. The model fits interpretation was based on R-square value, and overall
goodness of fit was established on the F-statistic. Variables whose slope (parameters
estimate) are significant were interpreted based on the regression model and the type of the
variable. In testing for mean differences, student t-test was used under the assumption of
unequal variances. Finally, throughout the report, the decision criteria for rejection of null
hypothesis is alpha of 5% (that is 95% significance level) and p-value of the estimates.
In testing the average difference in two continuous variables with unknown standard
deviation, we use t-test (Kim, 2015). The hypothesis takes the following form:
H0: μ1 = μ2 ("the two-population means are equal")
H1: μ1 ≠ μ2 ("the two-population means are not equal")
Where μ1 and μ2 are the population means of Ward’s triangle BMD and the L1 BMD
respectively.
SPSS ANALYTICAL REPORT 3
Results
The results are presented in tables and description of key SPSS outputs under each
subheading.
Descriptive Statistics of Variables
This section entails descriptive statistics for the variables under investigation.
Demographic Variables
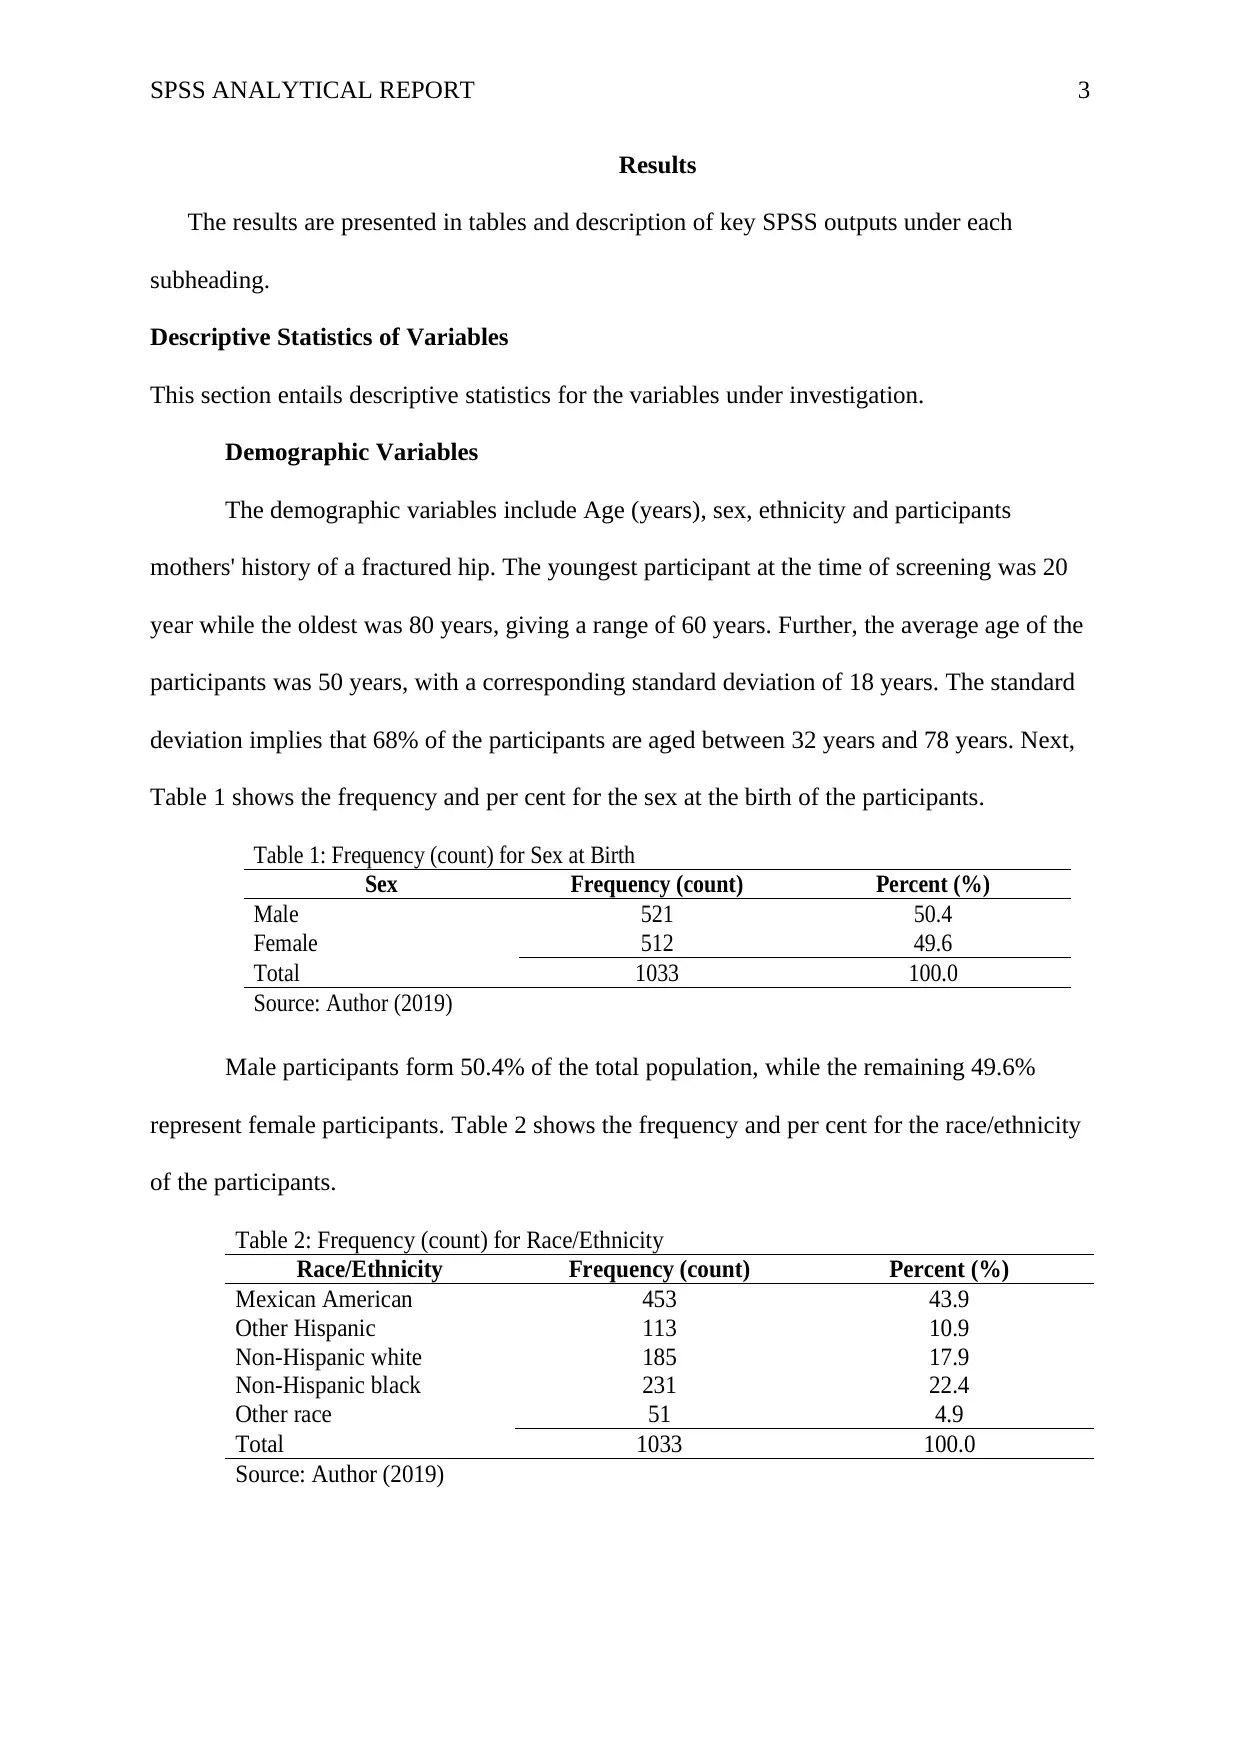
The demographic variables include Age (years), sex, ethnicity and participants
mothers' history of a fractured hip. The youngest participant at the time of screening was 20
year while the oldest was 80 years, giving a range of 60 years. Further, the average age of the
participants was 50 years, with a corresponding standard deviation of 18 years. The standard
deviation implies that 68% of the participants are aged between 32 years and 78 years. Next,
Table 1 shows the frequency and per cent for the sex at the birth of the participants.
Table 1: Frequency (count) for Sex at Birth
Sex Frequency (count) Percent (%)
Male 521 50.4
Female 512 49.6
Total 1033 100.0
Source: Author (2019)
Male participants form 50.4% of the total population, while the remaining 49.6%
represent female participants. Table 2 shows the frequency and per cent for the race/ethnicity
of the participants.
Table 2: Frequency (count) for Race/Ethnicity
Race/Ethnicity Frequency (count) Percent (%)
Mexican American 453 43.9
Other Hispanic 113 10.9
Non-Hispanic white 185 17.9
Non-Hispanic black 231 22.4
Other race 51 4.9
Total 1033 100.0
Source: Author (2019)
Results
The results are presented in tables and description of key SPSS outputs under each
subheading.
Descriptive Statistics of Variables
This section entails descriptive statistics for the variables under investigation.
Demographic Variables
The demographic variables include Age (years), sex, ethnicity and participants
mothers' history of a fractured hip. The youngest participant at the time of screening was 20
year while the oldest was 80 years, giving a range of 60 years. Further, the average age of the
participants was 50 years, with a corresponding standard deviation of 18 years. The standard
deviation implies that 68% of the participants are aged between 32 years and 78 years. Next,
Table 1 shows the frequency and per cent for the sex at the birth of the participants.
Table 1: Frequency (count) for Sex at Birth
Sex Frequency (count) Percent (%)
Male 521 50.4
Female 512 49.6
Total 1033 100.0
Source: Author (2019)
Male participants form 50.4% of the total population, while the remaining 49.6%
represent female participants. Table 2 shows the frequency and per cent for the race/ethnicity
of the participants.
Table 2: Frequency (count) for Race/Ethnicity
Race/Ethnicity Frequency (count) Percent (%)
Mexican American 453 43.9
Other Hispanic 113 10.9
Non-Hispanic white 185 17.9
Non-Hispanic black 231 22.4
Other race 51 4.9
Total 1033 100.0
Source: Author (2019)
⊘ This is a preview!⊘
Do you want full access?
Subscribe today to unlock all pages.
Trusted by 1+ million students worldwide
SPSS ANALYTICAL REPORT 4
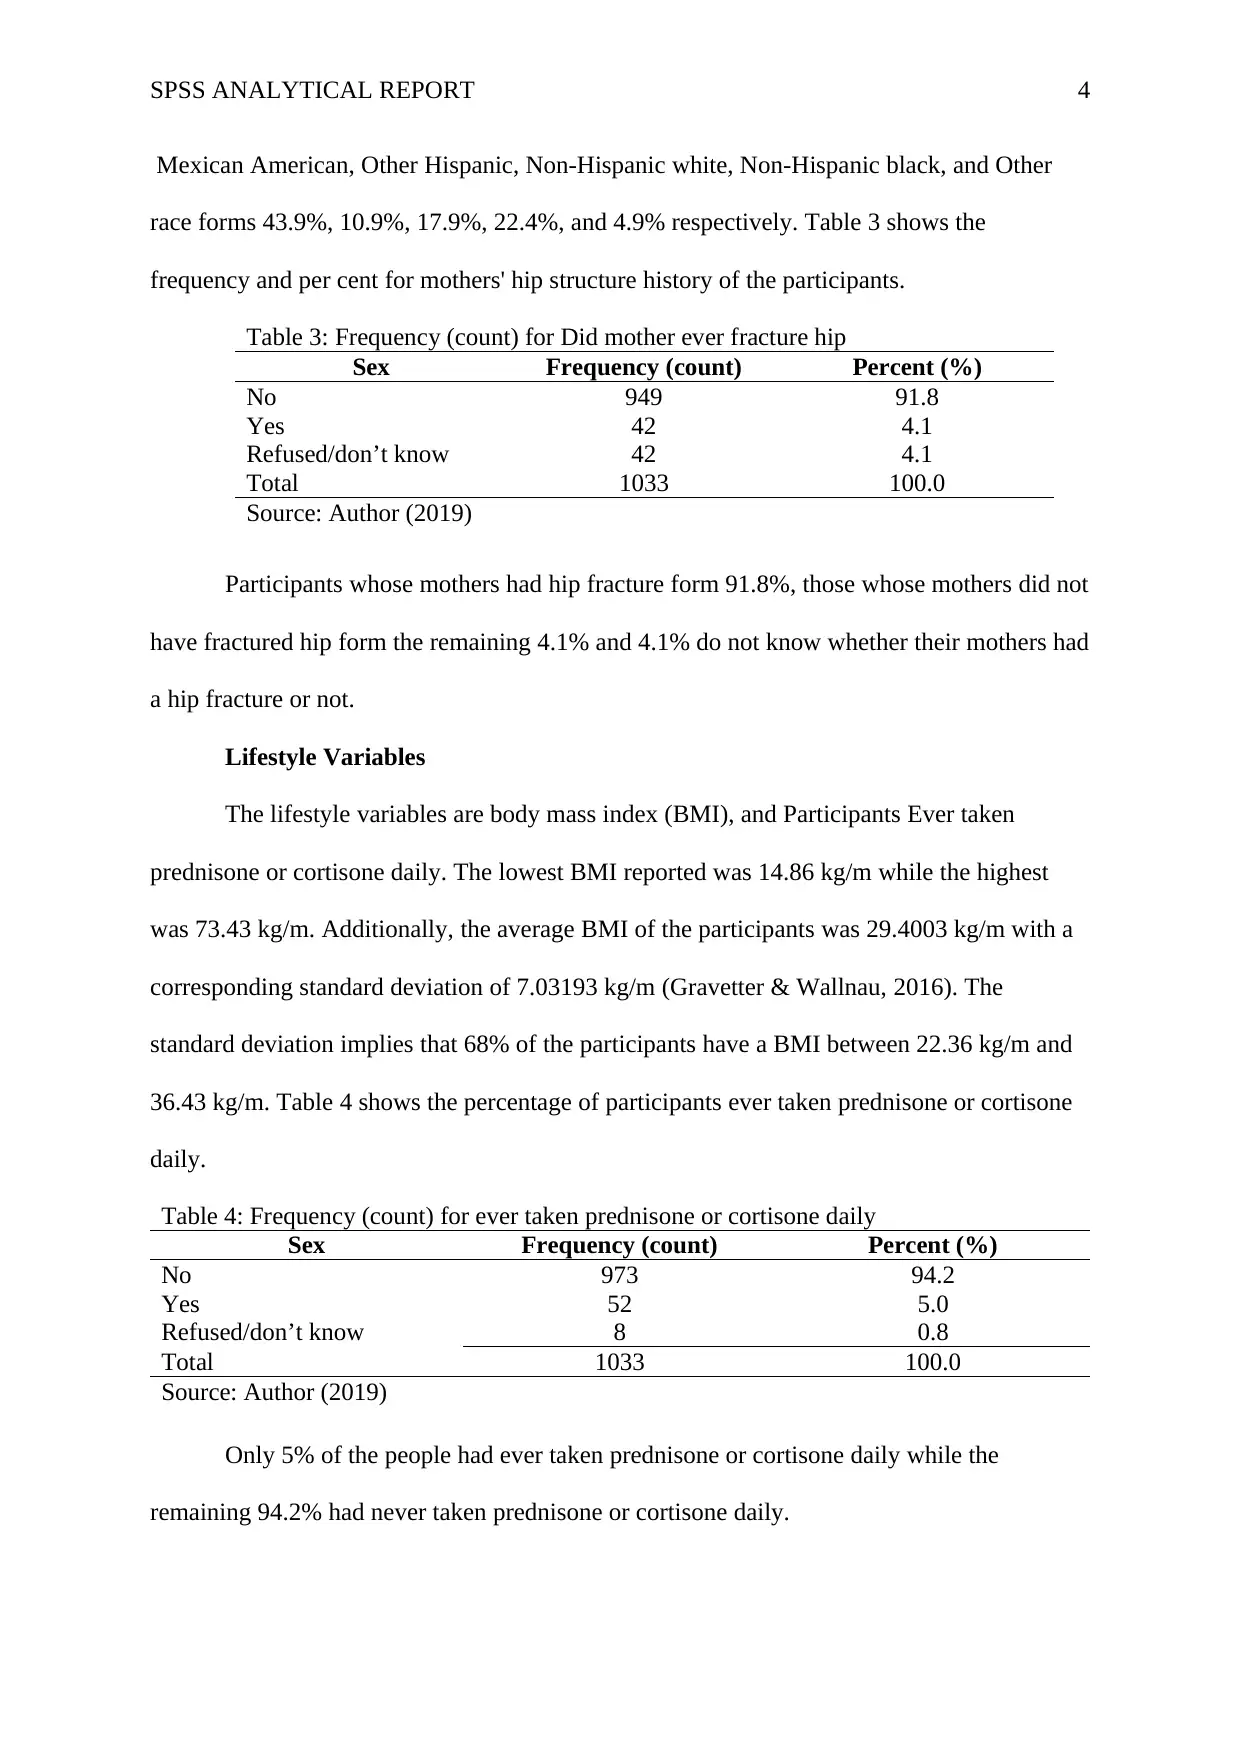
Mexican American, Other Hispanic, Non-Hispanic white, Non-Hispanic black, and Other
race forms 43.9%, 10.9%, 17.9%, 22.4%, and 4.9% respectively. Table 3 shows the
frequency and per cent for mothers' hip structure history of the participants.
Table 3: Frequency (count) for Did mother ever fracture hip
Sex Frequency (count) Percent (%)
No 949 91.8
Yes 42 4.1
Refused/don’t know 42 4.1
Total 1033 100.0
Source: Author (2019)
Participants whose mothers had hip fracture form 91.8%, those whose mothers did not
have fractured hip form the remaining 4.1% and 4.1% do not know whether their mothers had
a hip fracture or not.
Lifestyle Variables
The lifestyle variables are body mass index (BMI), and Participants Ever taken
prednisone or cortisone daily. The lowest BMI reported was 14.86 kg/m while the highest
was 73.43 kg/m. Additionally, the average BMI of the participants was 29.4003 kg/m with a
corresponding standard deviation of 7.03193 kg/m (Gravetter & Wallnau, 2016). The
standard deviation implies that 68% of the participants have a BMI between 22.36 kg/m and
36.43 kg/m. Table 4 shows the percentage of participants ever taken prednisone or cortisone
daily.
Table 4: Frequency (count) for ever taken prednisone or cortisone daily
Sex Frequency (count) Percent (%)
No 973 94.2
Yes 52 5.0
Refused/don’t know 8 0.8
Total 1033 100.0
Source: Author (2019)
Only 5% of the people had ever taken prednisone or cortisone daily while the
remaining 94.2% had never taken prednisone or cortisone daily.
Paraphrase This Document
Need a fresh take? Get an instant paraphrase of this document with our AI Paraphraser
SPSS ANALYTICAL REPORT 5
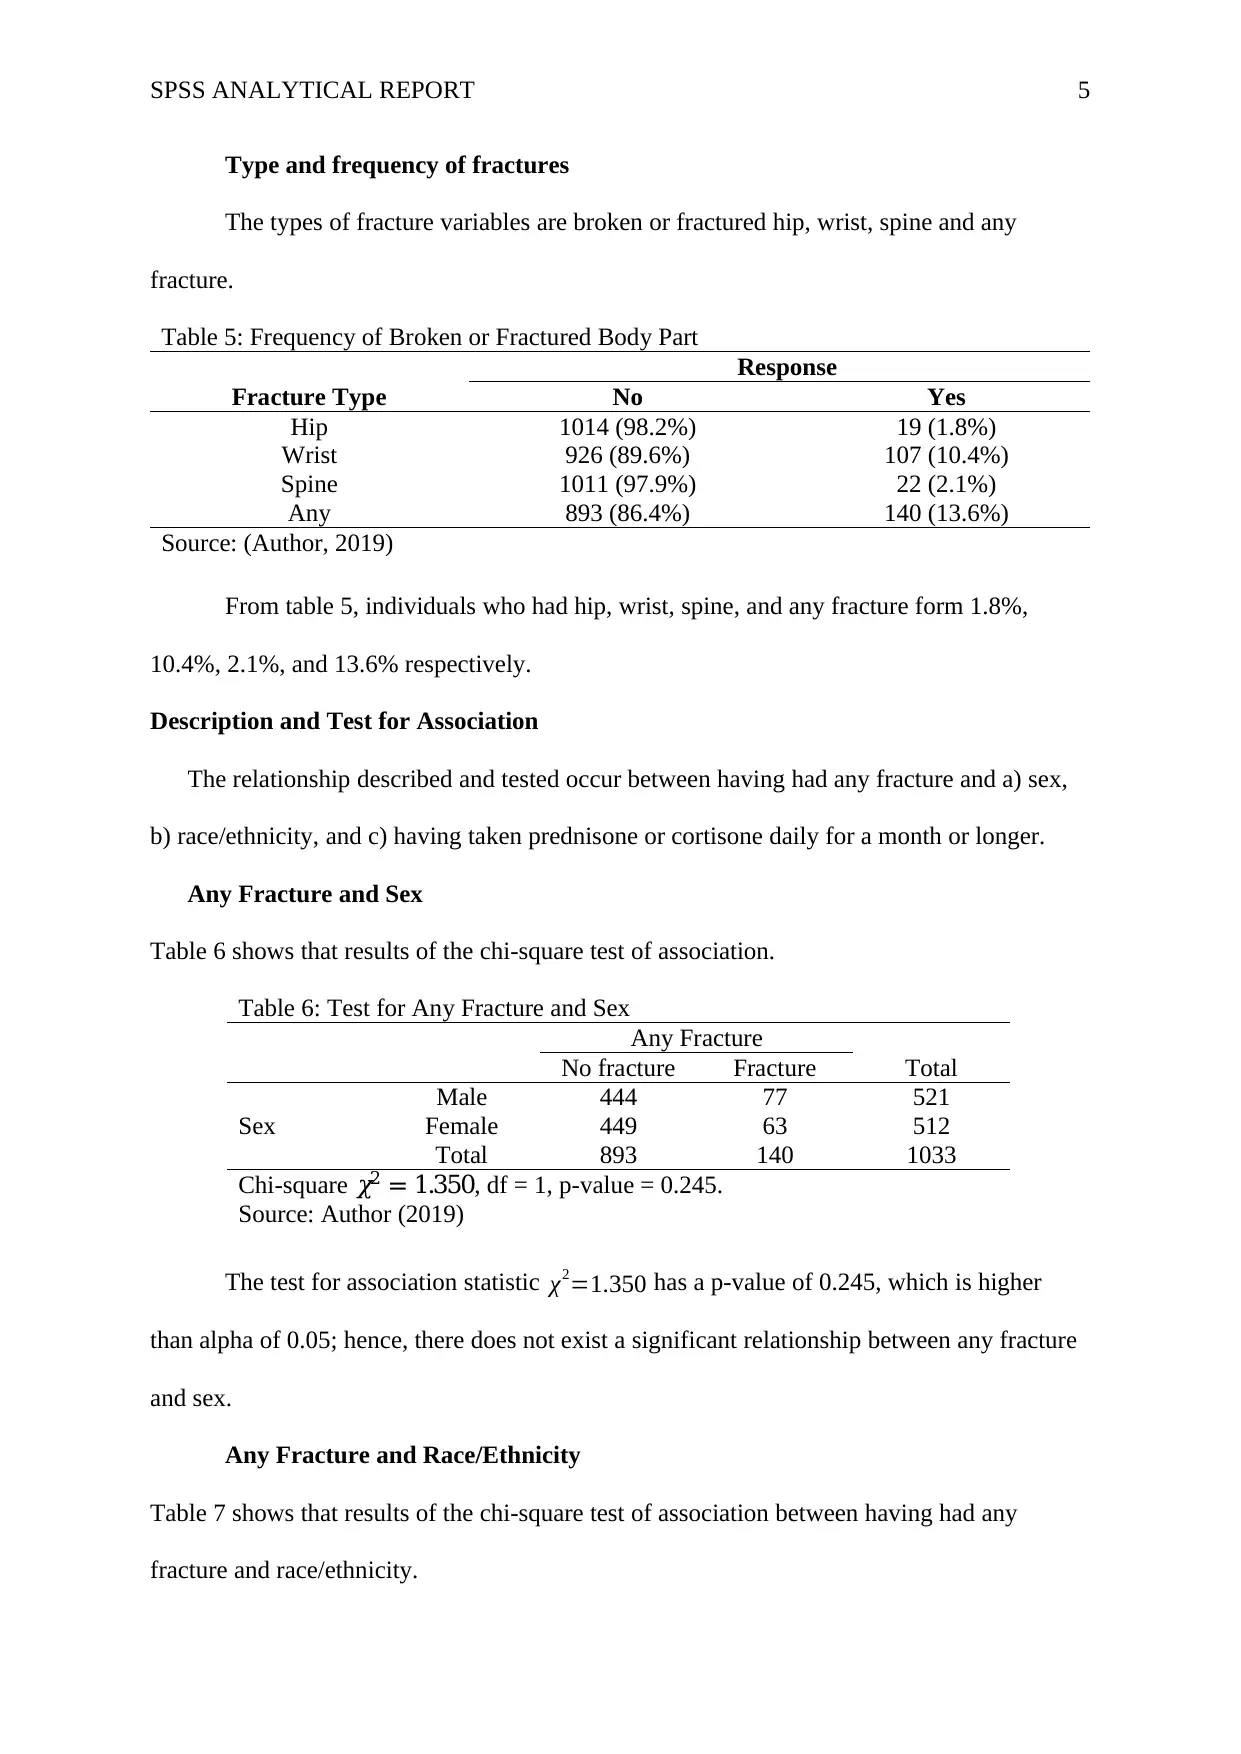
Type and frequency of fractures
The types of fracture variables are broken or fractured hip, wrist, spine and any
fracture.
Table 5: Frequency of Broken or Fractured Body Part
Response
Fracture Type No Yes
Hip 1014 (98.2%) 19 (1.8%)
Wrist 926 (89.6%) 107 (10.4%)
Spine 1011 (97.9%) 22 (2.1%)
Any 893 (86.4%) 140 (13.6%)
Source: (Author, 2019)
From table 5, individuals who had hip, wrist, spine, and any fracture form 1.8%,
10.4%, 2.1%, and 13.6% respectively.
Description and Test for Association
The relationship described and tested occur between having had any fracture and a) sex,
b) race/ethnicity, and c) having taken prednisone or cortisone daily for a month or longer.
Any Fracture and Sex
Table 6 shows that results of the chi-square test of association.
Table 6: Test for Any Fracture and Sex
Any Fracture
No fracture Fracture Total
Sex
Male 444 77 521
Female 449 63 512
Total 893 140 1033
Chi-square 𝜒2 = 1.350, df = 1, p-value = 0.245.
Source: Author (2019)
The test for association statistic χ2=1.350 has a p-value of 0.245, which is higher
than alpha of 0.05; hence, there does not exist a significant relationship between any fracture
and sex.
Any Fracture and Race/Ethnicity
Table 7 shows that results of the chi-square test of association between having had any
fracture and race/ethnicity.
SPSS ANALYTICAL REPORT 6
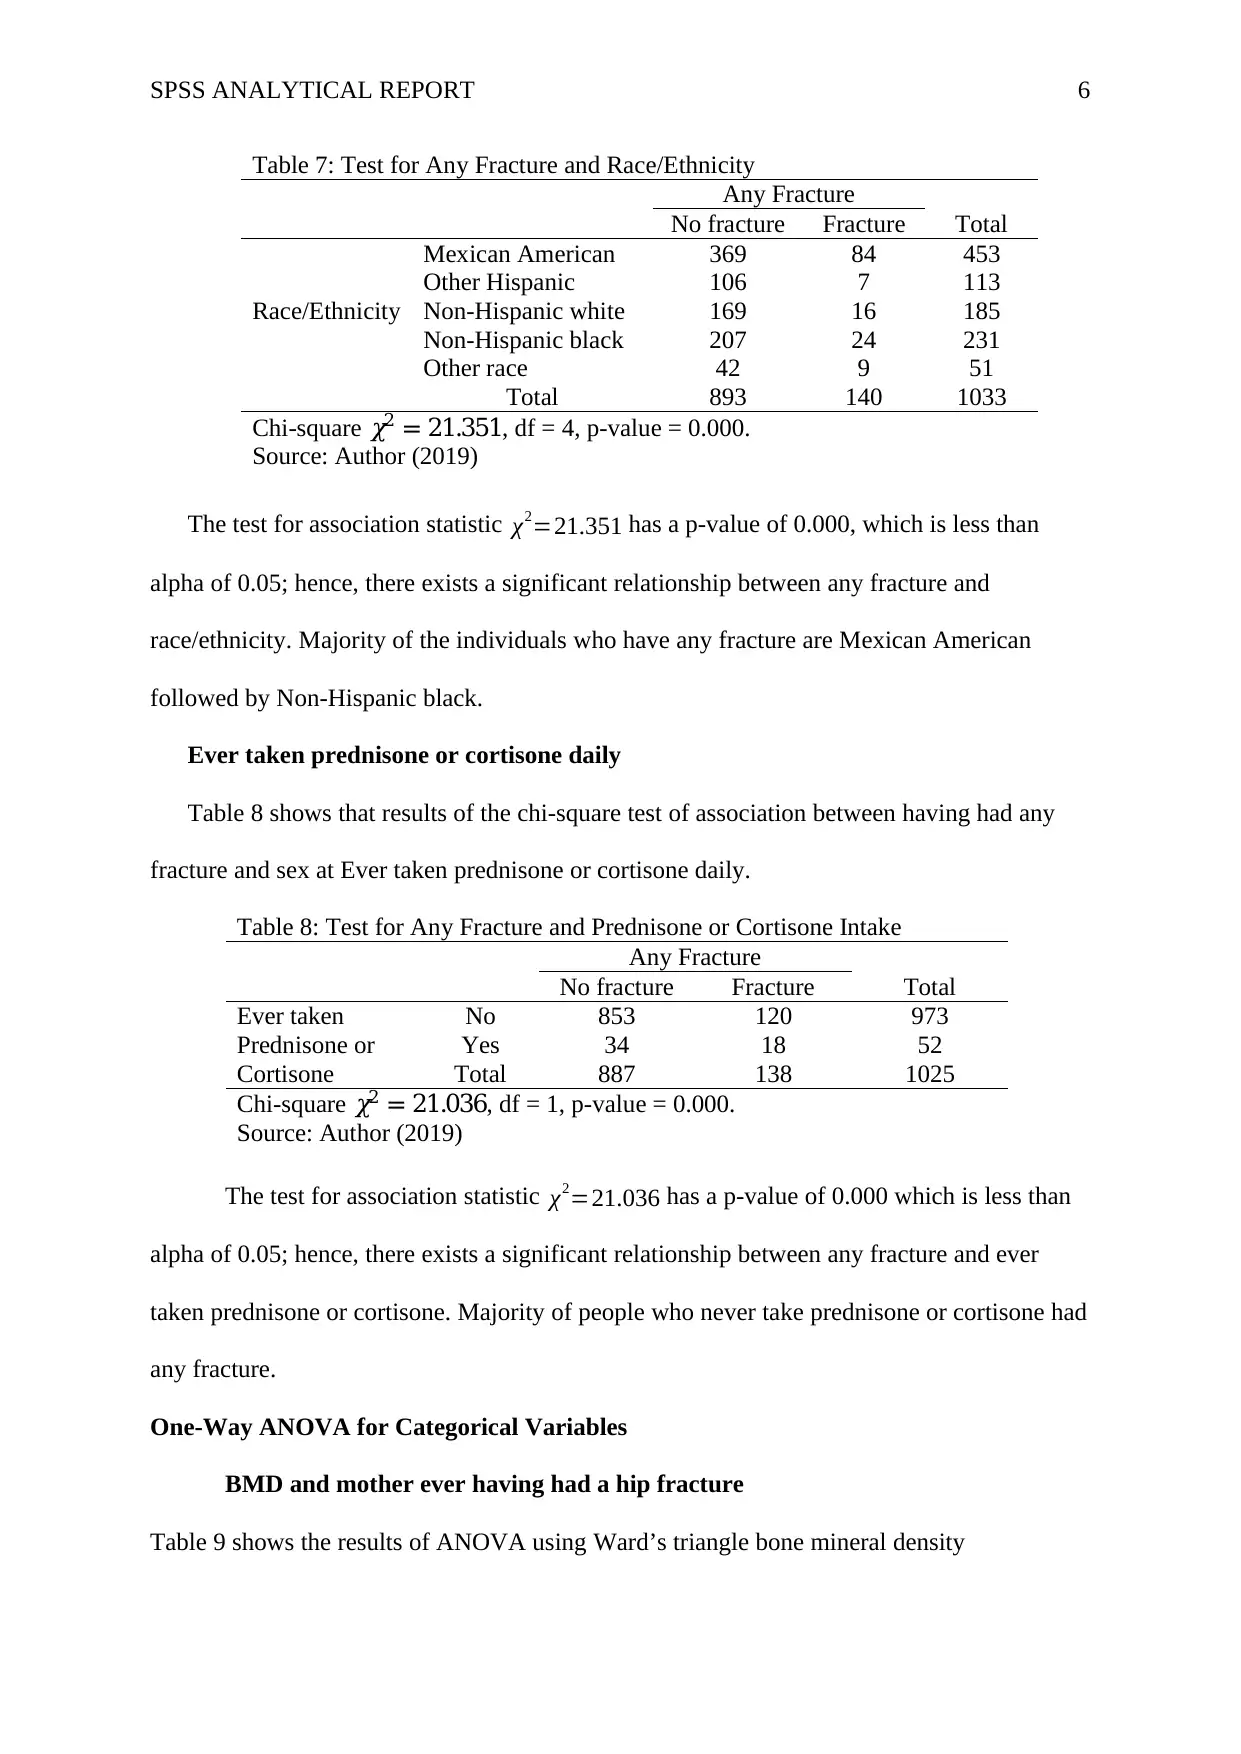
Table 7: Test for Any Fracture and Race/Ethnicity
Any Fracture
No fracture Fracture Total
Race/Ethnicity
Mexican American 369 84 453
Other Hispanic 106 7 113
Non-Hispanic white 169 16 185
Non-Hispanic black 207 24 231
Other race 42 9 51
Total 893 140 1033
Chi-square 𝜒2 = 21.351, df = 4, p-value = 0.000.
Source: Author (2019)
The test for association statistic χ2=21.351 has a p-value of 0.000, which is less than
alpha of 0.05; hence, there exists a significant relationship between any fracture and
race/ethnicity. Majority of the individuals who have any fracture are Mexican American
followed by Non-Hispanic black.
Ever taken prednisone or cortisone daily
Table 8 shows that results of the chi-square test of association between having had any
fracture and sex at Ever taken prednisone or cortisone daily.
Table 8: Test for Any Fracture and Prednisone or Cortisone Intake
Any Fracture
No fracture Fracture Total
Ever taken
Prednisone or
No 853 120 973
Yes 34 18 52
Cortisone Total 887 138 1025
Chi-square 𝜒2 = 21.036, df = 1, p-value = 0.000.
Source: Author (2019)
The test for association statistic χ2=21.036 has a p-value of 0.000 which is less than
alpha of 0.05; hence, there exists a significant relationship between any fracture and ever
taken prednisone or cortisone. Majority of people who never take prednisone or cortisone had
any fracture.
One-Way ANOVA for Categorical Variables
BMD and mother ever having had a hip fracture
Table 9 shows the results of ANOVA using Ward’s triangle bone mineral density
⊘ This is a preview!⊘
Do you want full access?
Subscribe today to unlock all pages.
Trusted by 1+ million students worldwide
SPSS ANALYTICAL REPORT 7
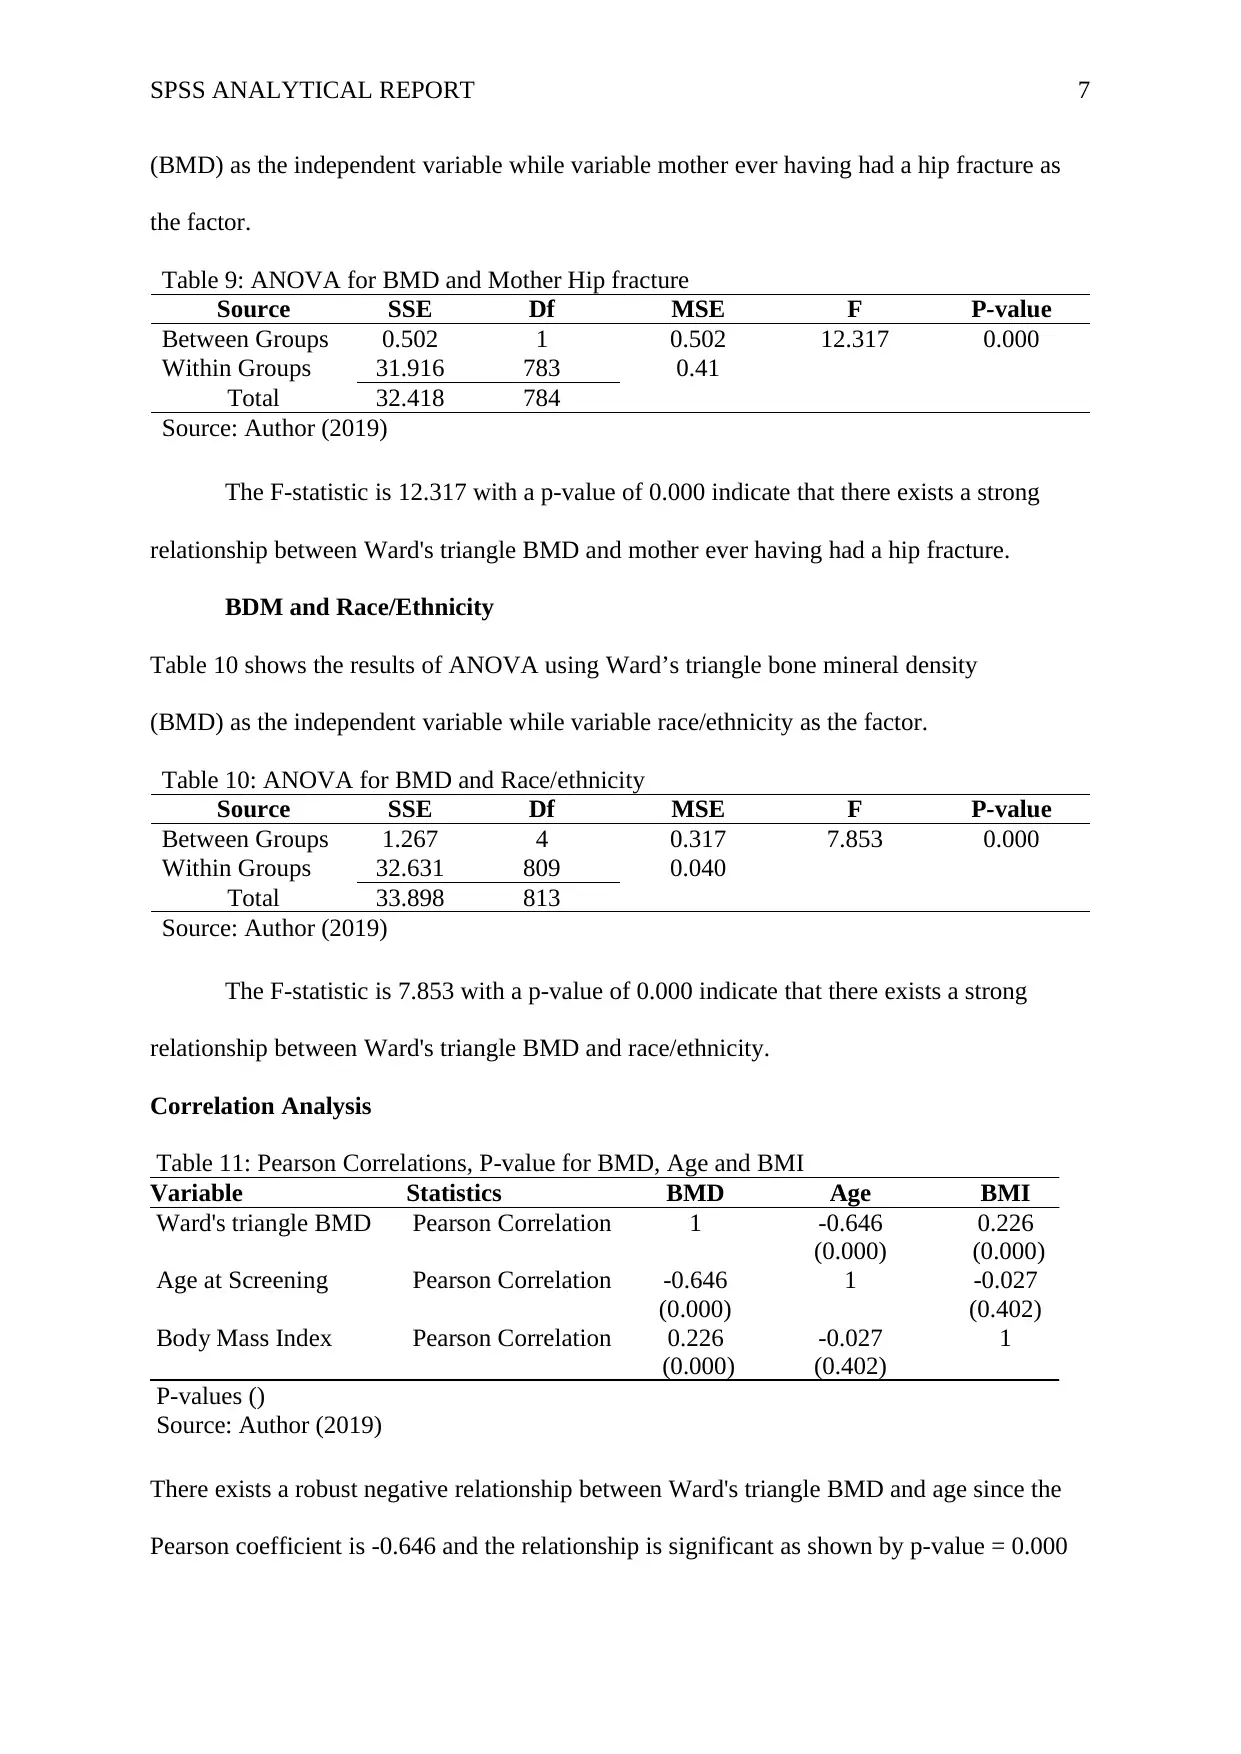
(BMD) as the independent variable while variable mother ever having had a hip fracture as
the factor.
Table 9: ANOVA for BMD and Mother Hip fracture
Source SSE Df MSE F P-value
Between Groups 0.502 1 0.502 12.317 0.000
Within Groups 31.916 783 0.41
Total 32.418 784
Source: Author (2019)
The F-statistic is 12.317 with a p-value of 0.000 indicate that there exists a strong
relationship between Ward's triangle BMD and mother ever having had a hip fracture.
BDM and Race/Ethnicity
Table 10 shows the results of ANOVA using Ward’s triangle bone mineral density
(BMD) as the independent variable while variable race/ethnicity as the factor.
Table 10: ANOVA for BMD and Race/ethnicity
Source SSE Df MSE F P-value
Between Groups 1.267 4 0.317 7.853 0.000
Within Groups 32.631 809 0.040
Total 33.898 813
Source: Author (2019)
The F-statistic is 7.853 with a p-value of 0.000 indicate that there exists a strong
relationship between Ward's triangle BMD and race/ethnicity.
Correlation Analysis
Table 11: Pearson Correlations, P-value for BMD, Age and BMI
Variable Statistics BMD Age BMI
Ward's triangle BMD Pearson Correlation 1 -0.646
(0.000)
0.226
(0.000)
Age at Screening Pearson Correlation -0.646
(0.000)
1 -0.027
(0.402)
Body Mass Index Pearson Correlation 0.226
(0.000)
-0.027
(0.402)
1
P-values ()
Source: Author (2019)
There exists a robust negative relationship between Ward's triangle BMD and age since the
Pearson coefficient is -0.646 and the relationship is significant as shown by p-value = 0.000
Paraphrase This Document
Need a fresh take? Get an instant paraphrase of this document with our AI Paraphraser
SPSS ANALYTICAL REPORT 8
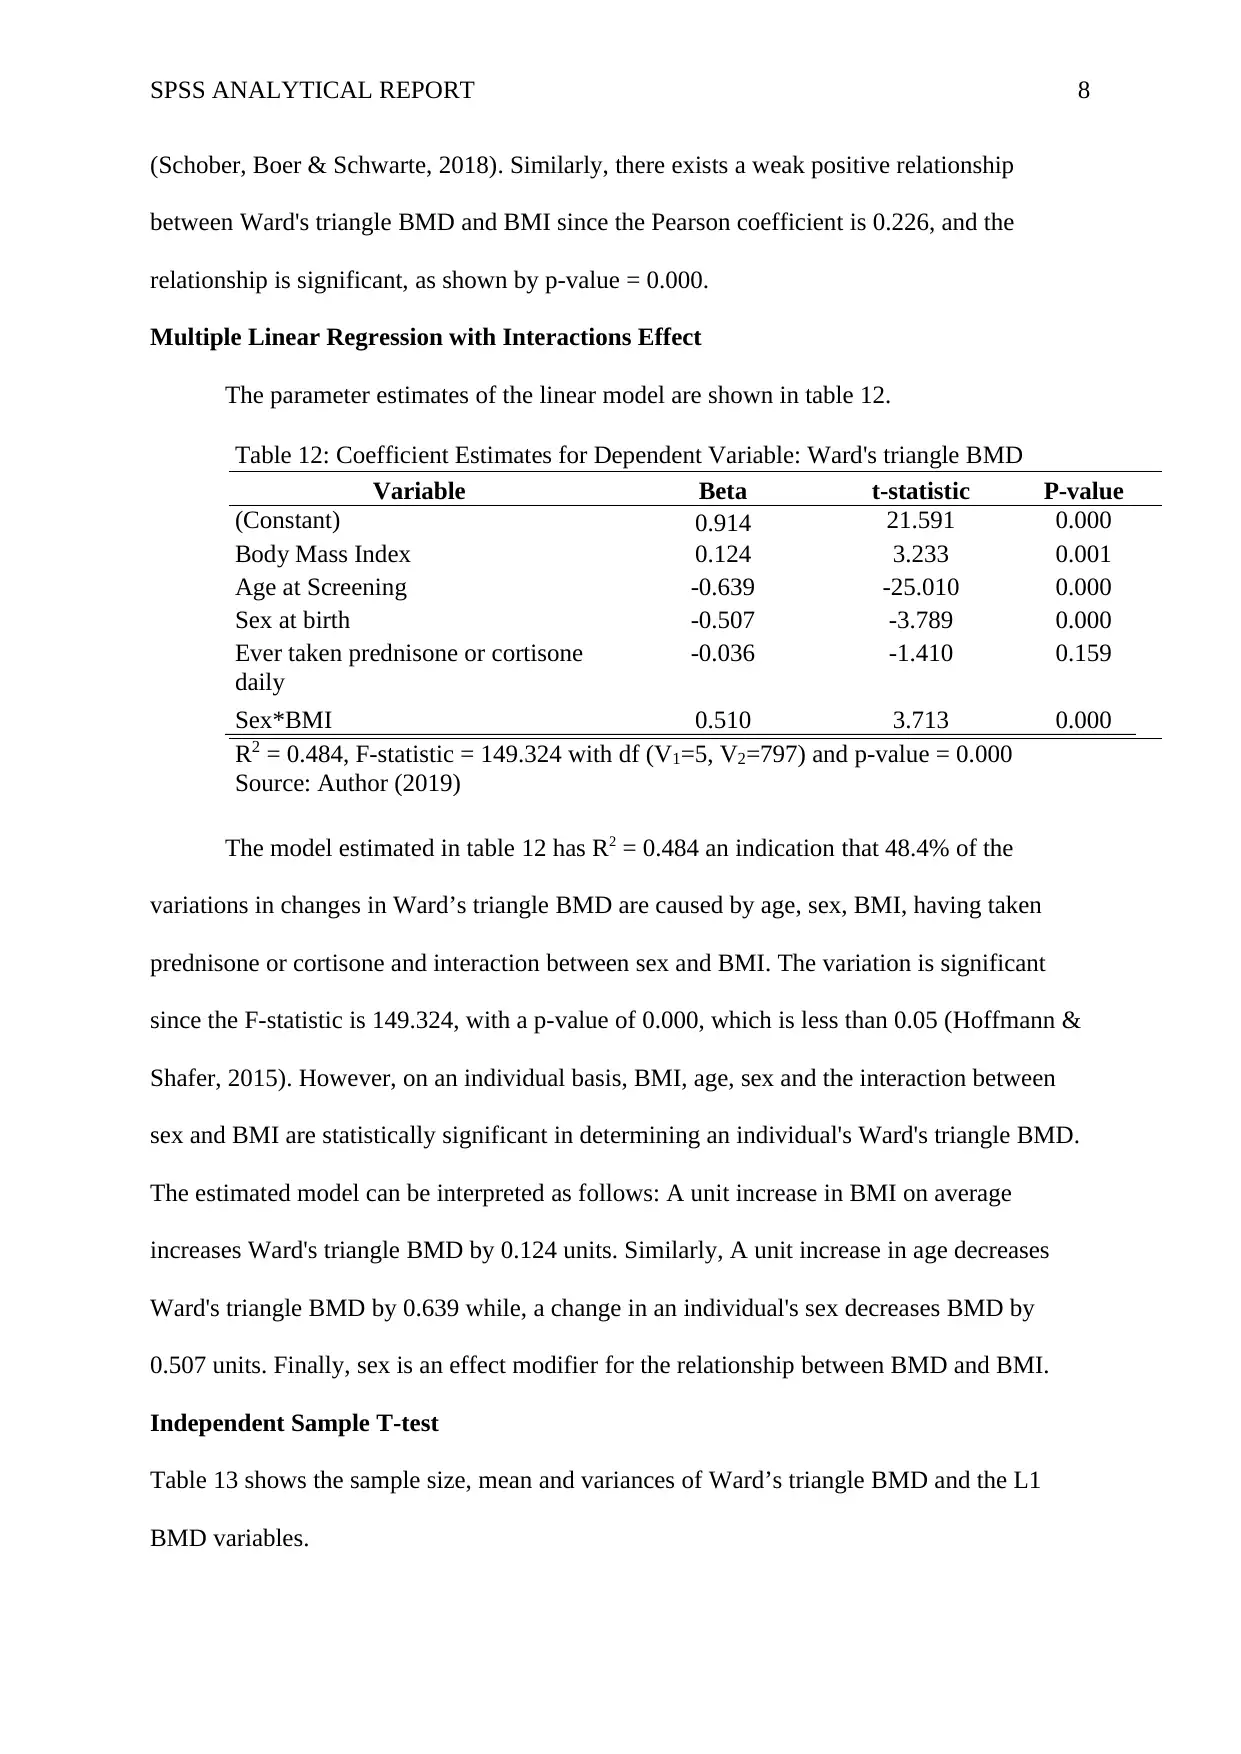
(Schober, Boer & Schwarte, 2018). Similarly, there exists a weak positive relationship
between Ward's triangle BMD and BMI since the Pearson coefficient is 0.226, and the
relationship is significant, as shown by p-value = 0.000.
Multiple Linear Regression with Interactions Effect
The parameter estimates of the linear model are shown in table 12.
Table 12: Coefficient Estimates for Dependent Variable: Ward's triangle BMD
Variable Beta t-statistic P-value
(Constant) 0.914 21.591 0.000
Body Mass Index 0.124 3.233 0.001
Age at Screening -0.639 -25.010 0.000
Sex at birth -0.507 -3.789 0.000
Ever taken prednisone or cortisone
daily
-0.036 -1.410 0.159
Sex*BMI 0.510 3.713 0.000
R 2 = 0.484, F-statistic = 149.324 with df (V 1=5, V2=797) and p-value = 0.000
Source: Author (2019)
The model estimated in table 12 has R2 = 0.484 an indication that 48.4% of the
variations in changes in Ward’s triangle BMD are caused by age, sex, BMI, having taken
prednisone or cortisone and interaction between sex and BMI. The variation is significant
since the F-statistic is 149.324, with a p-value of 0.000, which is less than 0.05 (Hoffmann &
Shafer, 2015). However, on an individual basis, BMI, age, sex and the interaction between
sex and BMI are statistically significant in determining an individual's Ward's triangle BMD.
The estimated model can be interpreted as follows: A unit increase in BMI on average
increases Ward's triangle BMD by 0.124 units. Similarly, A unit increase in age decreases
Ward's triangle BMD by 0.639 while, a change in an individual's sex decreases BMD by
0.507 units. Finally, sex is an effect modifier for the relationship between BMD and BMI.
Independent Sample T-test
Table 13 shows the sample size, mean and variances of Ward’s triangle BMD and the L1
BMD variables.
SPSS ANALYTICAL REPORT 9
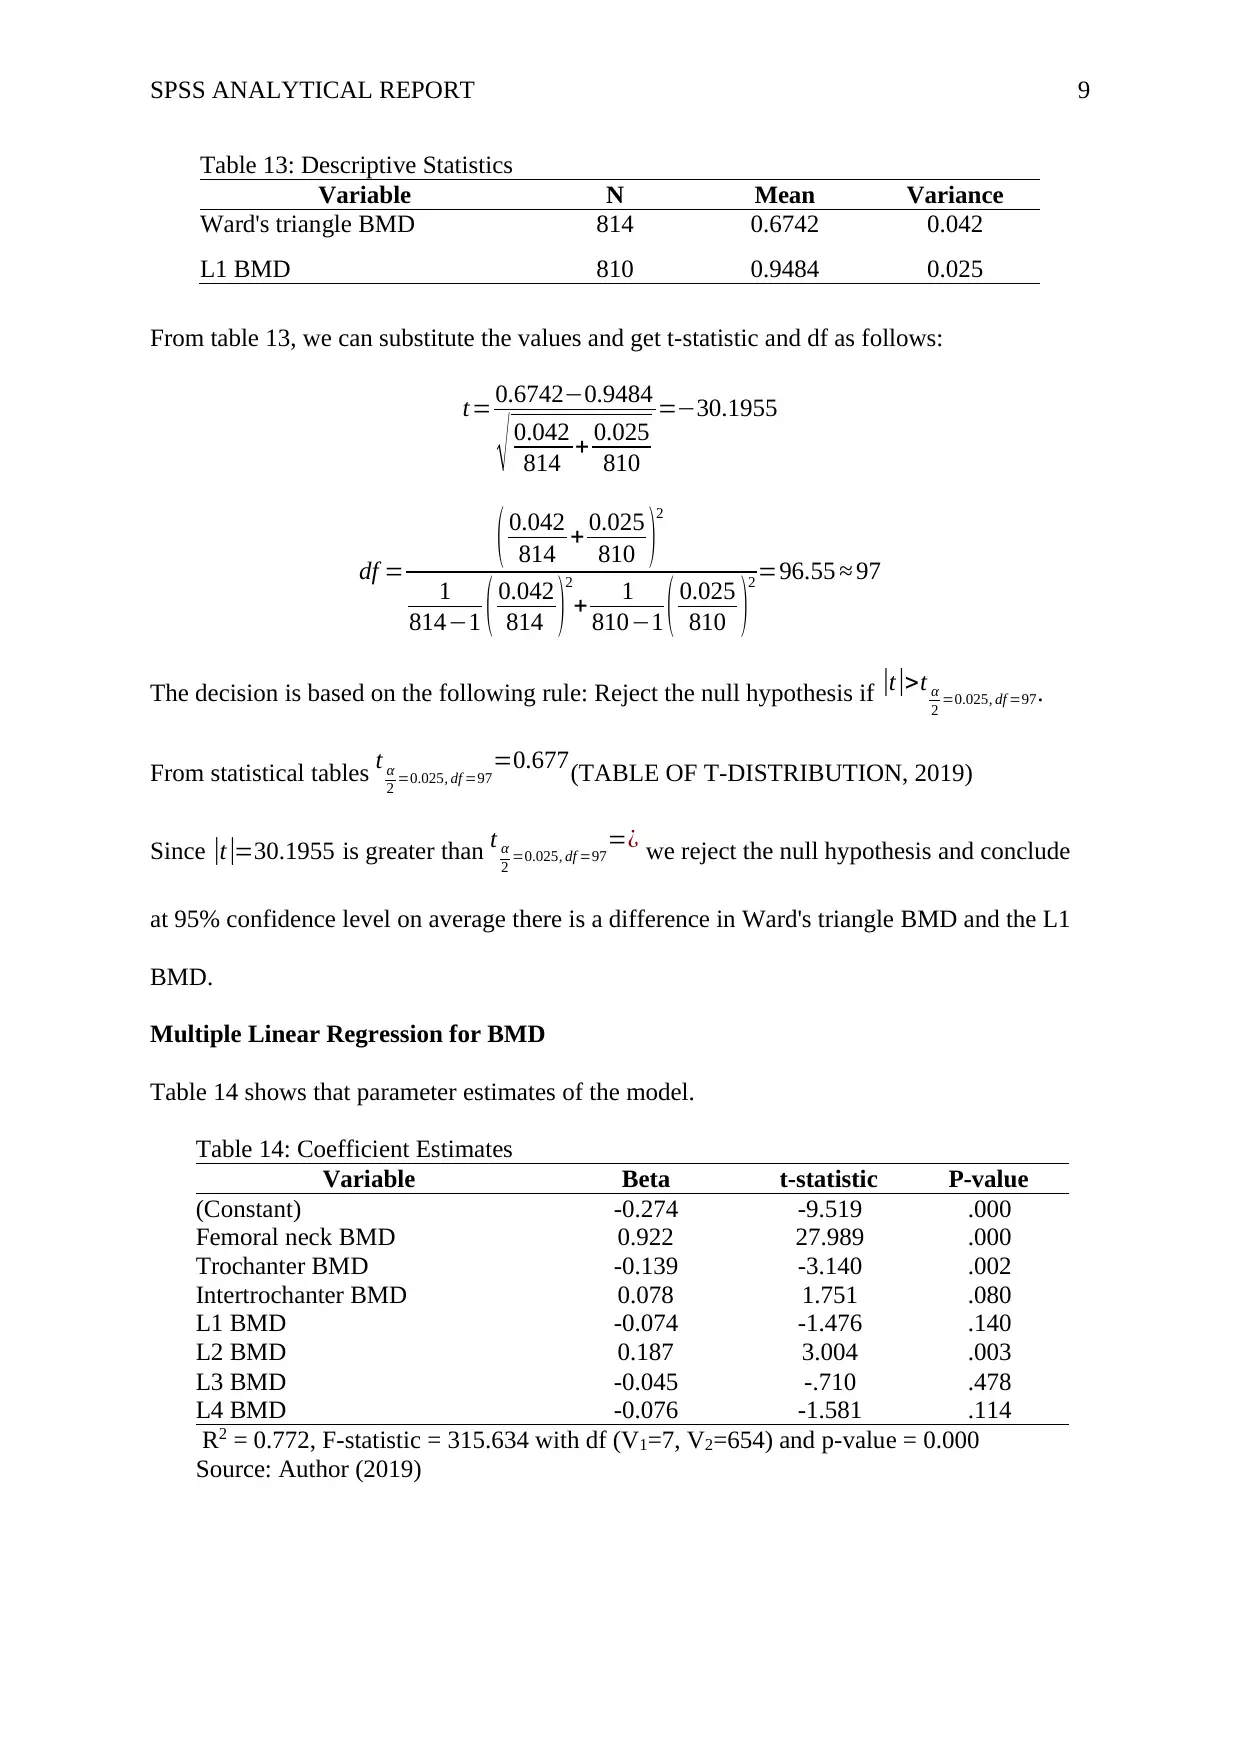
Table 13: Descriptive Statistics
Variable N Mean Variance
Ward's triangle BMD 814 0.6742 0.042
L1 BMD 810 0.9484 0.025
From table 13, we can substitute the values and get t-statistic and df as follows:
t= 0.6742−0.9484
√ 0.042
814 + 0.025
810
=−30.1955
df = ( 0.042
814 + 0.025
810 )
2
1
814−1 ( 0.042
814 )
2
+ 1
810−1 ( 0.025
810 )
2 =96.55 ≈ 97
The decision is based on the following rule: Reject the null hypothesis if |t |>t α
2 =0.025, df =97.
From statistical tables t α
2 =0.025, df =97=0.677(TABLE OF T-DISTRIBUTION, 2019)
Since |t |=30.1955 is greater than t α
2 =0.025, df =97=¿ we reject the null hypothesis and conclude
at 95% confidence level on average there is a difference in Ward's triangle BMD and the L1
BMD.
Multiple Linear Regression for BMD
Table 14 shows that parameter estimates of the model.
Table 14: Coefficient Estimates
Variable Beta t-statistic P-value
(Constant) -0.274 -9.519 .000
Femoral neck BMD 0.922 27.989 .000
Trochanter BMD -0.139 -3.140 .002
Intertrochanter BMD 0.078 1.751 .080
L1 BMD -0.074 -1.476 .140
L2 BMD 0.187 3.004 .003
L3 BMD -0.045 -.710 .478
L4 BMD -0.076 -1.581 .114
R2 = 0.772, F-statistic = 315.634 with df (V1=7, V2=654) and p-value = 0.000
Source: Author (2019)
⊘ This is a preview!⊘
Do you want full access?
Subscribe today to unlock all pages.
Trusted by 1+ million students worldwide
SPSS ANALYTICAL REPORT 10
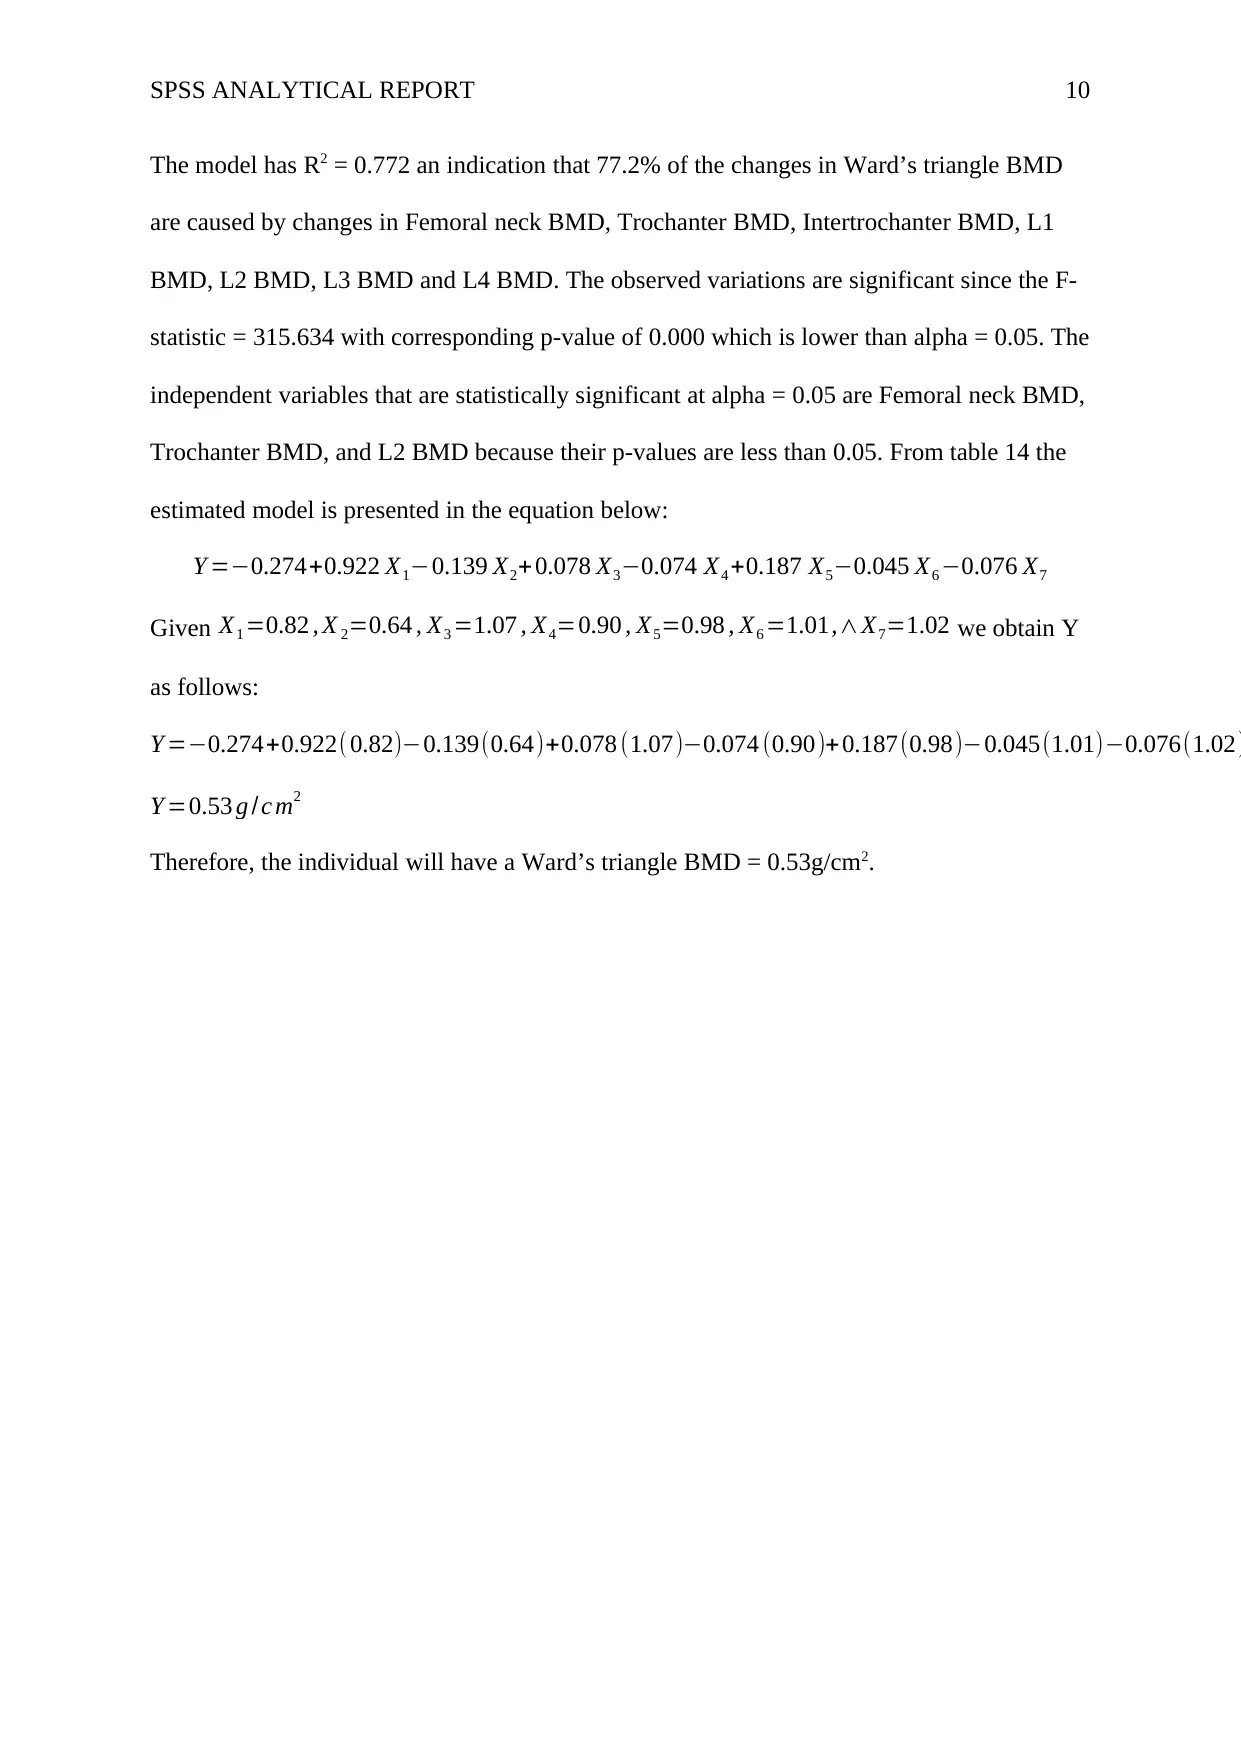
The model has R2 = 0.772 an indication that 77.2% of the changes in Ward’s triangle BMD
are caused by changes in Femoral neck BMD, Trochanter BMD, Intertrochanter BMD, L1
BMD, L2 BMD, L3 BMD and L4 BMD. The observed variations are significant since the F-
statistic = 315.634 with corresponding p-value of 0.000 which is lower than alpha = 0.05. The
independent variables that are statistically significant at alpha = 0.05 are Femoral neck BMD,
Trochanter BMD, and L2 BMD because their p-values are less than 0.05. From table 14 the
estimated model is presented in the equation below:
Y =−0.274+0.922 X1−0.139 X2+ 0.078 X3−0.074 X4 +0.187 X5−0.045 X6 −0.076 X7
Given X1 =0.82 , X 2=0.64 , X3 =1.07 , X4=0.90 , X5=0.98 , X6 =1.01,∧X7=1.02 we obtain Y
as follows:
Y =−0.274+0.922( 0.82)−0.139(0.64)+0.078 (1.07)−0.074 (0.90)+0.187(0.98)−0.045(1.01)−0.076(1.02)
Y =0.53 g /c m2
Therefore, the individual will have a Ward’s triangle BMD = 0.53g/cm2.
Paraphrase This Document
Need a fresh take? Get an instant paraphrase of this document with our AI Paraphraser
SPSS ANALYTICAL REPORT 11
References
Ali, Z., & Bhaskar, S. B. (2016). Basic statistical tools in research and data analysis. Indian
journal of anaesthesia, 60(9), 662.
Bowers, D. (2019). Medical statistics from scratch: an introduction for health professionals.
John Wiley & Sons.
Gravetter, F. J., & Wallnau, L. B. (2016). Statistics for the behavioral sciences. Cengage
Learning.
Harrell Jr, F. E. (2015). Regression modeling strategies: with applications to linear models,
logistic and ordinal regression, and survival analysis. Springer.
Hoffmann, J. P., & Shafer, K. (2015). Linear regression analysis. Washington, DC: NASW
Press.
Kim, T. K. (2015). T-test as a parametric statistic. Korean Journal of anesthesiology, 68(6),
540.
Schober, P., Boer, C., & Schwarte, L. A. (2018). Correlation coefficients: appropriate use and
interpretation. Anesthesia & Analgesia, 126(5), 1763-1768.
TABLE OF T-DISTRIBUTION. (2019). Web.stanford.edu. Retrieved 22 September 2019,
from https://web.stanford.edu/dept/radiology/cgi-bin/classes/stats_data_analysis/
lesson_4/234_5_e.html
SPSS ANALYTICAL REPORT 12
Appendix
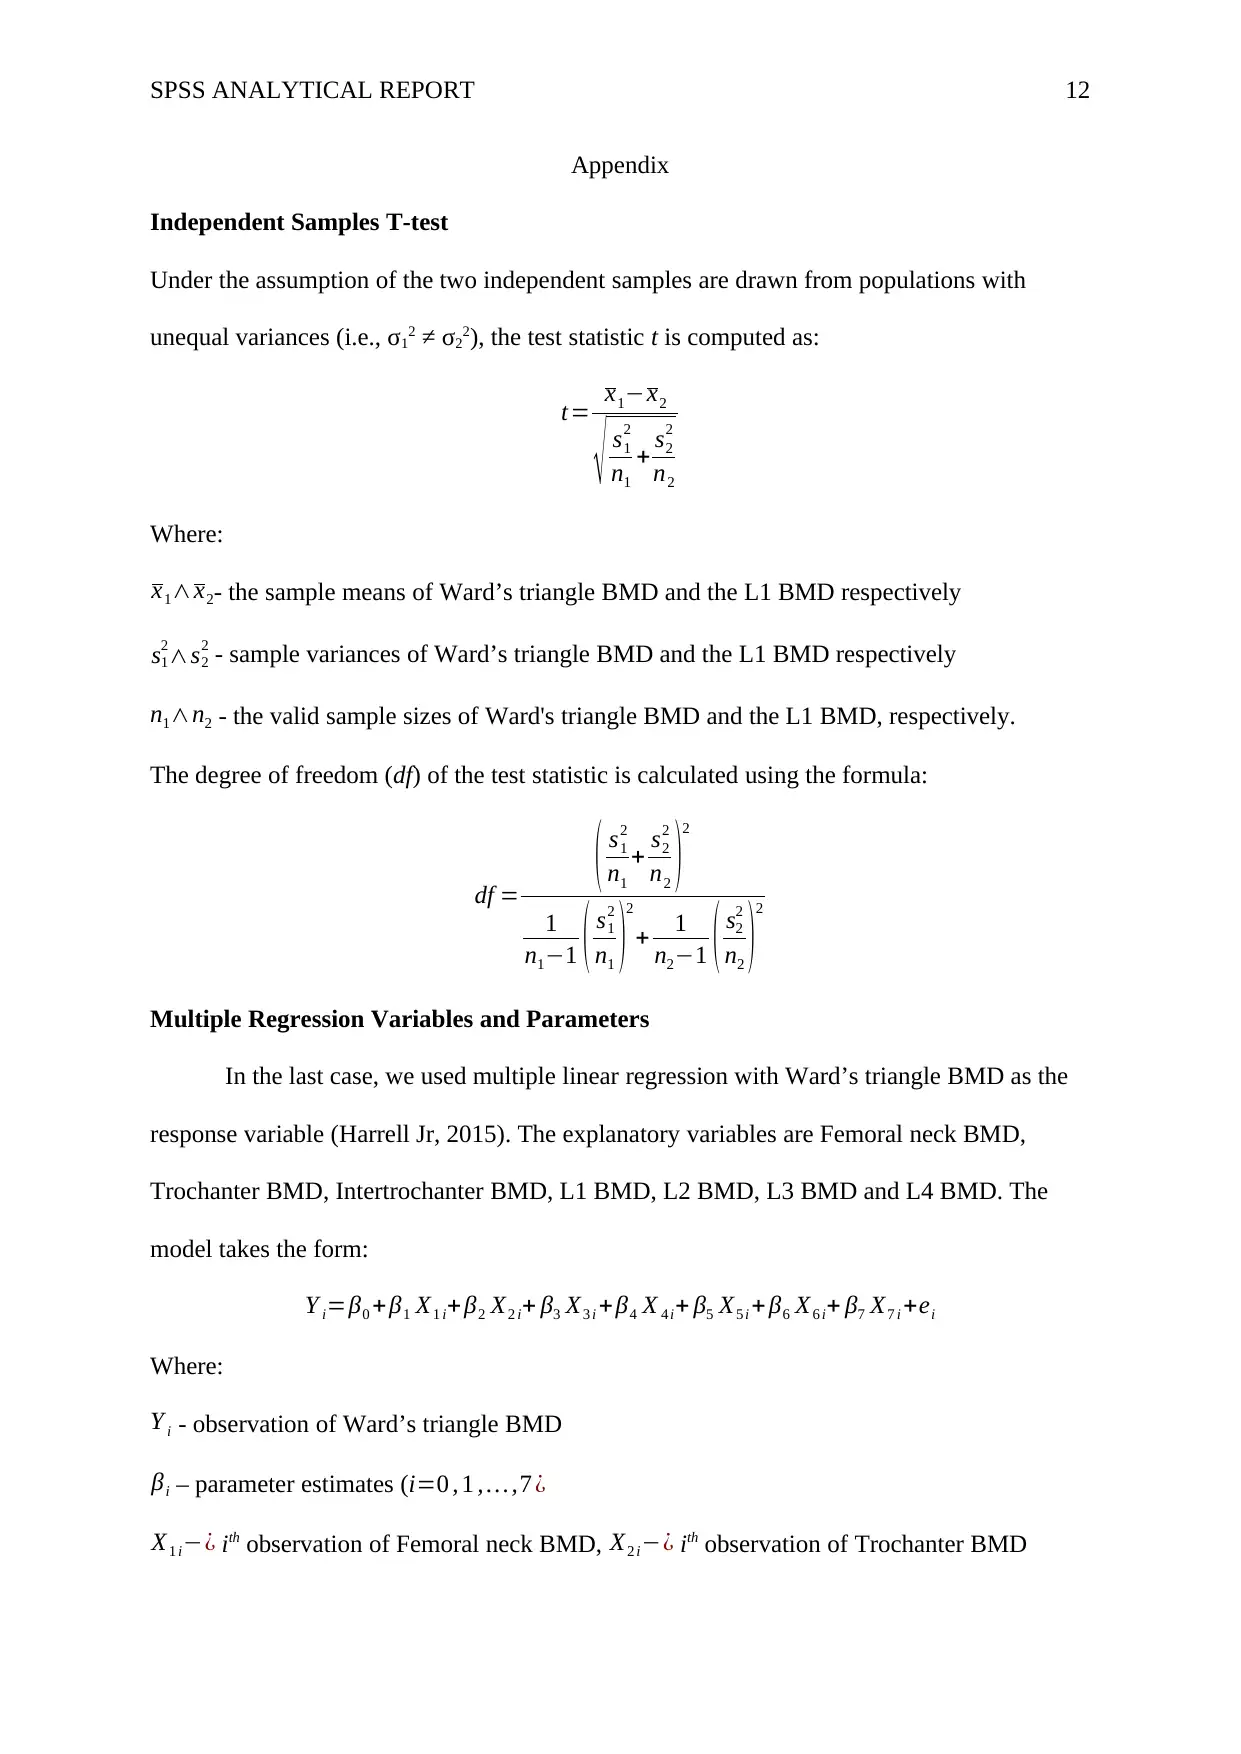
Independent Samples T-test
Under the assumption of the two independent samples are drawn from populations with
unequal variances (i.e., σ12 ≠ σ22), the test statistic t is computed as:
t= x1−x2
√ s1
2
n1
+ s2
2
n2
Where:
x1∧x2- the sample means of Ward’s triangle BMD and the L1 BMD respectively
s1
2∧s2
2 - sample variances of Ward’s triangle BMD and the L1 BMD respectively
n1∧n2 - the valid sample sizes of Ward's triangle BMD and the L1 BMD, respectively.
The degree of freedom (df) of the test statistic is calculated using the formula:
df =
( s1
2
n1
+ s2
2
n2 )
2
1
n1−1 ( s1
2
n1 )
2
+ 1
n2−1 ( s2
2
n2 )
2
Multiple Regression Variables and Parameters
In the last case, we used multiple linear regression with Ward’s triangle BMD as the
response variable (Harrell Jr, 2015). The explanatory variables are Femoral neck BMD,
Trochanter BMD, Intertrochanter BMD, L1 BMD, L2 BMD, L3 BMD and L4 BMD. The
model takes the form:
Y i=β0 +β1 X1 i+ β2 X2 i+ β3 X3 i +β4 X 4 i+ β5 X5 i + β6 X6 i+ β7 X7 i +ei
Where:
Y i - observation of Ward’s triangle BMD
βi – parameter estimates (i=0 , 1 , … ,7 ¿
X1 i−¿ ith observation of Femoral neck BMD, X2 i−¿ ith observation of Trochanter BMD
Appendix
Independent Samples T-test
Under the assumption of the two independent samples are drawn from populations with
unequal variances (i.e., σ12 ≠ σ22), the test statistic t is computed as:
t= x1−x2
√ s1
2
n1
+ s2
2
n2
Where:
x1∧x2- the sample means of Ward’s triangle BMD and the L1 BMD respectively
s1
2∧s2
2 - sample variances of Ward’s triangle BMD and the L1 BMD respectively
n1∧n2 - the valid sample sizes of Ward's triangle BMD and the L1 BMD, respectively.
The degree of freedom (df) of the test statistic is calculated using the formula:
df =
( s1
2
n1
+ s2
2
n2 )
2
1
n1−1 ( s1
2
n1 )
2
+ 1
n2−1 ( s2
2
n2 )
2
Multiple Regression Variables and Parameters
In the last case, we used multiple linear regression with Ward’s triangle BMD as the
response variable (Harrell Jr, 2015). The explanatory variables are Femoral neck BMD,
Trochanter BMD, Intertrochanter BMD, L1 BMD, L2 BMD, L3 BMD and L4 BMD. The
model takes the form:
Y i=β0 +β1 X1 i+ β2 X2 i+ β3 X3 i +β4 X 4 i+ β5 X5 i + β6 X6 i+ β7 X7 i +ei
Where:
Y i - observation of Ward’s triangle BMD
βi – parameter estimates (i=0 , 1 , … ,7 ¿
X1 i−¿ ith observation of Femoral neck BMD, X2 i−¿ ith observation of Trochanter BMD
⊘ This is a preview!⊘
Do you want full access?
Subscribe today to unlock all pages.
Trusted by 1+ million students worldwide
1 out of 13
Related Documents


Your All-in-One AI-Powered Toolkit for Academic Success.
+13062052269
info@desklib.com
Available 24*7 on WhatsApp / Email
![[object Object]](/_next/static/media/star-bottom.7253800d.svg)
Unlock your academic potential
Copyright © 2020–2026 A2Z Services. All Rights Reserved. Developed and managed by ZUCOL.