QSO 510 Final Project: Statistical Analysis of PVA Donation Data
VerifiedAdded on 2022/09/06
|20
|4174
|16
Project
AI Summary
This project undertakes a quantitative analysis of data related to donations received by Paralyzed Veterans of America (PVA). The primary goal is to identify the key factors that influence the amount of donations received. The analysis begins with descriptive statistics to understand the central tendencies of gift amounts. Subsequently, the project explores the relationship between the gift amount (dependent variable) and several predictor variables, including the number of promotions received, card promotions, gift frequency, and minimum gift amounts. Multiple regression analysis is performed to determine the statistical significance of each variable. The findings reveal that the minimum amount paid and the number of promotions received lifetime significantly influence the gift amount. The project concludes with recommendations for PVA, suggesting that the charity focus on these key variables when designing their marketing and fundraising strategies to maximize donation amounts. The student utilized statistical tools and methods to solve a problem in a given scenario often encountered by a manager to provide a data-driven solution.
Running head: QUANTITATIVE ANALYSIS
Quantitative Analysis
Student’s Name
Institution
Date
Quantitative Analysis
Student’s Name
Institution
Date
Paraphrase This Document
Need a fresh take? Get an instant paraphrase of this document with our AI Paraphraser
QUANTITATIVE ANALYSIS 2
Introduction
The Paralyzed Veterans of America is a charity organization designed to assist the
veterans who are disabled. The source of their funds are voluntary donors. Currently, the
organization market or ask for donation through sending greeting cards and mailing address
labels periodically with their request for donations. However, in order to collect enough amount,
the PVA ought to do proper targeting. The only way of carrying out proper targeting is by
understanding the behavior of donors. It is important to know what motivate donors to
contribute. Volunteers are a necessary resource for many charitable organizations, since the types
of assistance provided by charitable organizations without involving volunteers are often
impossible to provide. An organization needs to find the “right” volunteer to solve the “right”
task, that is, so that the volunteer, his characteristics and internal attitudes match as much as
possible the activities that need to be performed as part of the activities of the charitable
organization (Wiepking & Breeze, 2012). From the perspective of donors, it is the combination
of four factors that affects their decision to make charitable donations: demographic
characteristics, personality traits, values, current emotional state and cognitive state (Verhaert &
Van den Poel, 2011).
Charities like PVA and researchers are concerned about "who is more likely to be a
donor." A large number of studies have analyzed demographic characteristics and found that
economic conditions, age, gender, education level and religious beliefs have a strong explanatory
power on individual donation behavior Those with higher economic income and social status,
seniors, those with higher education, and those with religious beliefs have relatively higher
willingness to donate and more donation behavior (Wilhelm & Bekkers 2010). In addition,
because women are more compassionate and caring for others, they are more frequent than men
QUANTITATIVE ANALYSIS 3
in charitable donations. Some people are particularly enthusiastic about charity and have a great
connection with their personality traits. Zubairi and Siddiqui (2019) summarized the opinions of
many scholars and proposed that the motivation for corporate charitable donations is for
corporate reputation. Participating in philanthropy has become an effective way for enterprises to
obtain high exposure and expand their visibility. Frequent appearances in the public eye will help
companies gain public goodwill, thereby establishing a good image of the company, improving
its reputation, and gaining more economic benefits. The halo effect of social psychology
indicates that when a cognitive person (Awan & Hameed 2014). Human value is divided into self
value and social value. Social value refers to the realization of personal contribution to society by
taking society and others as the subject of value and the individual as the object of value when
dealing with and practicing human relationships. In order to fulfill their social responsibilities
and help others, some people are even willing to help others at the expense of their own welfare.
However, the existence of altruistic motives for truly fulfilling social responsibilities has been
continuously questioned by the academic community for a long time. some donors choose to
donate based on their past experience or they believe that they will definitely benefit from the
donating organization in the future, and the donation behavior is to some extent consistent with
the idea of self-interest; In fact, the social status and influence of the beneficiary organization
will also be considered, because they will associate and highlight this external image of the
beneficiary organization with their own social status. Evidently, there are multiple factors that
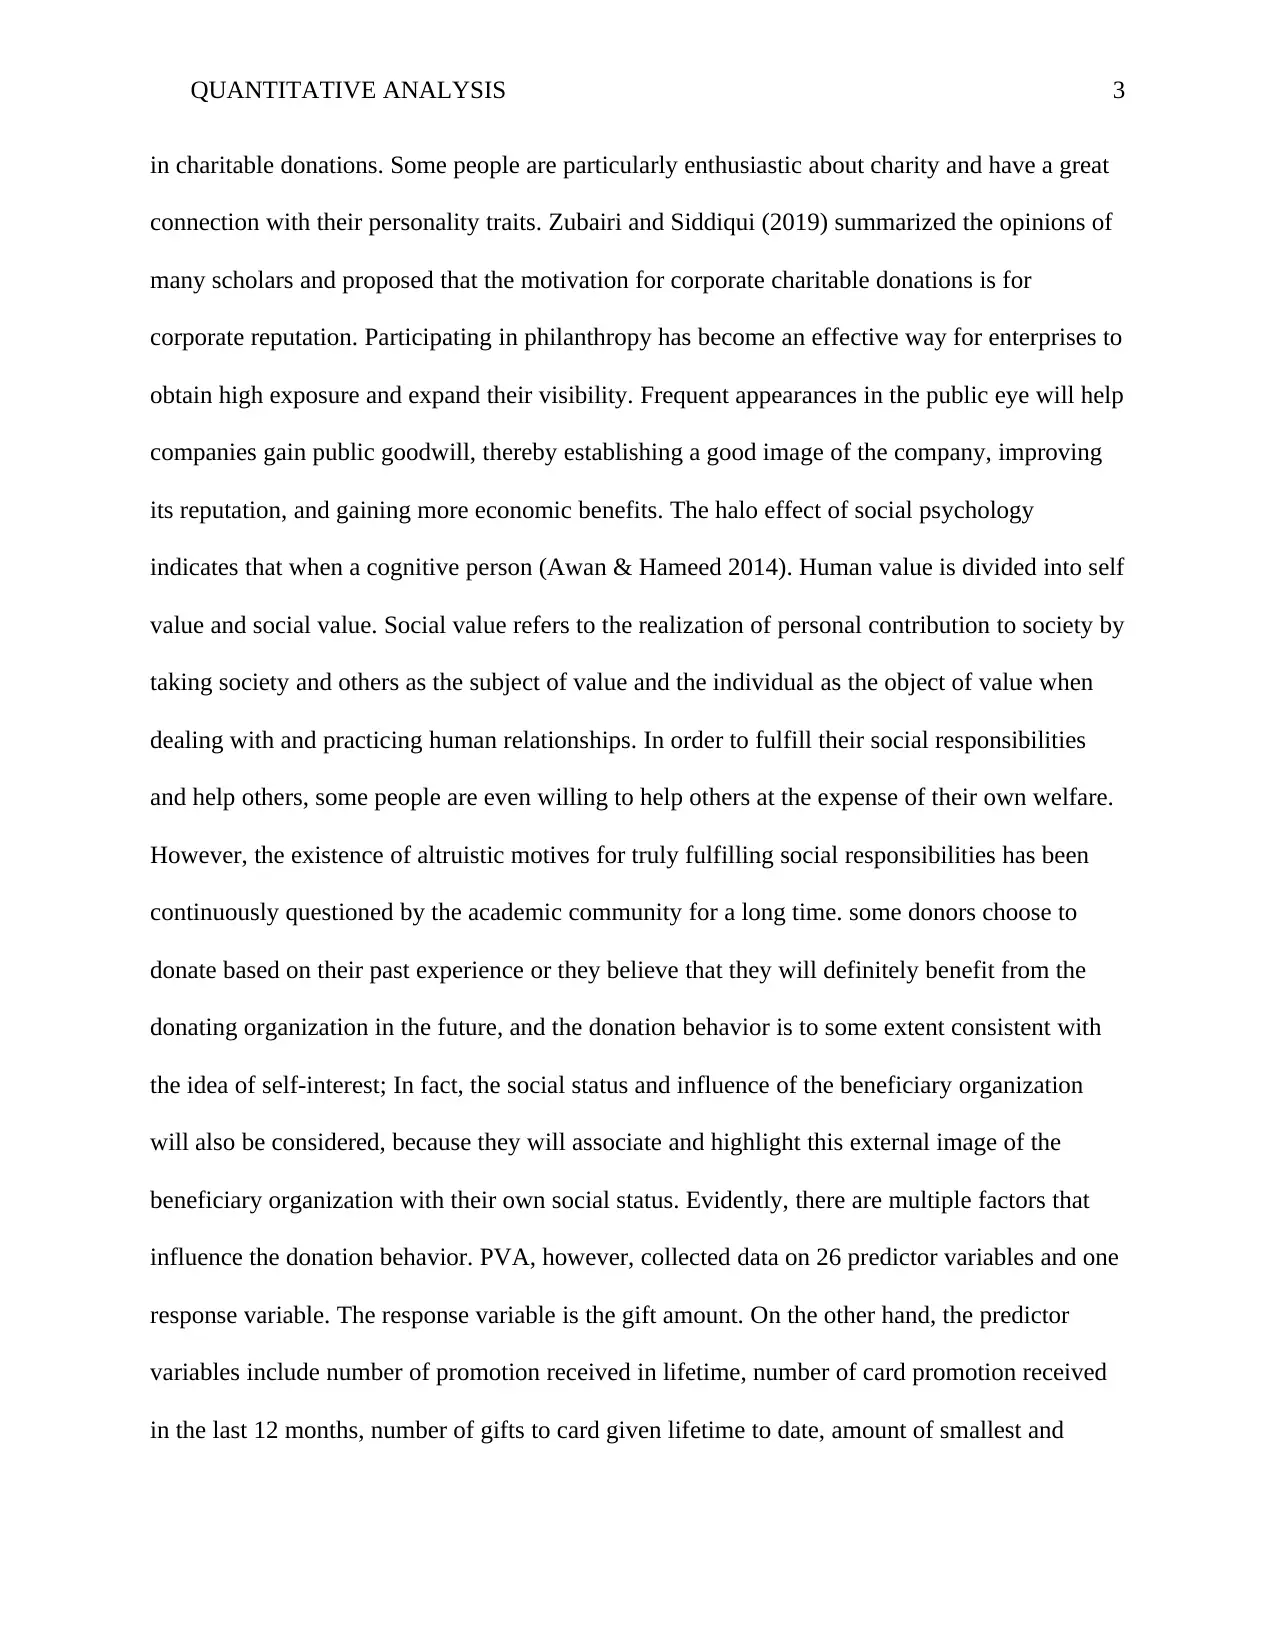
influence the donation behavior. PVA, however, collected data on 26 predictor variables and one
response variable. The response variable is the gift amount. On the other hand, the predictor
variables include number of promotion received in lifetime, number of card promotion received
in the last 12 months, number of gifts to card given lifetime to date, amount of smallest and
in charitable donations. Some people are particularly enthusiastic about charity and have a great
connection with their personality traits. Zubairi and Siddiqui (2019) summarized the opinions of
many scholars and proposed that the motivation for corporate charitable donations is for
corporate reputation. Participating in philanthropy has become an effective way for enterprises to
obtain high exposure and expand their visibility. Frequent appearances in the public eye will help
companies gain public goodwill, thereby establishing a good image of the company, improving
its reputation, and gaining more economic benefits. The halo effect of social psychology
indicates that when a cognitive person (Awan & Hameed 2014). Human value is divided into self
value and social value. Social value refers to the realization of personal contribution to society by
taking society and others as the subject of value and the individual as the object of value when
dealing with and practicing human relationships. In order to fulfill their social responsibilities
and help others, some people are even willing to help others at the expense of their own welfare.
However, the existence of altruistic motives for truly fulfilling social responsibilities has been
continuously questioned by the academic community for a long time. some donors choose to
donate based on their past experience or they believe that they will definitely benefit from the
donating organization in the future, and the donation behavior is to some extent consistent with
the idea of self-interest; In fact, the social status and influence of the beneficiary organization
will also be considered, because they will associate and highlight this external image of the
beneficiary organization with their own social status. Evidently, there are multiple factors that
influence the donation behavior. PVA, however, collected data on 26 predictor variables and one
response variable. The response variable is the gift amount. On the other hand, the predictor
variables include number of promotion received in lifetime, number of card promotion received
in the last 12 months, number of gifts to card given lifetime to date, amount of smallest and
⊘ This is a preview!⊘
Do you want full access?
Subscribe today to unlock all pages.
Trusted by 1+ million students worldwide
QUANTITATIVE ANALYSIS 4
largest gift and their respective dates, number of children living at home, as well as home
ownership.
Problem statement
The issue facing PVA is the specific type of variables it should consider when designing
the marketing plan. Currently, PVA has been using variety of methods but without any empirical
justification on the usefulness or effectiveness of each of the variable. For example, PVA may be
sending card gift hoping that it will improves the gift amount. However, without statistical
evidence, the PVA may waste a lot of money for promotions that are not effective. It is the goal
of this paper to identify which of the variables are statistically effective and then give
recommendations to PVA.
Methodology
In order to understand how donors makes their contribution, it is important to correlate
and regress different independent variables against dependent variable. From the case, the
dependent variable is the amount of gift. The independent variable are many but it is important to
select some of them that are more relevant to the donation.
Analysis
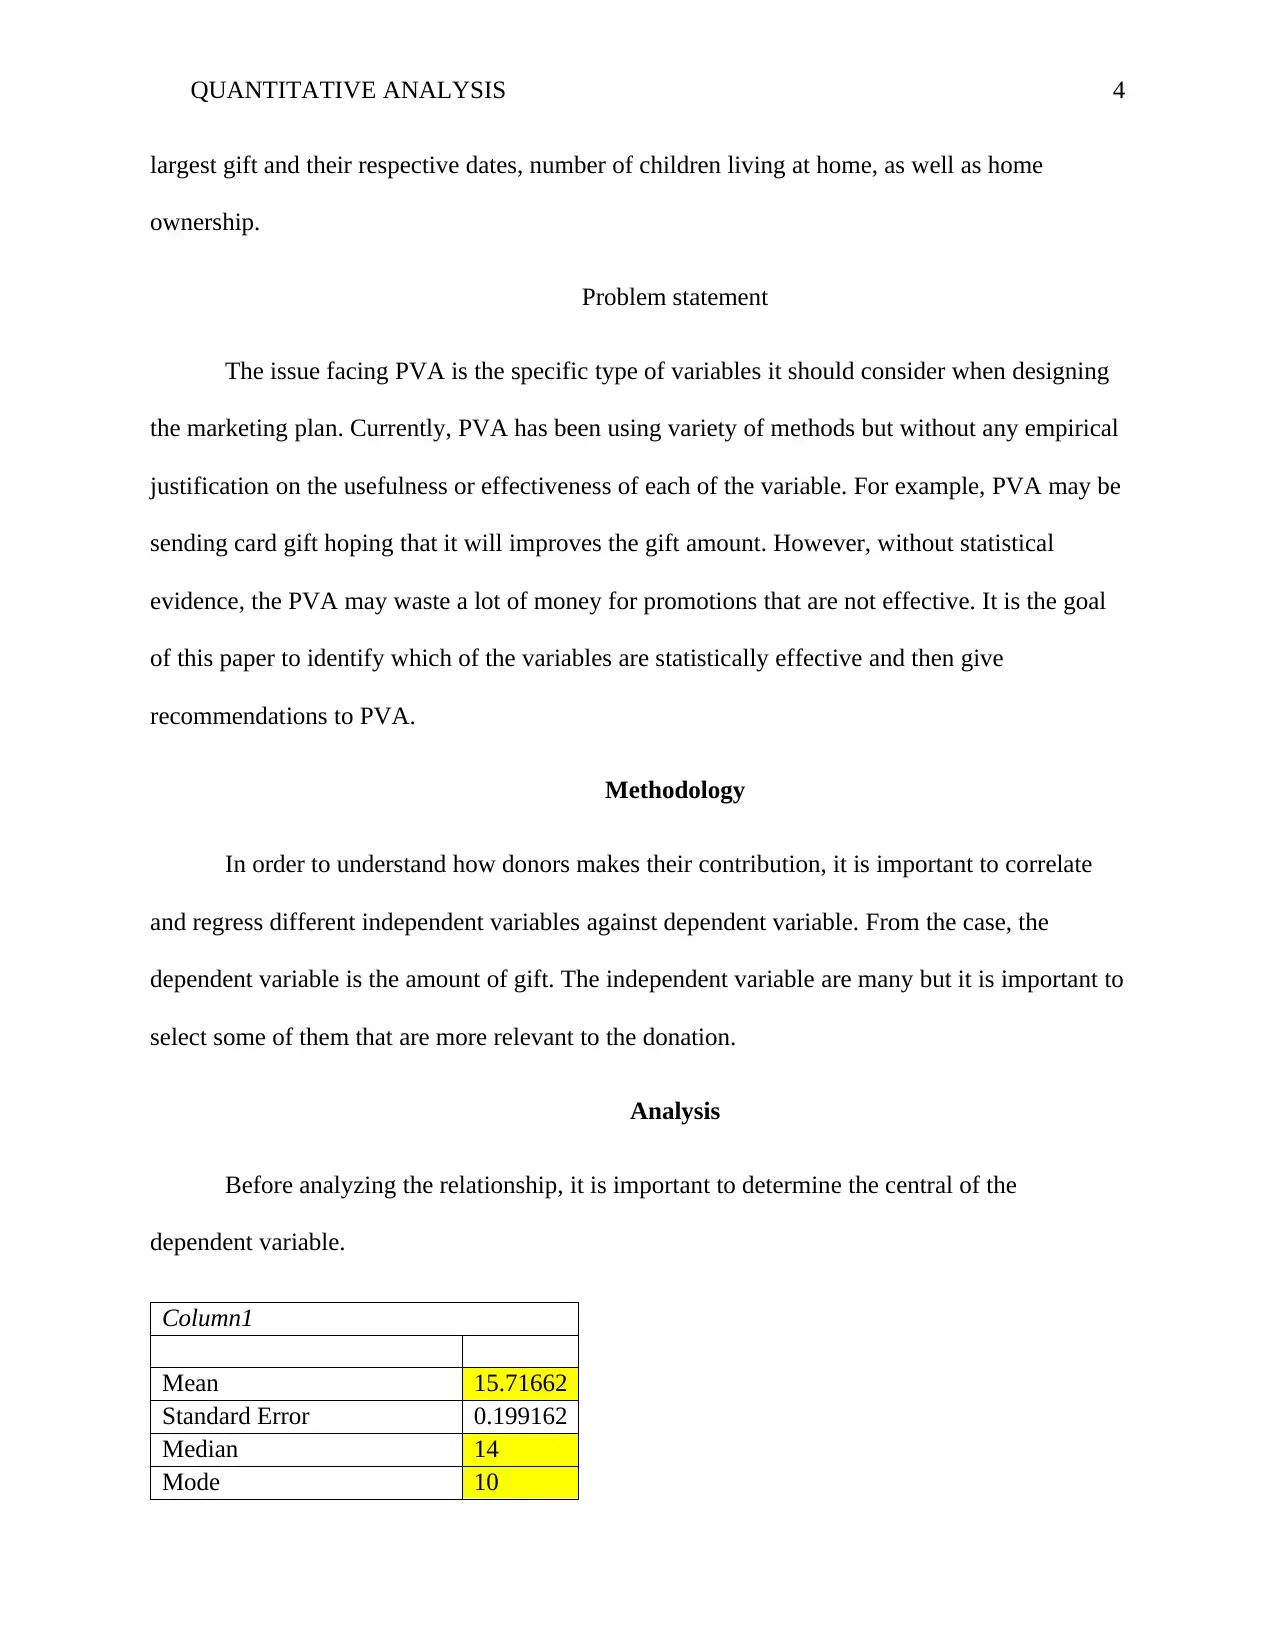
Before analyzing the relationship, it is important to determine the central of the
dependent variable.
Column1
Mean 15.71662
Standard Error 0.199162
Median 14
Mode 10
largest gift and their respective dates, number of children living at home, as well as home
ownership.
Problem statement
The issue facing PVA is the specific type of variables it should consider when designing
the marketing plan. Currently, PVA has been using variety of methods but without any empirical
justification on the usefulness or effectiveness of each of the variable. For example, PVA may be
sending card gift hoping that it will improves the gift amount. However, without statistical
evidence, the PVA may waste a lot of money for promotions that are not effective. It is the goal
of this paper to identify which of the variables are statistically effective and then give
recommendations to PVA.
Methodology
In order to understand how donors makes their contribution, it is important to correlate
and regress different independent variables against dependent variable. From the case, the
dependent variable is the amount of gift. The independent variable are many but it is important to
select some of them that are more relevant to the donation.
Analysis
Before analyzing the relationship, it is important to determine the central of the
dependent variable.
Column1
Mean 15.71662
Standard Error 0.199162
Median 14
Mode 10
Paraphrase This Document
Need a fresh take? Get an instant paraphrase of this document with our AI Paraphraser
QUANTITATIVE ANALYSIS 5
Standard Deviation 12.02915
Sample Variance 144.7005
Kurtosis 46.31207
Skewness 4.768222
Range 199
Minimum 1
Maximum 200
Sum 57334.24
Count 3648
Largest(1) 200
Smallest(1) 1
Confidence Level(95.0%) 0.390481
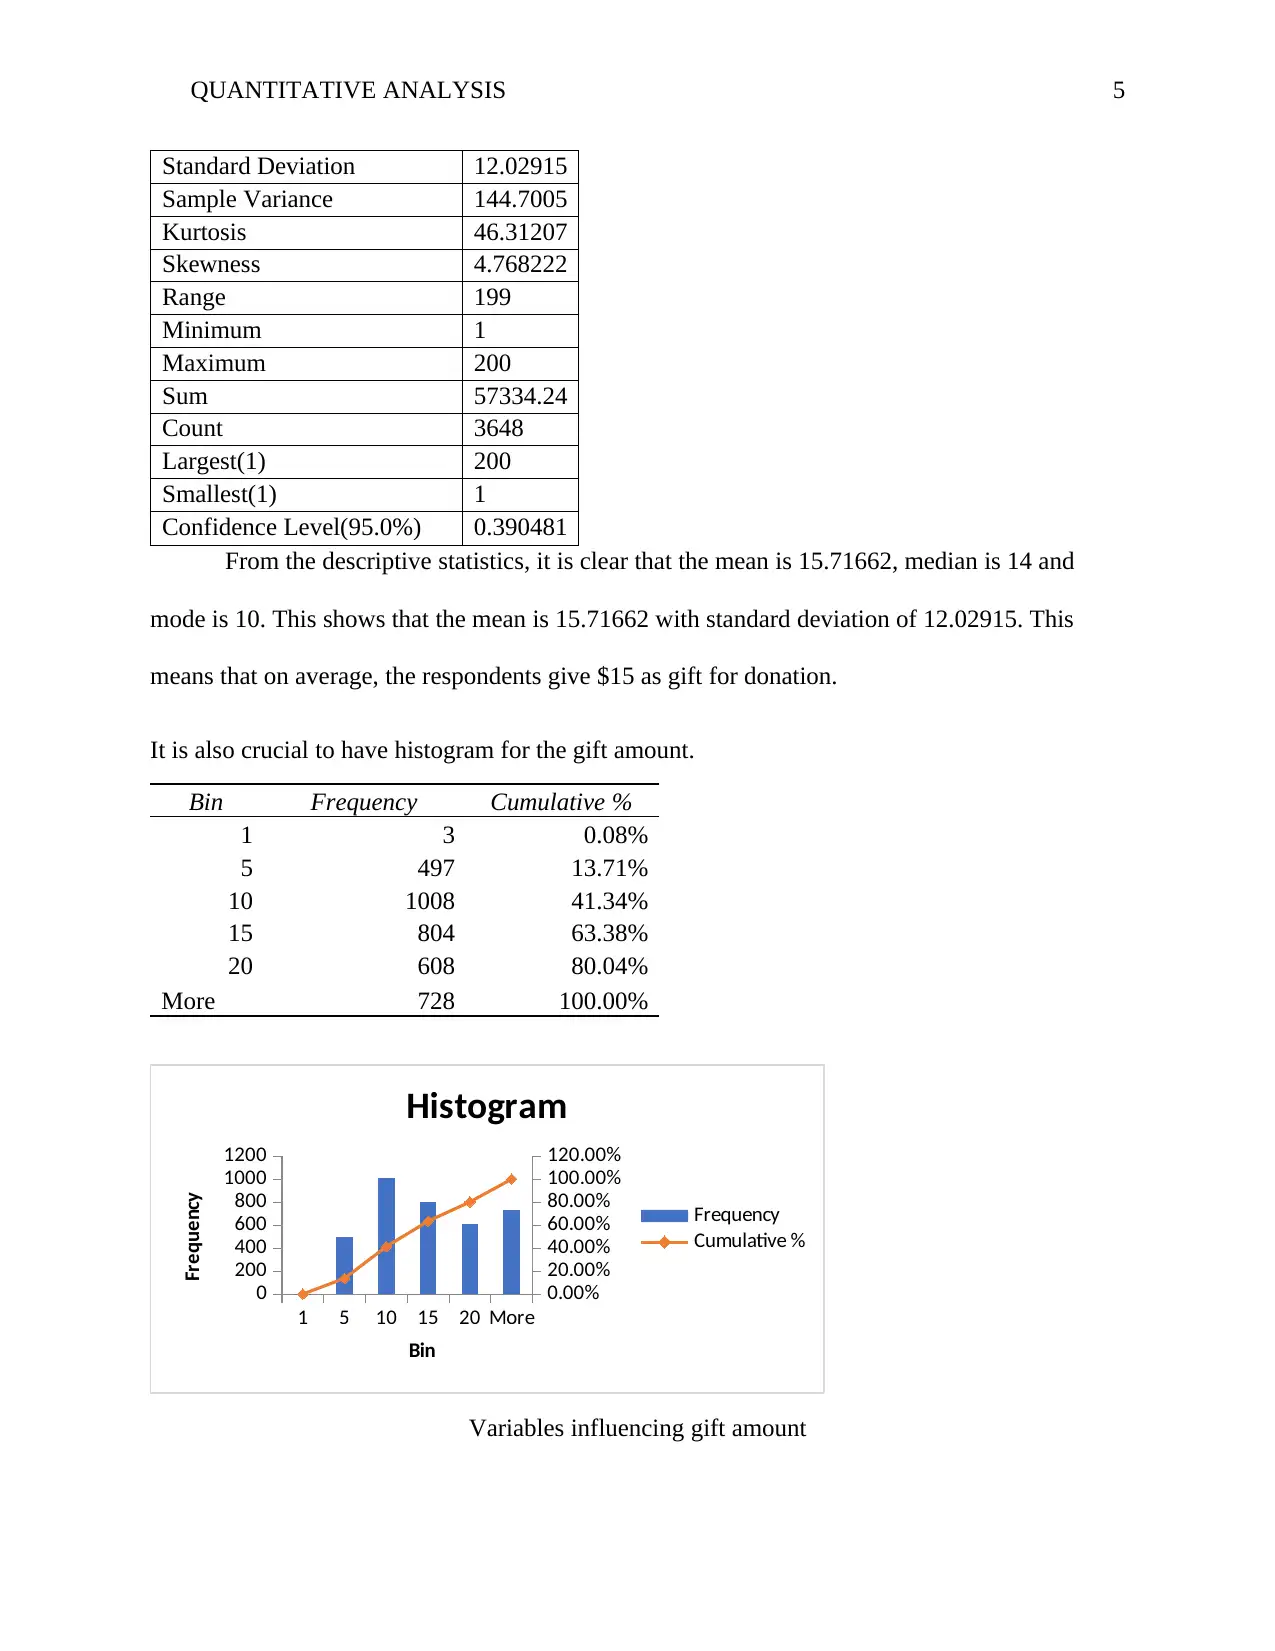
From the descriptive statistics, it is clear that the mean is 15.71662, median is 14 and
mode is 10. This shows that the mean is 15.71662 with standard deviation of 12.02915. This
means that on average, the respondents give $15 as gift for donation.
It is also crucial to have histogram for the gift amount.
Bin Frequency Cumulative %
1 3 0.08%
5 497 13.71%
10 1008 41.34%
15 804 63.38%
20 608 80.04%
More 728 100.00%
1 5 10 15 20 More
0
200
400
600
800
1000
1200
0.00%
20.00%
40.00%
60.00%
80.00%
100.00%
120.00%
Histogram
Frequency
Cumulative %
Bin
Frequency
Variables influencing gift amount
Standard Deviation 12.02915
Sample Variance 144.7005
Kurtosis 46.31207
Skewness 4.768222
Range 199
Minimum 1
Maximum 200
Sum 57334.24
Count 3648
Largest(1) 200
Smallest(1) 1
Confidence Level(95.0%) 0.390481
From the descriptive statistics, it is clear that the mean is 15.71662, median is 14 and
mode is 10. This shows that the mean is 15.71662 with standard deviation of 12.02915. This
means that on average, the respondents give $15 as gift for donation.
It is also crucial to have histogram for the gift amount.
Bin Frequency Cumulative %
1 3 0.08%
5 497 13.71%
10 1008 41.34%
15 804 63.38%
20 608 80.04%
More 728 100.00%
1 5 10 15 20 More
0
200
400
600
800
1000
1200
0.00%
20.00%
40.00%
60.00%
80.00%
100.00%
120.00%
Histogram
Frequency
Cumulative %
Bin
Frequency
Variables influencing gift amount
QUANTITATIVE ANALYSIS 6
Determining the major predictor variables for charity giving or gift amount is not easier
task. Darwin's theory of natural selection believes that the most adaptive behavior in evolution is
self-interest-oriented behavior. In this sense, philanthropy is contrary to nature for individuals
who compete for opportunities for survival. So what motivated humans to develop charitable
donations in the course of evolution? Researchers have searched for answers from different
angles, mainly forming the altruistic instinct theory and the self-interest reciprocity theory.
Proponents of altruism instinct believe that compassion is the beginning of the distinction
between humans and animals. Human beings are born with a sympathy for suffering and
misfortune. Competition for survival is only one side of biological nature, not all, and the other
side that is balanced with it is human spontaneous solidarity. Solidarity is a very powerful and
natural nature of human beings, rather than the nature of egoism or the pursuit of power.
Therefore, compassion is the purest motivation for charitable giving. Based on research, some
variables are more likely to influence the gift amount more than other variables. The next section
will analyze some of the hypothesized variables and then finally do multiple regression to
determine the part played by each of the selected predictor variable.
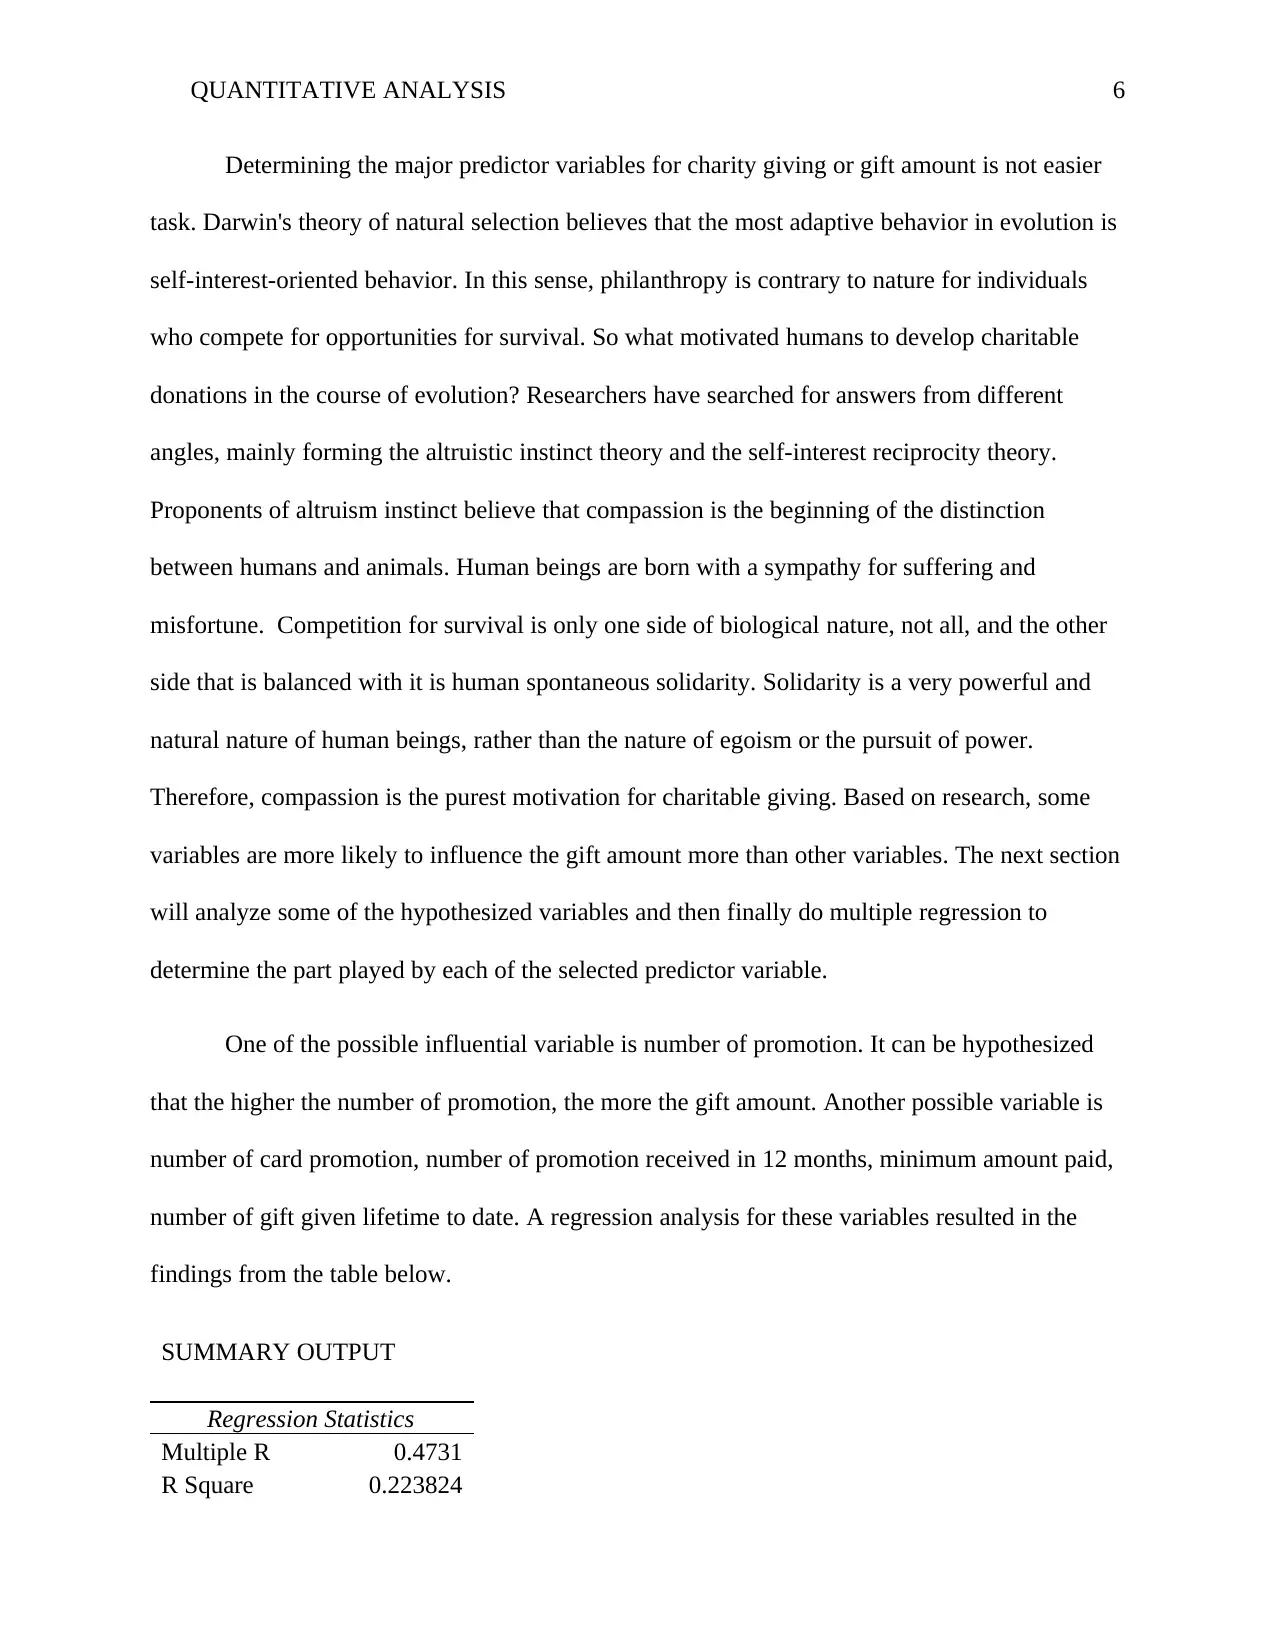
One of the possible influential variable is number of promotion. It can be hypothesized
that the higher the number of promotion, the more the gift amount. Another possible variable is
number of card promotion, number of promotion received in 12 months, minimum amount paid,
number of gift given lifetime to date. A regression analysis for these variables resulted in the
findings from the table below.
SUMMARY OUTPUT
Regression Statistics
Multiple R 0.4731
R Square 0.223824
Determining the major predictor variables for charity giving or gift amount is not easier
task. Darwin's theory of natural selection believes that the most adaptive behavior in evolution is
self-interest-oriented behavior. In this sense, philanthropy is contrary to nature for individuals
who compete for opportunities for survival. So what motivated humans to develop charitable
donations in the course of evolution? Researchers have searched for answers from different
angles, mainly forming the altruistic instinct theory and the self-interest reciprocity theory.
Proponents of altruism instinct believe that compassion is the beginning of the distinction
between humans and animals. Human beings are born with a sympathy for suffering and
misfortune. Competition for survival is only one side of biological nature, not all, and the other
side that is balanced with it is human spontaneous solidarity. Solidarity is a very powerful and
natural nature of human beings, rather than the nature of egoism or the pursuit of power.
Therefore, compassion is the purest motivation for charitable giving. Based on research, some
variables are more likely to influence the gift amount more than other variables. The next section
will analyze some of the hypothesized variables and then finally do multiple regression to
determine the part played by each of the selected predictor variable.
One of the possible influential variable is number of promotion. It can be hypothesized
that the higher the number of promotion, the more the gift amount. Another possible variable is
number of card promotion, number of promotion received in 12 months, minimum amount paid,
number of gift given lifetime to date. A regression analysis for these variables resulted in the
findings from the table below.
SUMMARY OUTPUT
Regression Statistics
Multiple R 0.4731
R Square 0.223824
⊘ This is a preview!⊘
Do you want full access?
Subscribe today to unlock all pages.
Trusted by 1+ million students worldwide
QUANTITATIVE ANALYSIS 7
Adjusted R
Square 0.222545
Standard Error 10.60651
Observations 3648
ANOVA
df SS MS F
Significanc
e F
Regression 6 118116.8
19686.1
4
174.990
8 3.9E-196
Residual 3641 409605.7
112.498
1
Total 3647 527722.5
Coefficient
s
Standard
Error t Stat P-value Lower 95%
Upper
95%
Lower
95.0%
U
9
Intercept 7.041 0.84587
8.32397
1
1.19E-
16 5.382573
8.69942
6 5.382573 8
X Variable 1 0.217737 0.014988
14.5271
5
1.59E-
46 0.188351
0.24712
3 0.188351 0
X Variable 2 0.090807 0.179318
0.50640
1
0.61260
6 -0.26077 0.44238 -0.26077
X Variable 3 -0.12693 0.054743 -2.31857
0.02047
4 -0.23426 -0.0196 -0.23426
X Variable 4 -0.3333 0.049933 -6.67506
2.85E-
11 -0.4312 -0.2354 -0.4312
X Variable 5 -0.34866 0.092486 -3.76985
0.00016
6 -0.52999 -0.16733 -0.52999 -
X Variable 6 0.710992 0.028967
24.5451
5 3E-123 0.6542
0.76778
5 0.6542 0
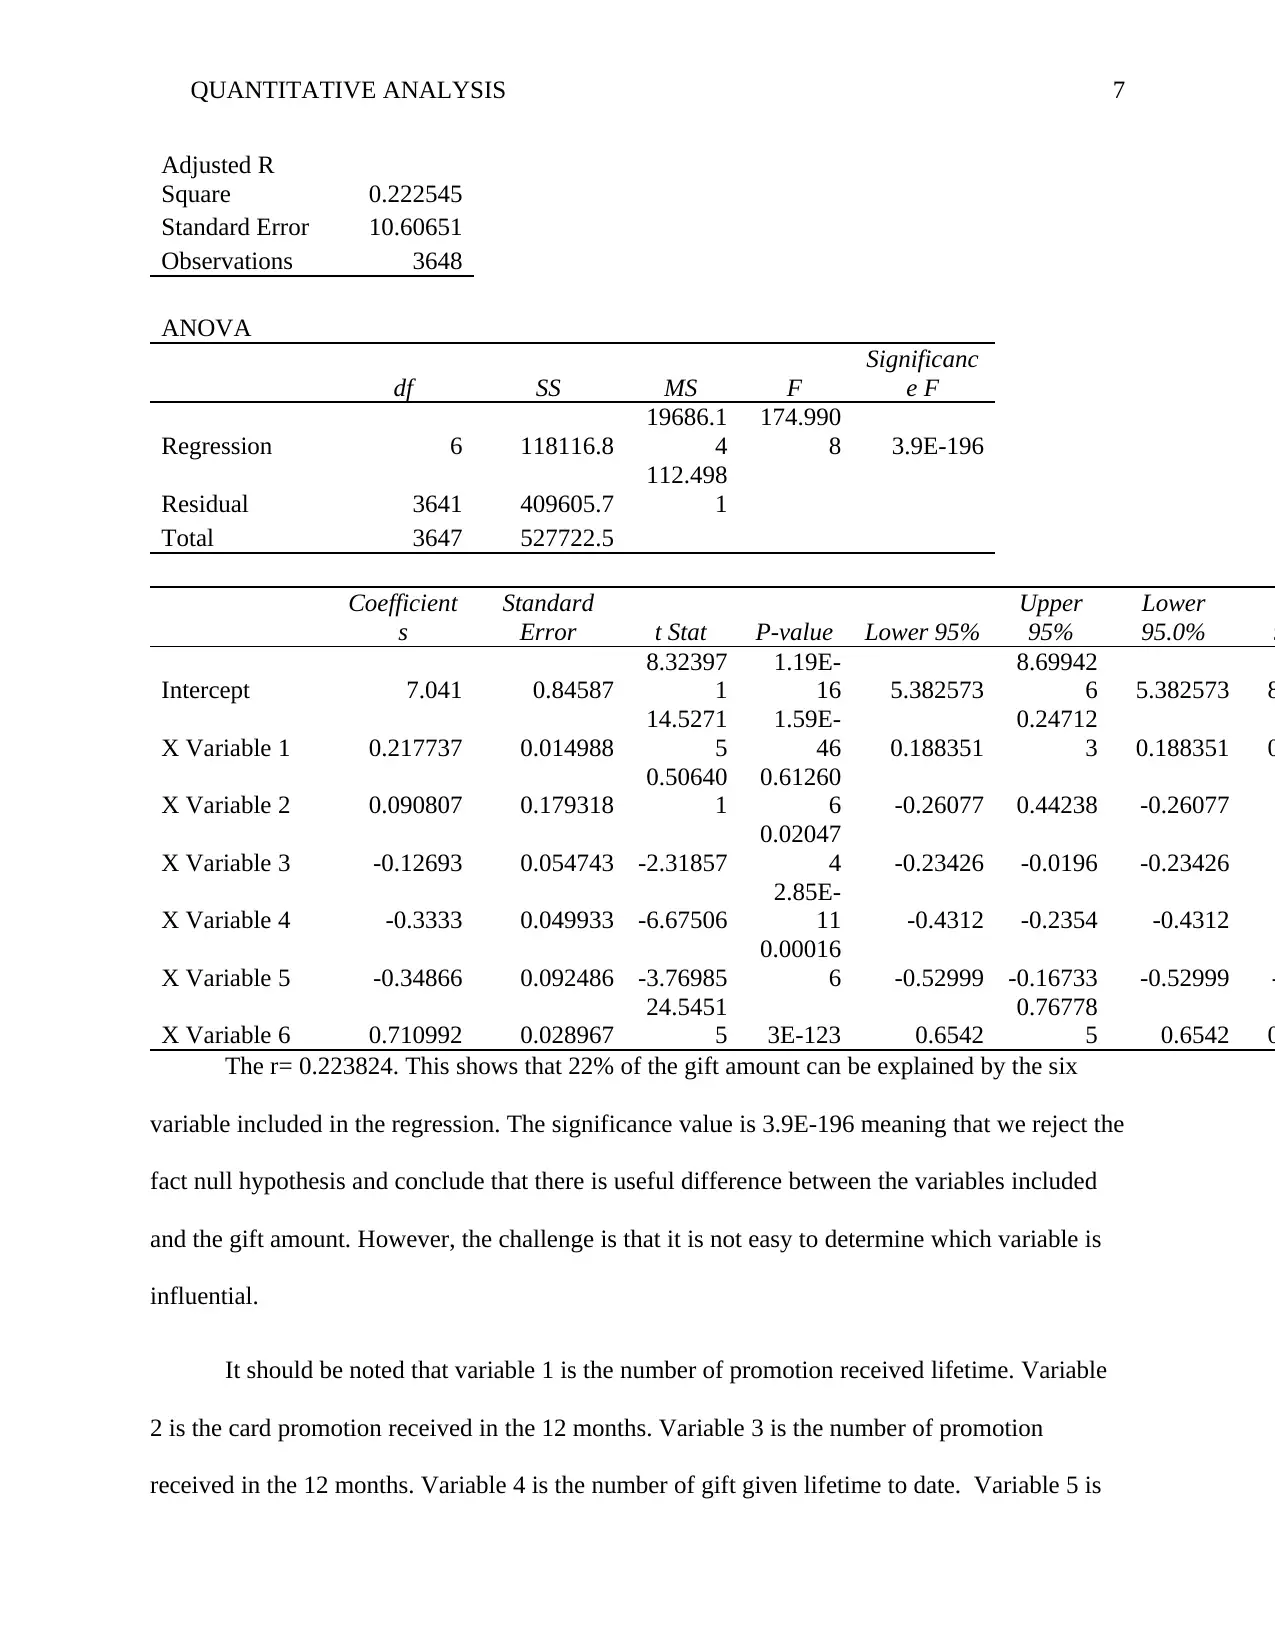
The r= 0.223824. This shows that 22% of the gift amount can be explained by the six
variable included in the regression. The significance value is 3.9E-196 meaning that we reject the
fact null hypothesis and conclude that there is useful difference between the variables included
and the gift amount. However, the challenge is that it is not easy to determine which variable is
influential.
It should be noted that variable 1 is the number of promotion received lifetime. Variable
2 is the card promotion received in the 12 months. Variable 3 is the number of promotion
received in the 12 months. Variable 4 is the number of gift given lifetime to date. Variable 5 is
Adjusted R
Square 0.222545
Standard Error 10.60651
Observations 3648
ANOVA
df SS MS F
Significanc
e F
Regression 6 118116.8
19686.1
4
174.990
8 3.9E-196
Residual 3641 409605.7
112.498
1
Total 3647 527722.5
Coefficient
s
Standard
Error t Stat P-value Lower 95%
Upper
95%
Lower
95.0%
U
9
Intercept 7.041 0.84587
8.32397
1
1.19E-
16 5.382573
8.69942
6 5.382573 8
X Variable 1 0.217737 0.014988
14.5271
5
1.59E-
46 0.188351
0.24712
3 0.188351 0
X Variable 2 0.090807 0.179318
0.50640
1
0.61260
6 -0.26077 0.44238 -0.26077
X Variable 3 -0.12693 0.054743 -2.31857
0.02047
4 -0.23426 -0.0196 -0.23426
X Variable 4 -0.3333 0.049933 -6.67506
2.85E-
11 -0.4312 -0.2354 -0.4312
X Variable 5 -0.34866 0.092486 -3.76985
0.00016
6 -0.52999 -0.16733 -0.52999 -
X Variable 6 0.710992 0.028967
24.5451
5 3E-123 0.6542
0.76778
5 0.6542 0
The r= 0.223824. This shows that 22% of the gift amount can be explained by the six
variable included in the regression. The significance value is 3.9E-196 meaning that we reject the
fact null hypothesis and conclude that there is useful difference between the variables included
and the gift amount. However, the challenge is that it is not easy to determine which variable is
influential.
It should be noted that variable 1 is the number of promotion received lifetime. Variable
2 is the card promotion received in the 12 months. Variable 3 is the number of promotion
received in the 12 months. Variable 4 is the number of gift given lifetime to date. Variable 5 is
Paraphrase This Document
Need a fresh take? Get an instant paraphrase of this document with our AI Paraphraser
QUANTITATIVE ANALYSIS 8
the number of gift to card promotion given lifetime to date. Lastly, variable 6 is the minimum
amount paid.
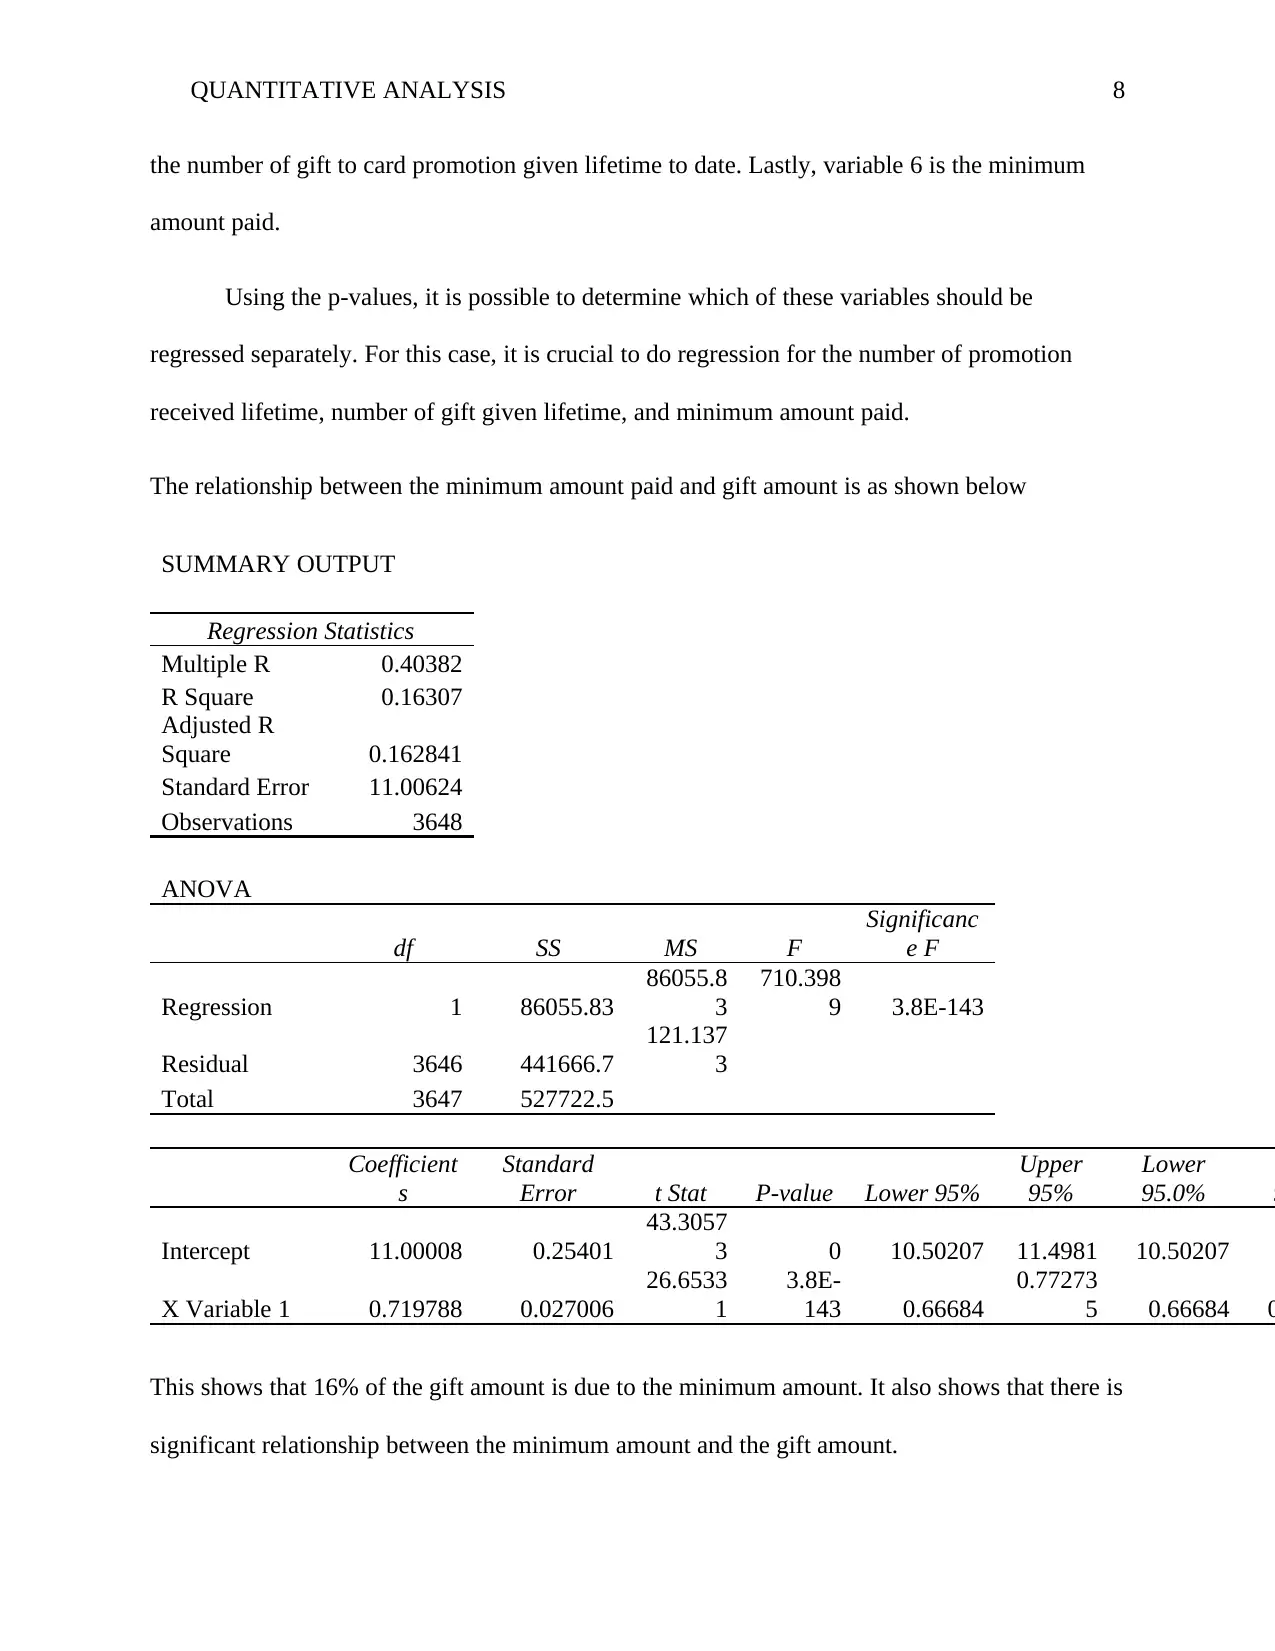
Using the p-values, it is possible to determine which of these variables should be
regressed separately. For this case, it is crucial to do regression for the number of promotion
received lifetime, number of gift given lifetime, and minimum amount paid.
The relationship between the minimum amount paid and gift amount is as shown below
SUMMARY OUTPUT
Regression Statistics
Multiple R 0.40382
R Square 0.16307
Adjusted R
Square 0.162841
Standard Error 11.00624
Observations 3648
ANOVA
df SS MS F
Significanc
e F
Regression 1 86055.83
86055.8
3
710.398
9 3.8E-143
Residual 3646 441666.7
121.137
3
Total 3647 527722.5
Coefficient
s
Standard
Error t Stat P-value Lower 95%
Upper
95%
Lower
95.0%
U
9
Intercept 11.00008 0.25401
43.3057
3 0 10.50207 11.4981 10.50207
X Variable 1 0.719788 0.027006
26.6533
1
3.8E-
143 0.66684
0.77273
5 0.66684 0
This shows that 16% of the gift amount is due to the minimum amount. It also shows that there is
significant relationship between the minimum amount and the gift amount.
the number of gift to card promotion given lifetime to date. Lastly, variable 6 is the minimum
amount paid.
Using the p-values, it is possible to determine which of these variables should be
regressed separately. For this case, it is crucial to do regression for the number of promotion
received lifetime, number of gift given lifetime, and minimum amount paid.
The relationship between the minimum amount paid and gift amount is as shown below
SUMMARY OUTPUT
Regression Statistics
Multiple R 0.40382
R Square 0.16307
Adjusted R
Square 0.162841
Standard Error 11.00624
Observations 3648
ANOVA
df SS MS F
Significanc
e F
Regression 1 86055.83
86055.8
3
710.398
9 3.8E-143
Residual 3646 441666.7
121.137
3
Total 3647 527722.5
Coefficient
s
Standard
Error t Stat P-value Lower 95%
Upper
95%
Lower
95.0%
U
9
Intercept 11.00008 0.25401
43.3057
3 0 10.50207 11.4981 10.50207
X Variable 1 0.719788 0.027006
26.6533
1
3.8E-
143 0.66684
0.77273
5 0.66684 0
This shows that 16% of the gift amount is due to the minimum amount. It also shows that there is
significant relationship between the minimum amount and the gift amount.
QUANTITATIVE ANALYSIS 9
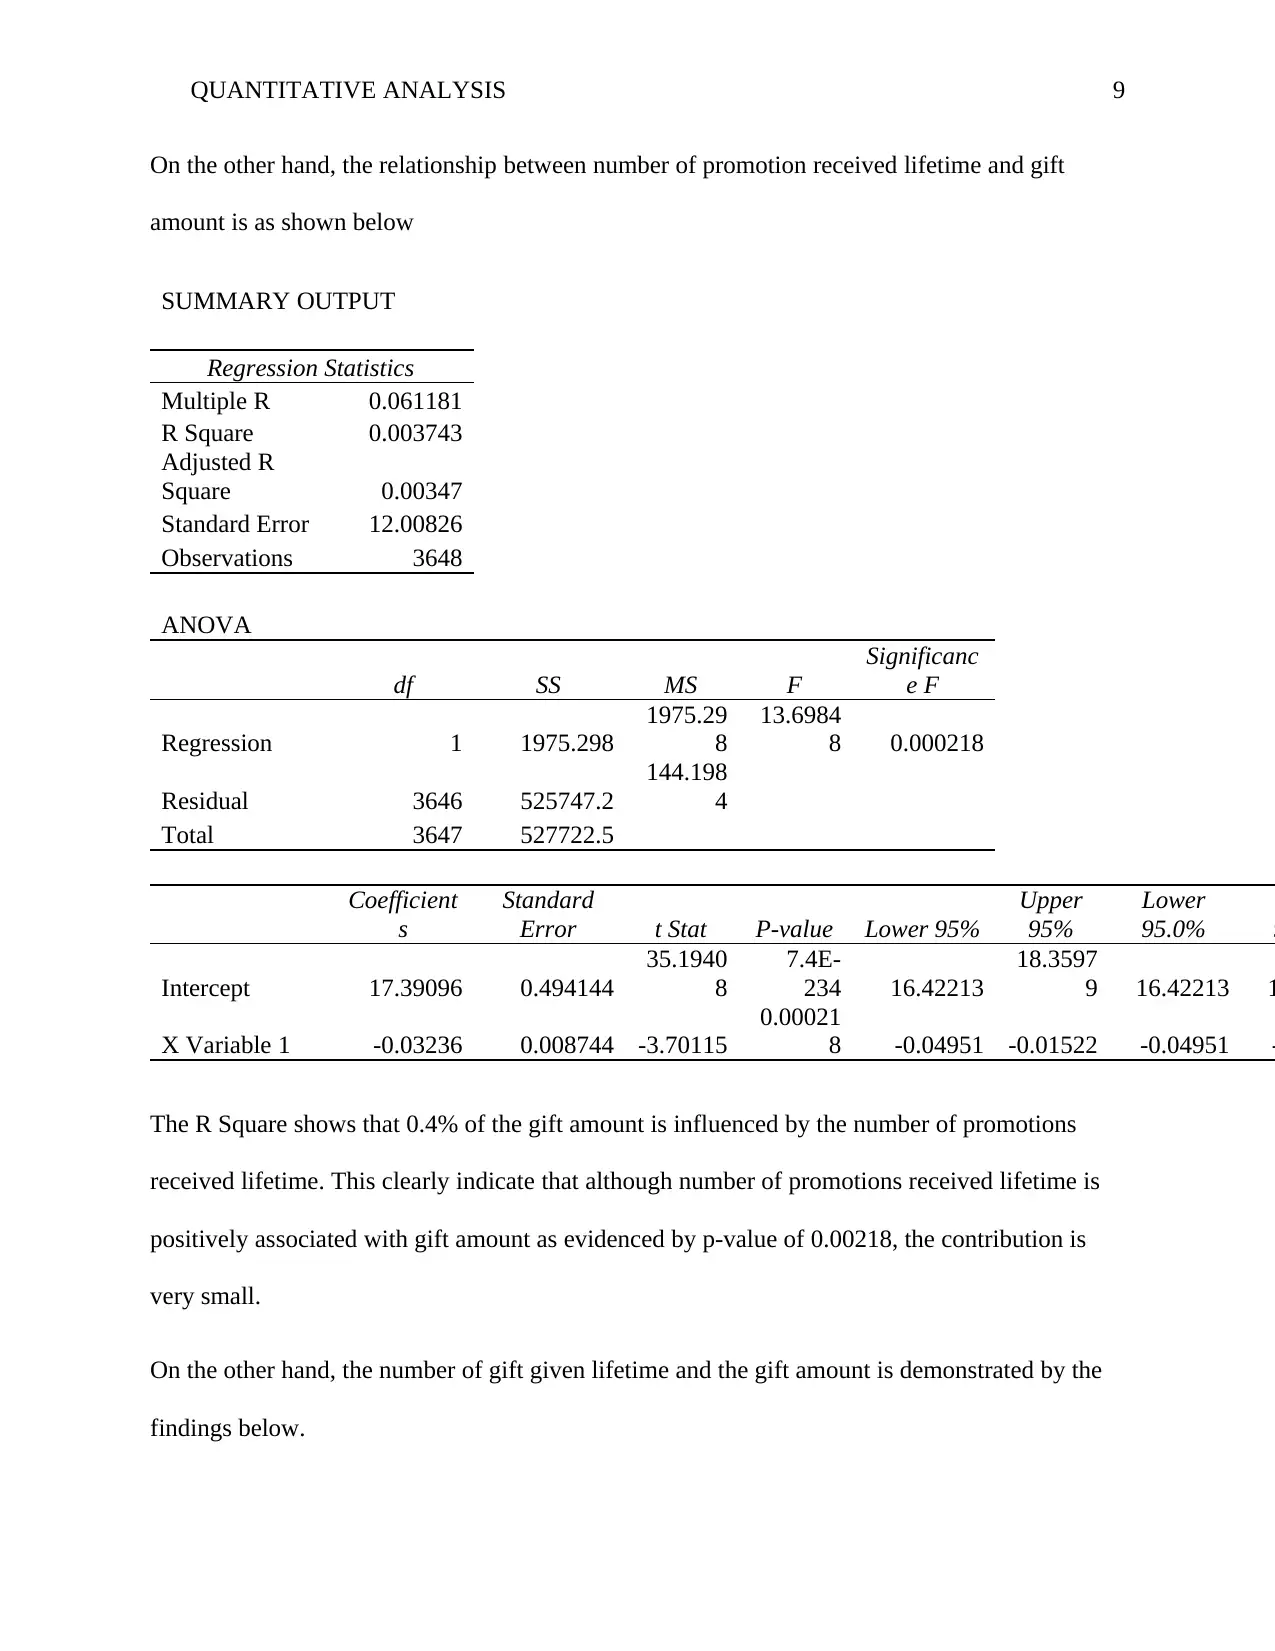
On the other hand, the relationship between number of promotion received lifetime and gift
amount is as shown below
SUMMARY OUTPUT
Regression Statistics
Multiple R 0.061181
R Square 0.003743
Adjusted R
Square 0.00347
Standard Error 12.00826
Observations 3648
ANOVA
df SS MS F
Significanc
e F
Regression 1 1975.298
1975.29
8
13.6984
8 0.000218
Residual 3646 525747.2
144.198
4
Total 3647 527722.5
Coefficient
s
Standard
Error t Stat P-value Lower 95%
Upper
95%
Lower
95.0%
U
9
Intercept 17.39096 0.494144
35.1940
8
7.4E-
234 16.42213
18.3597
9 16.42213 1
X Variable 1 -0.03236 0.008744 -3.70115
0.00021
8 -0.04951 -0.01522 -0.04951 -
The R Square shows that 0.4% of the gift amount is influenced by the number of promotions
received lifetime. This clearly indicate that although number of promotions received lifetime is
positively associated with gift amount as evidenced by p-value of 0.00218, the contribution is
very small.
On the other hand, the number of gift given lifetime and the gift amount is demonstrated by the
findings below.
⊘ This is a preview!⊘
Do you want full access?
Subscribe today to unlock all pages.
Trusted by 1+ million students worldwide
QUANTITATIVE ANALYSIS 10
SUMMARY OUTPUT
Regression Statistics
Multiple R 0.228535
R Square 0.052228
Adjusted R
Square 0.051968
Standard Error 11.71241
Observations 3648
ANOVA
df SS MS F
Significanc
e F
Regression 1 27562.02
27562.0
2
200.917
7 1.95E-44
Residual 3646 500160.5
137.180
6
Total 3647 527722.5
Coefficient
s
Standard
Error t Stat P-value Lower 95%
Upper
95%
Lower
95.0%
U
9
Intercept 19.19276 0.312644
61.3885
9 0 18.57979
19.8057
4 18.57979 1
X Variable 1 -0.29793 0.021018 -14.1745
1.95E-
44 -0.33914 -0.25672 -0.33914 -
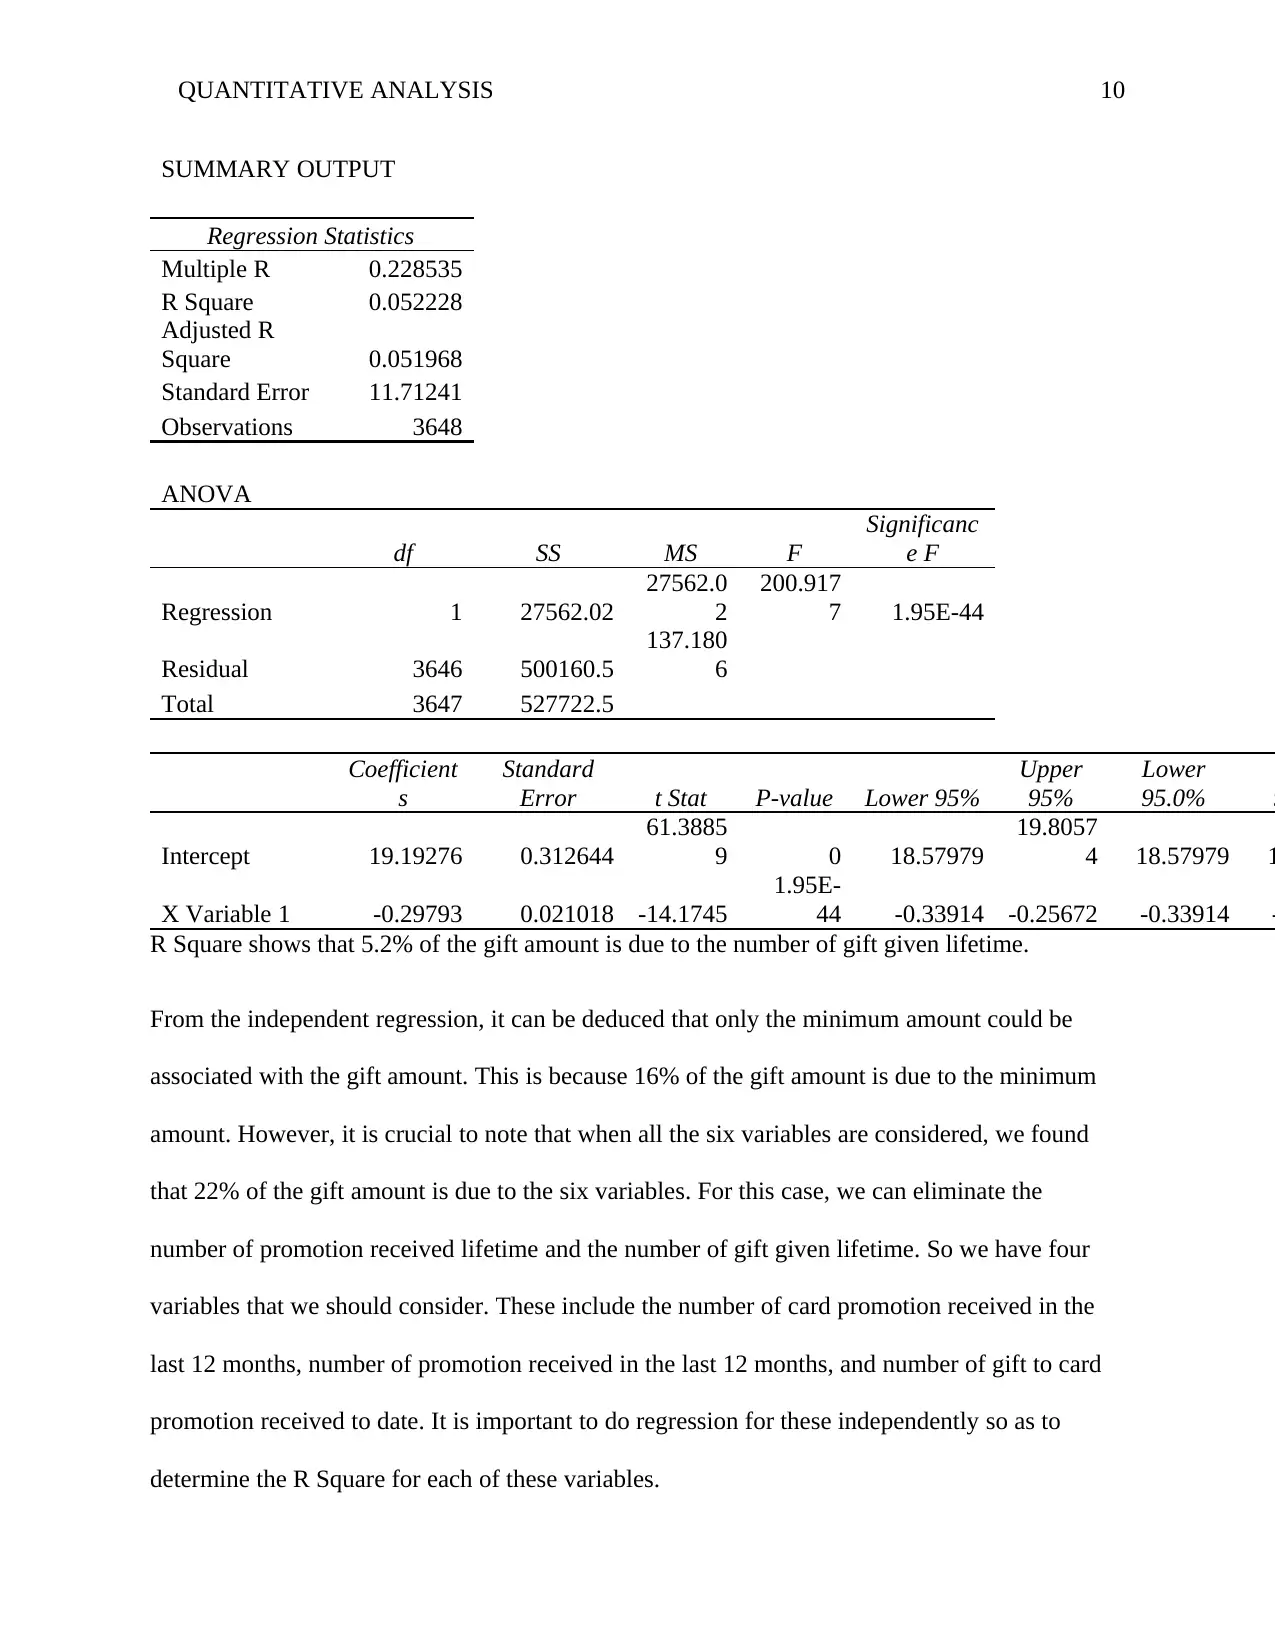
R Square shows that 5.2% of the gift amount is due to the number of gift given lifetime.
From the independent regression, it can be deduced that only the minimum amount could be
associated with the gift amount. This is because 16% of the gift amount is due to the minimum
amount. However, it is crucial to note that when all the six variables are considered, we found
that 22% of the gift amount is due to the six variables. For this case, we can eliminate the
number of promotion received lifetime and the number of gift given lifetime. So we have four
variables that we should consider. These include the number of card promotion received in the
last 12 months, number of promotion received in the last 12 months, and number of gift to card
promotion received to date. It is important to do regression for these independently so as to
determine the R Square for each of these variables.
SUMMARY OUTPUT
Regression Statistics
Multiple R 0.228535
R Square 0.052228
Adjusted R
Square 0.051968
Standard Error 11.71241
Observations 3648
ANOVA
df SS MS F
Significanc
e F
Regression 1 27562.02
27562.0
2
200.917
7 1.95E-44
Residual 3646 500160.5
137.180
6
Total 3647 527722.5
Coefficient
s
Standard
Error t Stat P-value Lower 95%
Upper
95%
Lower
95.0%
U
9
Intercept 19.19276 0.312644
61.3885
9 0 18.57979
19.8057
4 18.57979 1
X Variable 1 -0.29793 0.021018 -14.1745
1.95E-
44 -0.33914 -0.25672 -0.33914 -
R Square shows that 5.2% of the gift amount is due to the number of gift given lifetime.
From the independent regression, it can be deduced that only the minimum amount could be
associated with the gift amount. This is because 16% of the gift amount is due to the minimum
amount. However, it is crucial to note that when all the six variables are considered, we found
that 22% of the gift amount is due to the six variables. For this case, we can eliminate the
number of promotion received lifetime and the number of gift given lifetime. So we have four
variables that we should consider. These include the number of card promotion received in the
last 12 months, number of promotion received in the last 12 months, and number of gift to card
promotion received to date. It is important to do regression for these independently so as to
determine the R Square for each of these variables.
Paraphrase This Document
Need a fresh take? Get an instant paraphrase of this document with our AI Paraphraser
QUANTITATIVE ANALYSIS 11
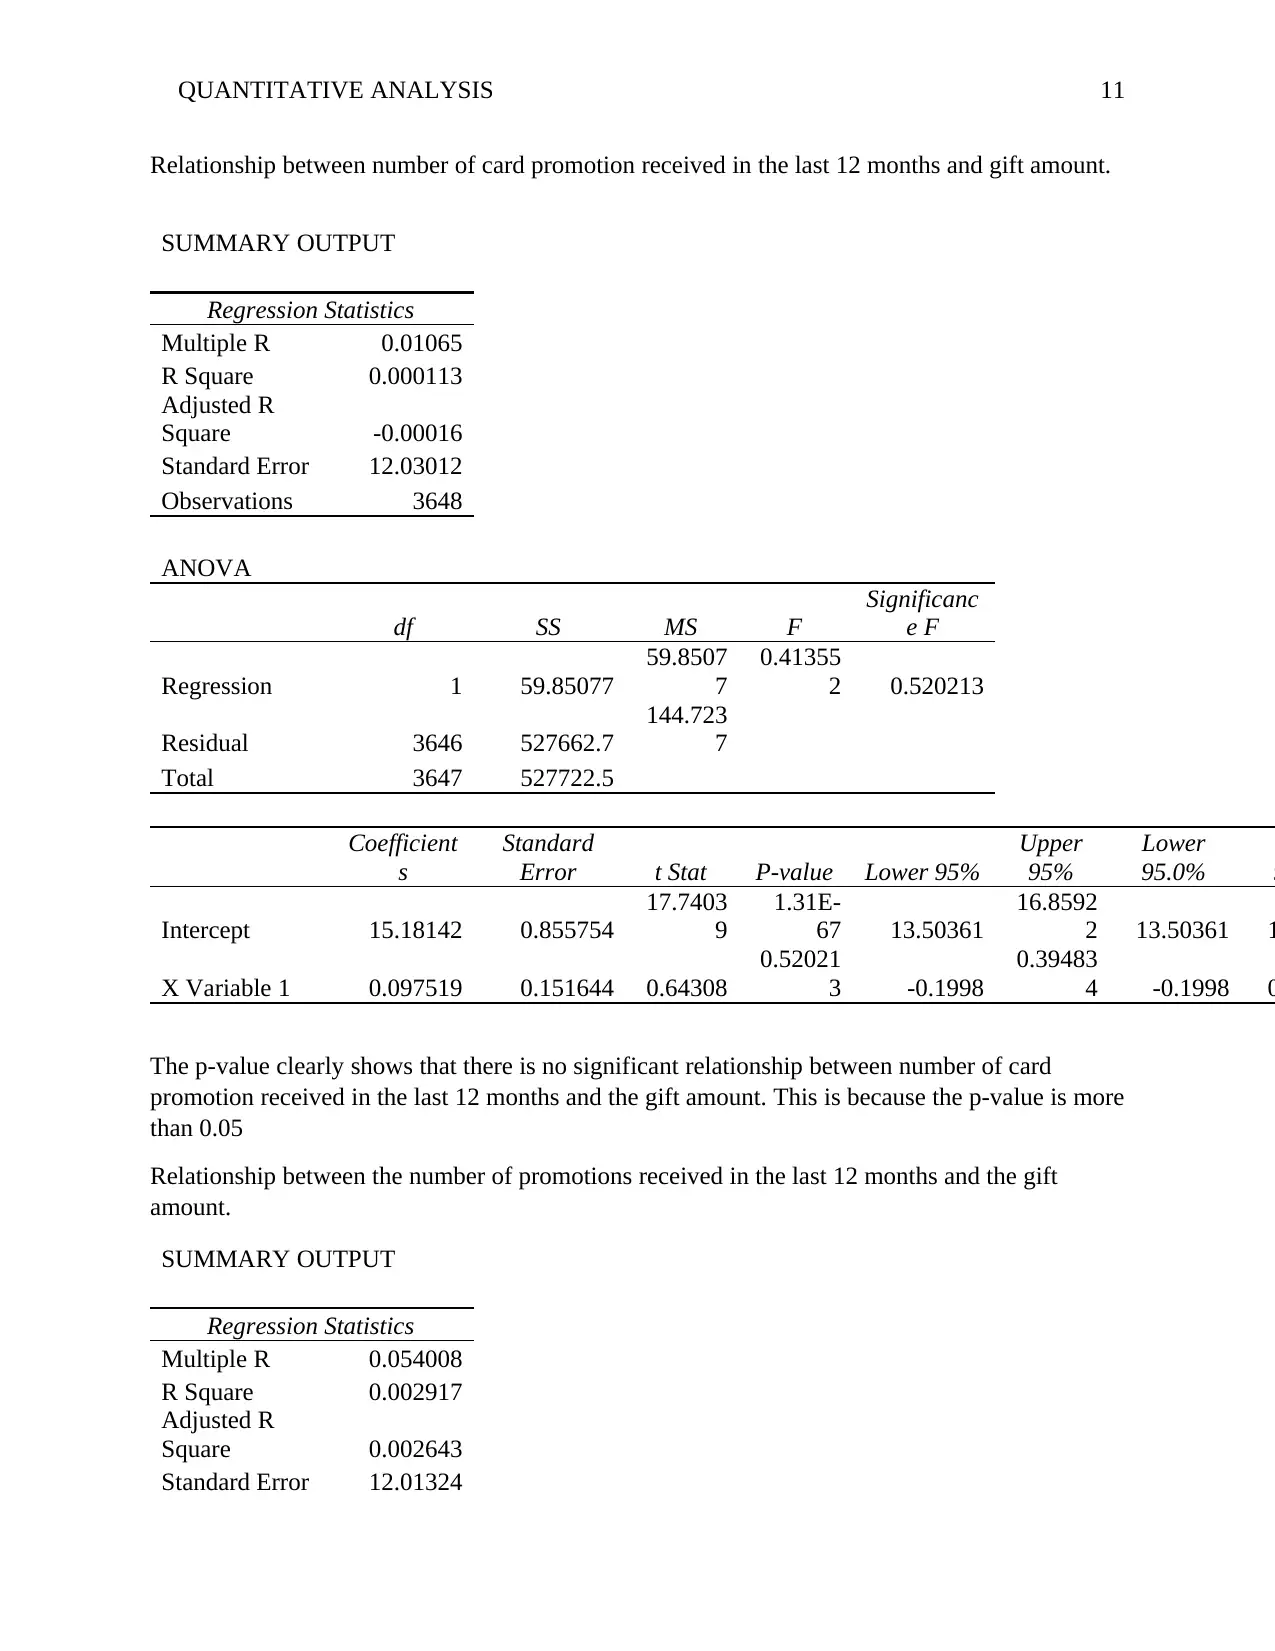
Relationship between number of card promotion received in the last 12 months and gift amount.
SUMMARY OUTPUT
Regression Statistics
Multiple R 0.01065
R Square 0.000113
Adjusted R
Square -0.00016
Standard Error 12.03012
Observations 3648
ANOVA
df SS MS F
Significanc
e F
Regression 1 59.85077
59.8507
7
0.41355
2 0.520213
Residual 3646 527662.7
144.723
7
Total 3647 527722.5
Coefficient
s
Standard
Error t Stat P-value Lower 95%
Upper
95%
Lower
95.0%
U
9
Intercept 15.18142 0.855754
17.7403
9
1.31E-
67 13.50361
16.8592
2 13.50361 1
X Variable 1 0.097519 0.151644 0.64308
0.52021
3 -0.1998
0.39483
4 -0.1998 0
The p-value clearly shows that there is no significant relationship between number of card
promotion received in the last 12 months and the gift amount. This is because the p-value is more
than 0.05
Relationship between the number of promotions received in the last 12 months and the gift
amount.
SUMMARY OUTPUT
Regression Statistics
Multiple R 0.054008
R Square 0.002917
Adjusted R
Square 0.002643
Standard Error 12.01324
QUANTITATIVE ANALYSIS 12
Observations 3648
ANOVA
df SS MS F
Significanc
e F
Regression 1 1539.267
1539.26
7 10.6658 0.001101
Residual 3646 526183.3 144.318
Total 3647 527722.5
Coefficient
s
Standard
Error t Stat P-value Lower 95%
Upper
95%
Lower
95.0%
U
9
Intercept 14.0082 0.559654
25.0301
3
9.9E-
128 12.91093
15.1054
6 12.91093 1
X Variable 1 0.128653 0.039393
3.26585
4
0.00110
1 0.051418
0.20588
8 0.051418 0
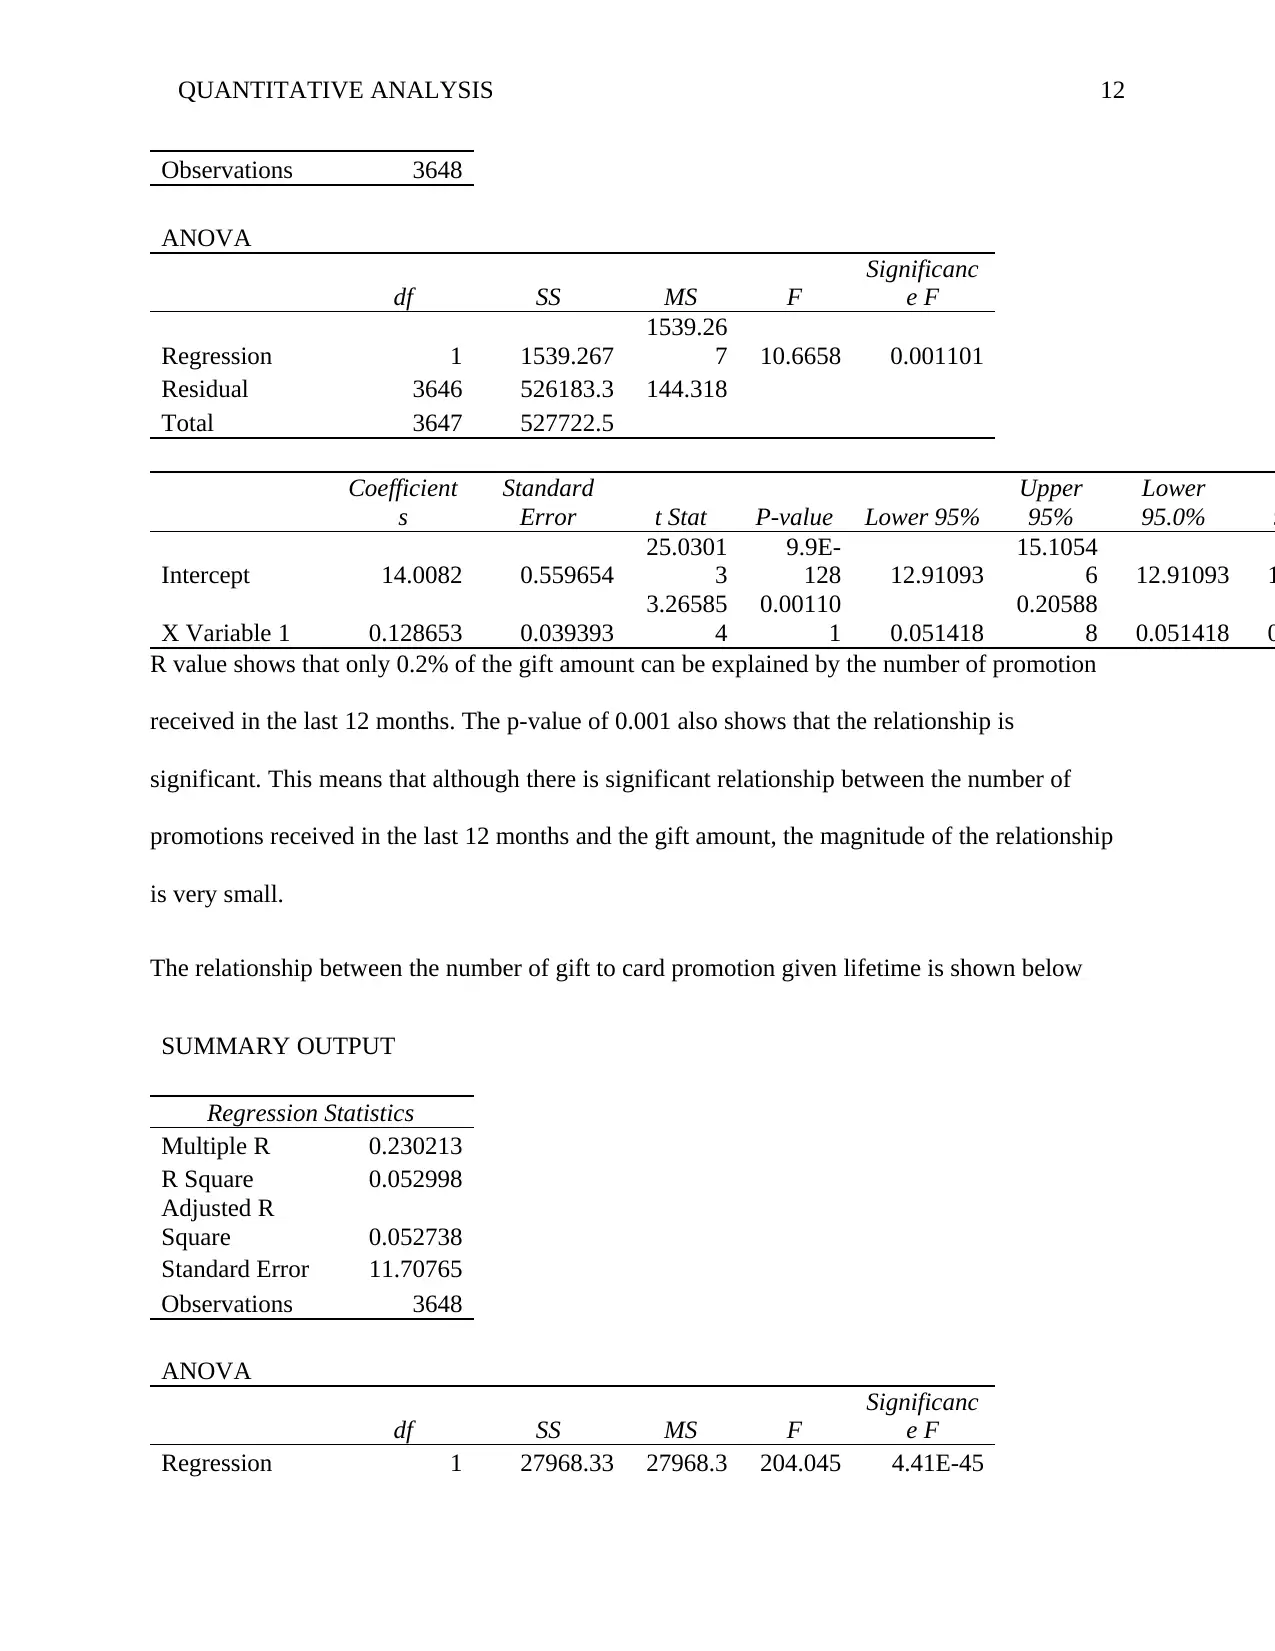
R value shows that only 0.2% of the gift amount can be explained by the number of promotion
received in the last 12 months. The p-value of 0.001 also shows that the relationship is
significant. This means that although there is significant relationship between the number of
promotions received in the last 12 months and the gift amount, the magnitude of the relationship
is very small.
The relationship between the number of gift to card promotion given lifetime is shown below
SUMMARY OUTPUT
Regression Statistics
Multiple R 0.230213
R Square 0.052998
Adjusted R
Square 0.052738
Standard Error 11.70765
Observations 3648
ANOVA
df SS MS F
Significanc
e F
Regression 1 27968.33 27968.3 204.045 4.41E-45
Observations 3648
ANOVA
df SS MS F
Significanc
e F
Regression 1 1539.267
1539.26
7 10.6658 0.001101
Residual 3646 526183.3 144.318
Total 3647 527722.5
Coefficient
s
Standard
Error t Stat P-value Lower 95%
Upper
95%
Lower
95.0%
U
9
Intercept 14.0082 0.559654
25.0301
3
9.9E-
128 12.91093
15.1054
6 12.91093 1
X Variable 1 0.128653 0.039393
3.26585
4
0.00110
1 0.051418
0.20588
8 0.051418 0
R value shows that only 0.2% of the gift amount can be explained by the number of promotion
received in the last 12 months. The p-value of 0.001 also shows that the relationship is
significant. This means that although there is significant relationship between the number of
promotions received in the last 12 months and the gift amount, the magnitude of the relationship
is very small.
The relationship between the number of gift to card promotion given lifetime is shown below
SUMMARY OUTPUT
Regression Statistics
Multiple R 0.230213
R Square 0.052998
Adjusted R
Square 0.052738
Standard Error 11.70765
Observations 3648
ANOVA
df SS MS F
Significanc
e F
Regression 1 27968.33 27968.3 204.045 4.41E-45
⊘ This is a preview!⊘
Do you want full access?
Subscribe today to unlock all pages.
Trusted by 1+ million students worldwide
1 out of 20

Your All-in-One AI-Powered Toolkit for Academic Success.
+13062052269
info@desklib.com
Available 24*7 on WhatsApp / Email
![[object Object]](/_next/static/media/star-bottom.7253800d.svg)
Unlock your academic potential
Copyright © 2020–2026 A2Z Services. All Rights Reserved. Developed and managed by ZUCOL.