Biorhythm Analysis: A Practical Implementation Using Python, NumPy

Verified

Added on  2024/05/15

|5
|630
|239
Practical Assignment
AI Summary
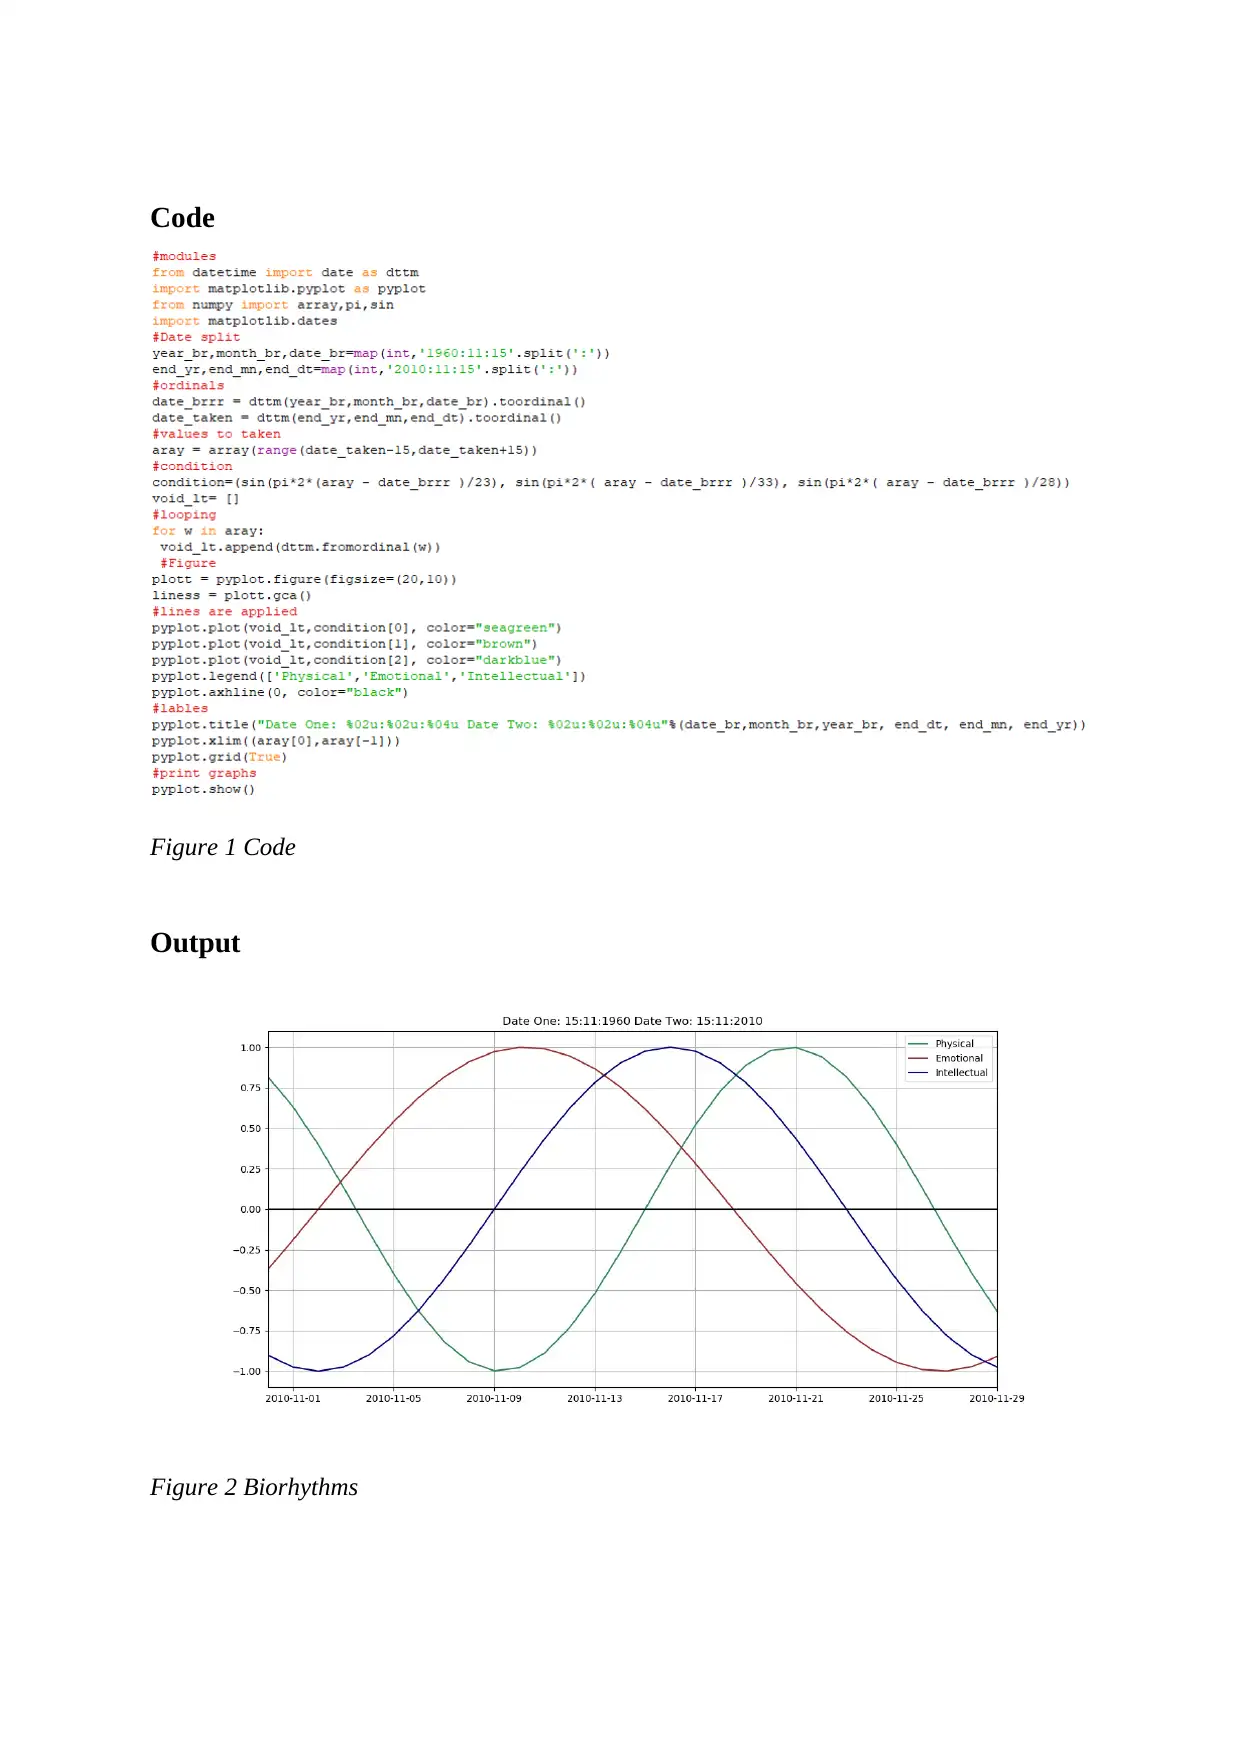
This assignment presents a practical implementation of biorhythm analysis using Python. The core of the analysis involves calculating and visualizing three primary cycles: physical, emotional, and intellectual. The program takes the user's date of birth and a target date as input, then calculates the variations using sine wave equations for each cycle. NumPy is used for numerical computations, and Matplotlib is employed to generate a graphical representation of the biorhythms. The resulting graph displays the three cycles in distinct colors, each with a unique wavelength (23 for physical, 28 for emotional, and 33 for intellectual). The code effectively demonstrates how to use Python to model and visualize biorhythms, offering insights into potential energetic and emotional patterns. References to relevant Python libraries and techniques are also included.
Document Page
Contents
Biorhythm.............................................................................................................................................2
Biorhythms as sine curves.....................................................................................................................2
Algorithm..............................................................................................................................................2
Code......................................................................................................................................................3
Output....................................................................................................................................................3
Features.................................................................................................................................................4
Discussion.............................................................................................................................................4
References.............................................................................................................................................5
Figures
Figure 1 Code........................................................................................................................................3
Figure 2 Biorhythms..............................................................................................................................3
tabler-icon-diamond-filled.svg

Secure Best Marks with AI Grader

Need help grading? Try our AI Grader for instant feedback on your assignments.
Document Page
Biorhythm
A biorhythm is a chart or is referred as a model which is used in predicting the aspects in an
individual’s life by using mathematics. It is used for predicting mood, stamina or intelligence.
It represents the biological cycle which starts for the birth and goes on throughout the life.
Biorhythms as sine curves
Biorhythms are based on sine waves which are also called as oscillating waves. There are
three formulas using which the three cycles which are emotional, intellectual and physical are
calculated. All the curves are different from one another. Biorhythms are not scientific but are
somewhat true as there is no certainty of an individual’s energetic behaviour or laziness. If at
a certain position the cycle goes high then that individual and do great things in that area and
vice versa. On the time of birth, all the cycles are at 0. All the cycles have different periods
but possess similar amplitudes.
Algorithm
1. Take DOB of user and date of target as input.
2. Calculate the variation by using formula, “= array(range(target_dt - 15,target_dt + 15))”
3. Calculate the physical cycle using equation, y = sin (2 πt
23 )
4. Calculate the physical cycle using equation, y = sin (2 πt
28 )
5. Calculate the physical cycle using equation, y = sin (2 πt
3 3 )
6. Plot and display the graph
Document Page
Code
Figure 1 Code
Output
Figure 2 Biorhythms
Document Page
Features
The biorhythm that has been presented above represents the three cycles, each having a
different colour. All the cycles lines are difference and distinctive. Having different colour of
each cycle, it is easy to distinguish between the three cycles. Legend is also present in the
graph for a better understanding to the user.
Discussion
The code is written in python and biorhythm has been calculated by using 2 preferable dates
decided by the user. The biorhythm graph uses 3 cycles which are physical, intellectual and
emotional. Modules such as NumPy and Matplotlib has been used for the successful
graphical representation of the biorhythm graph. The working of the program starts with the
user inputting two different date’s say his/her birth date and the date he/she wants to know
till. After the input, the algorithm is processed using which all the mathematical calculations
are done and the graph is plotted including three cycles. The amplitude of the cycles are same
but their period is different. For physical cycle wavelength 23 is used, for intellectual cycle
wavelength 33 is used and for the emotional cycle wavelength 28 is used. After all the
calculations the curves representing the cycles are plotted using different colours each to the
graph and the graph is displayed to the user.
tabler-icon-diamond-filled.svg

Secure Best Marks with AI Grader

Need help grading? Try our AI Grader for instant feedback on your assignments.
Document Page
References
Bernard, J., 2016. Numbers, Dates, and Times. In Python Recipes Handbook (pp. 11-20).
Apress, Berkeley, CA.
Nelli, F., 2018. Python data analytics: with pandas, numpy, and matplotlib.
Pajankar, A., 2017. Introduction to NumPy. In Raspberry Pi Supercomputing and Scientific
Programming (pp. 109-128). Apress, Berkeley, CA.
chevron_up_icon
1 out of 5
circle_padding
hide_on_mobile
zoom_out_icon
logo.png

Your All-in-One AI-Powered Toolkit for Academic Success.

Available 24*7 on WhatsApp / Email

[object Object]