Data Science Project: Child Mortality Analysis and Data Wrangling

Verified

Added on  2020/04/07

|27
|1602
|56
Project
AI Summary
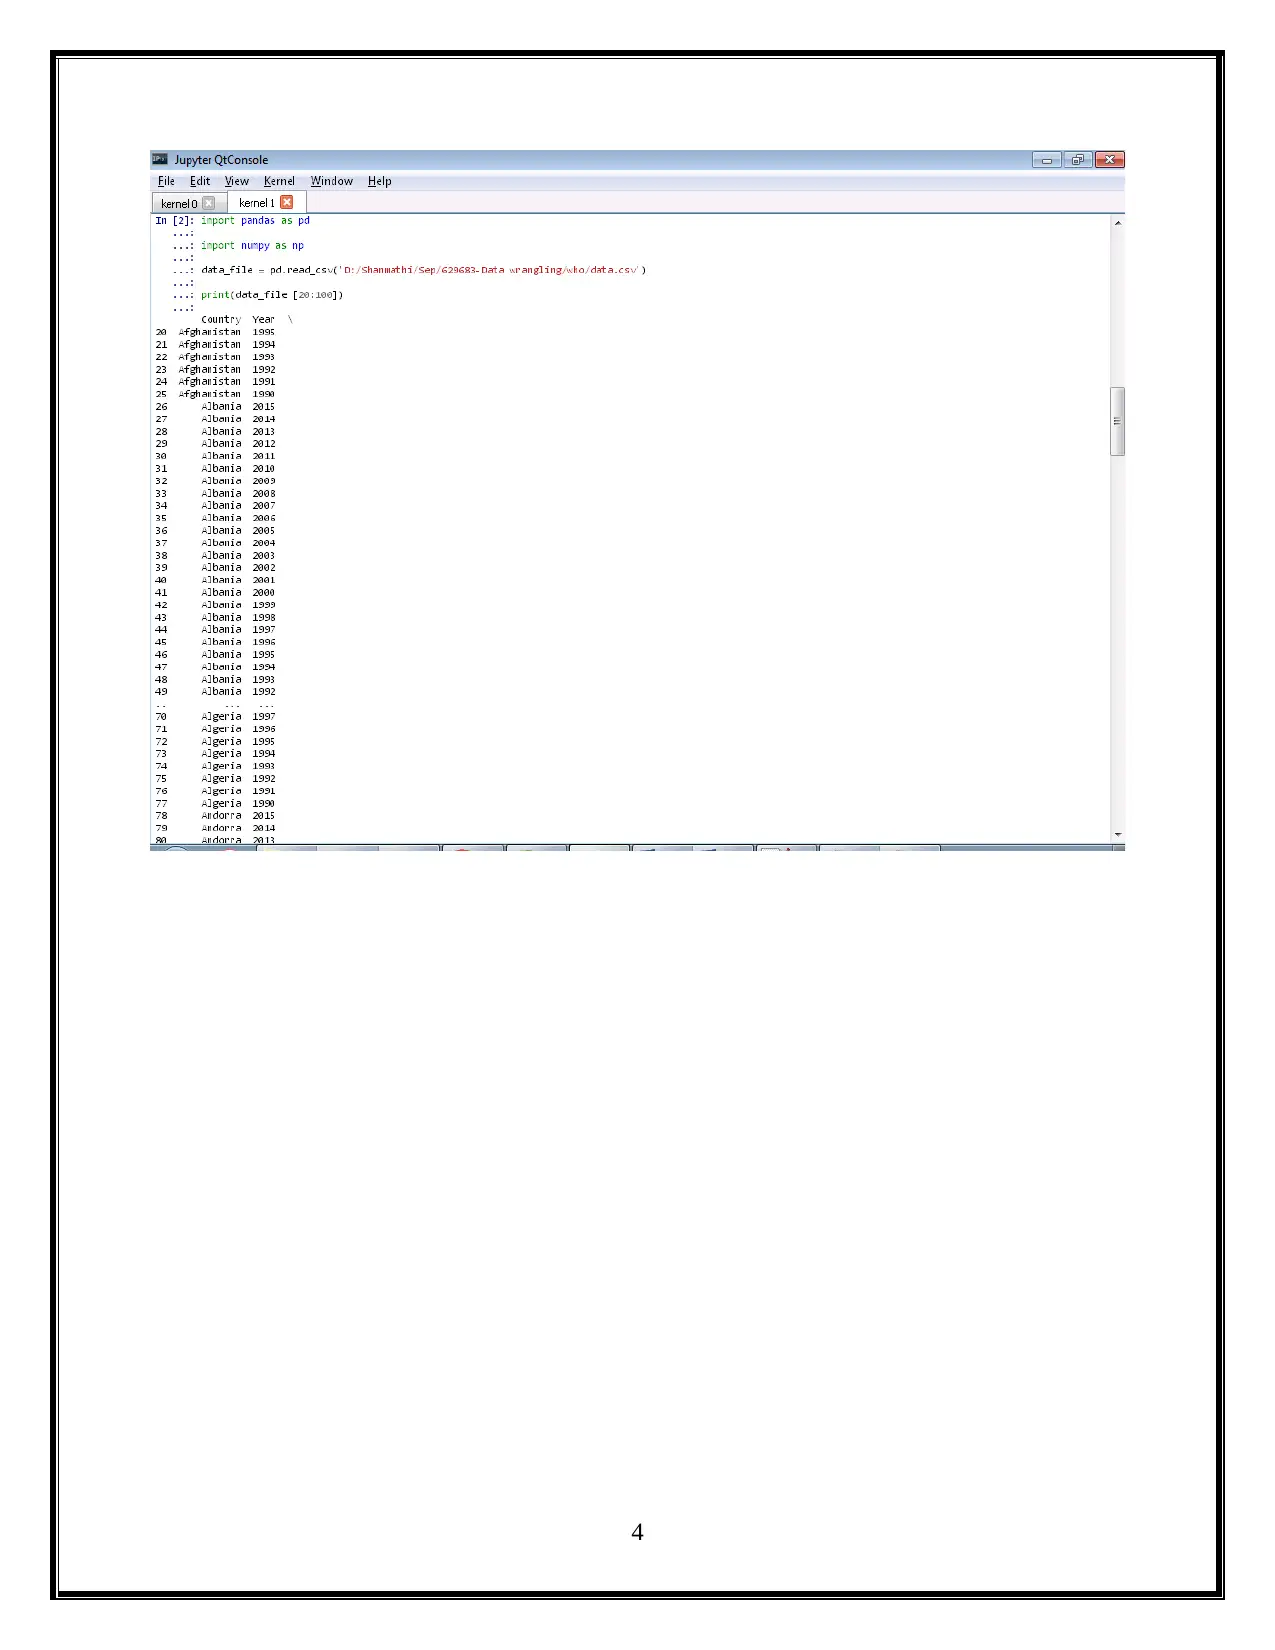
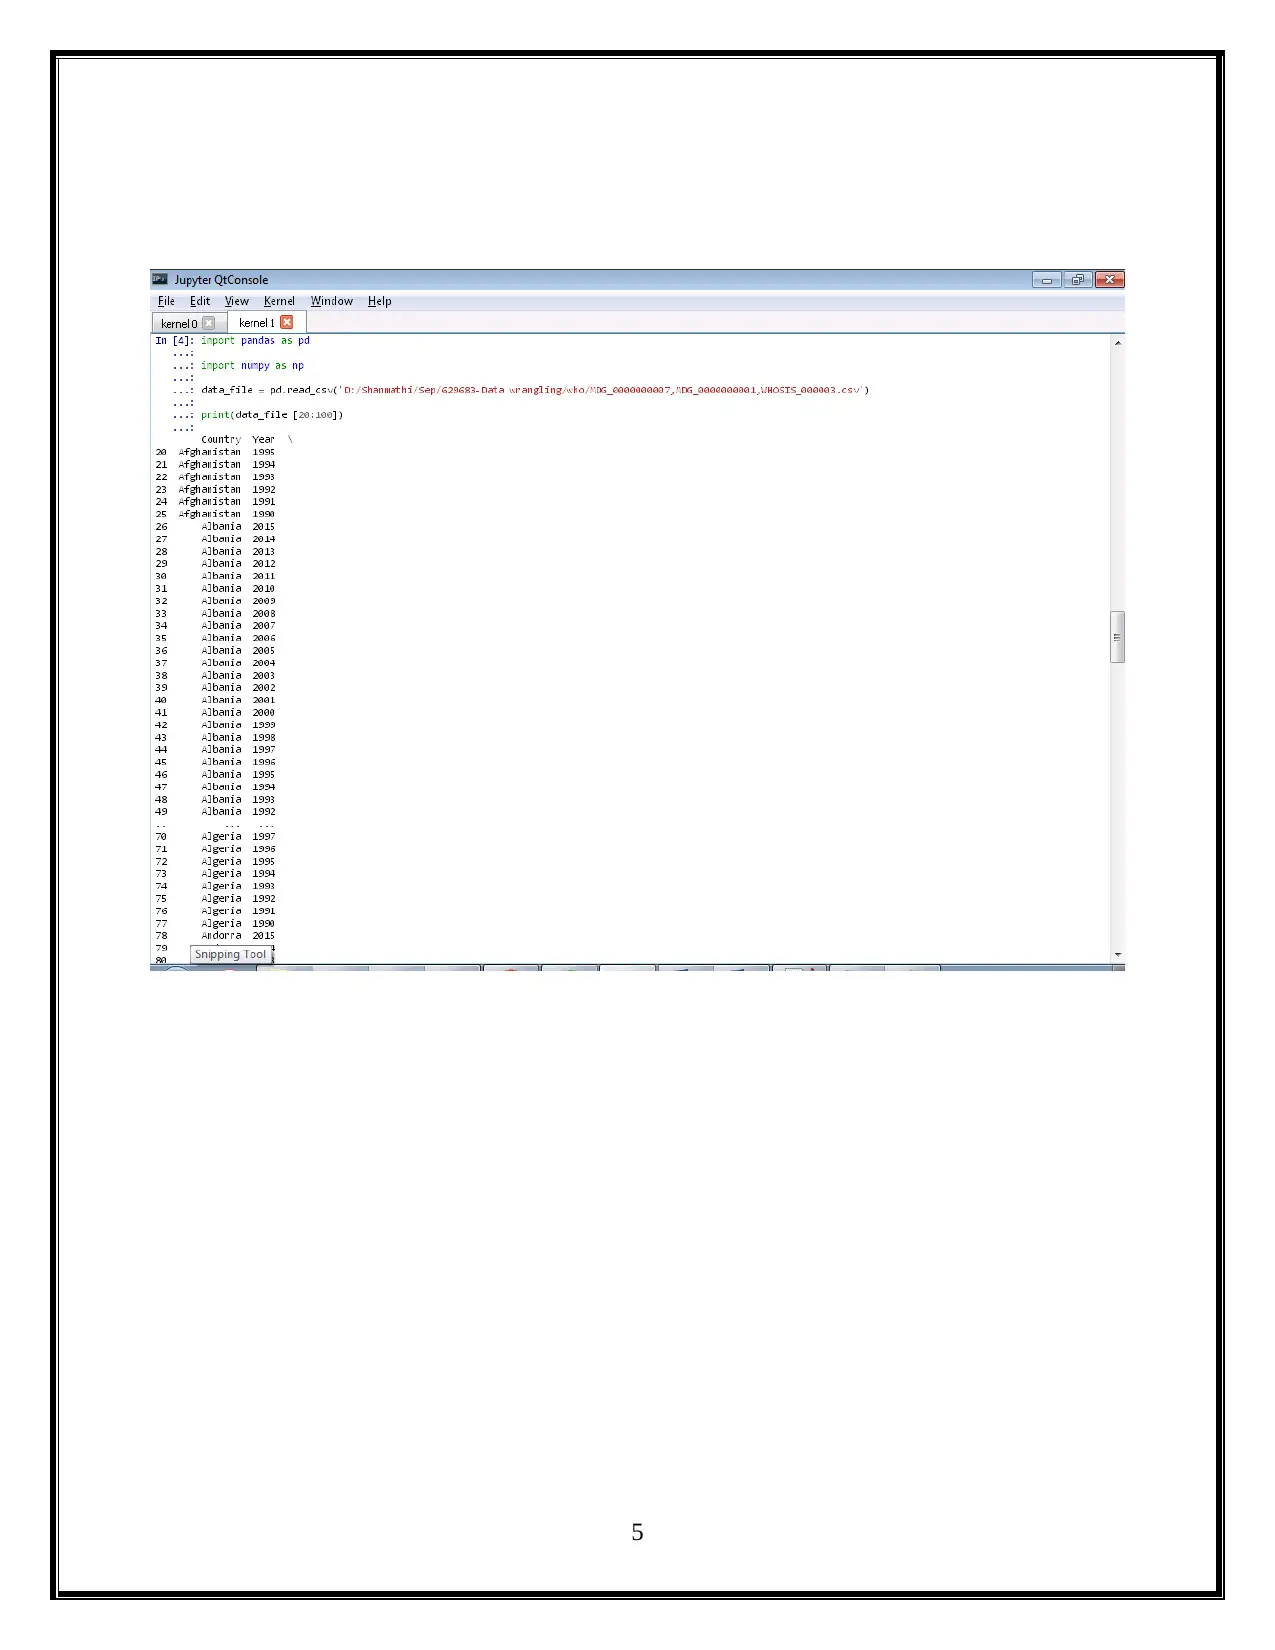
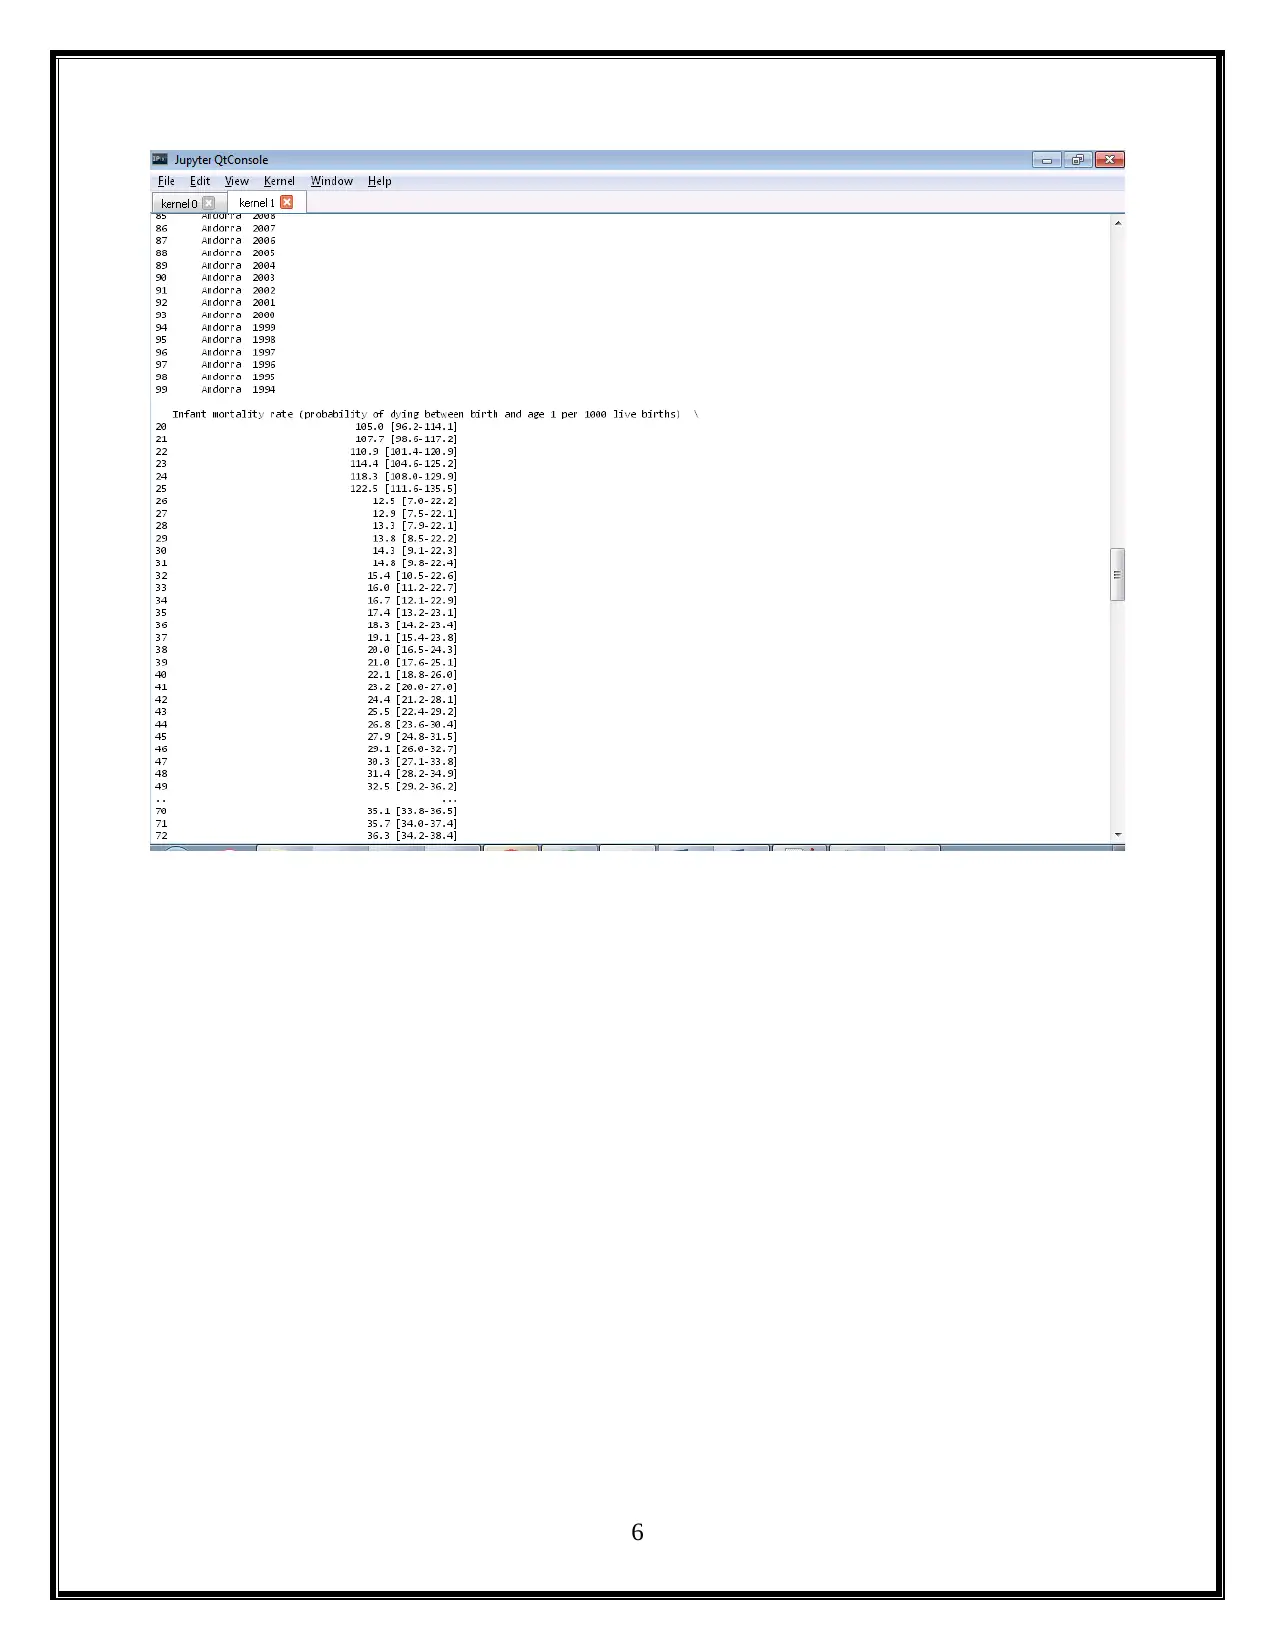
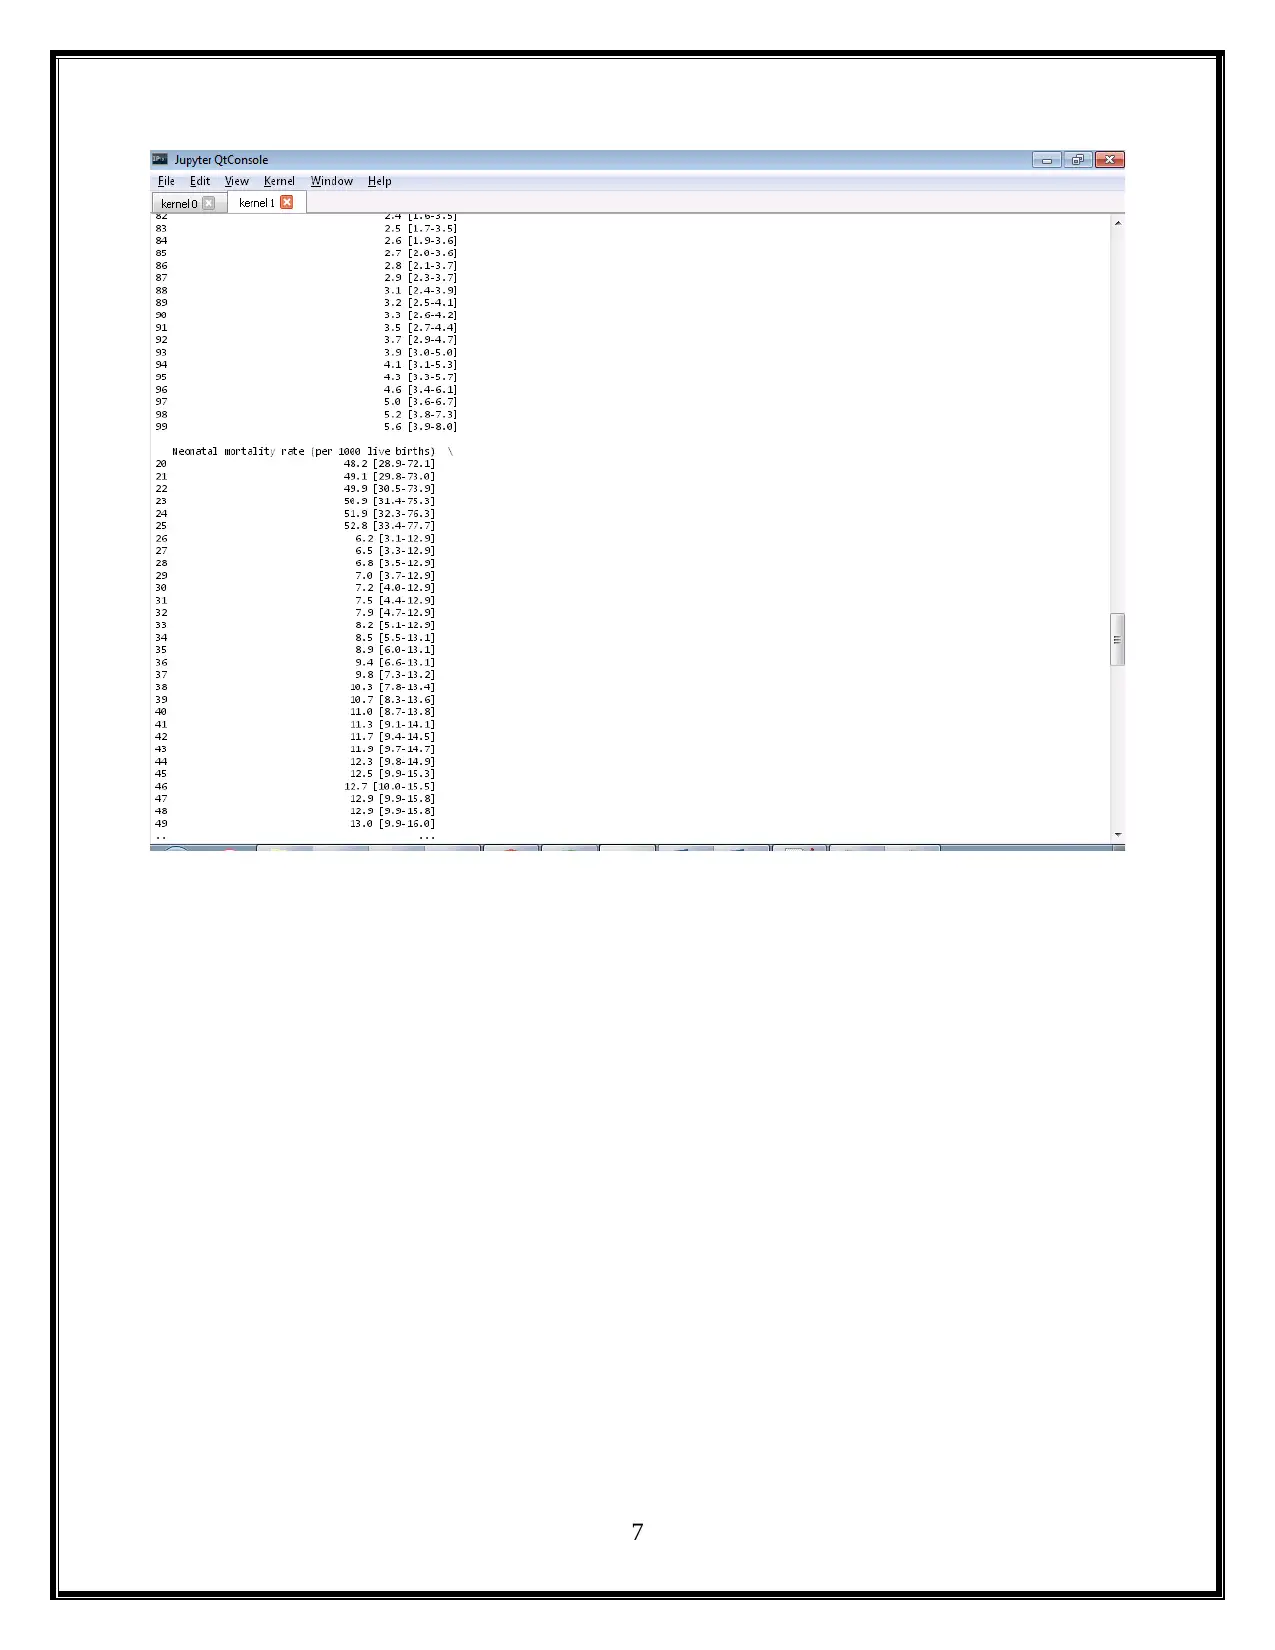
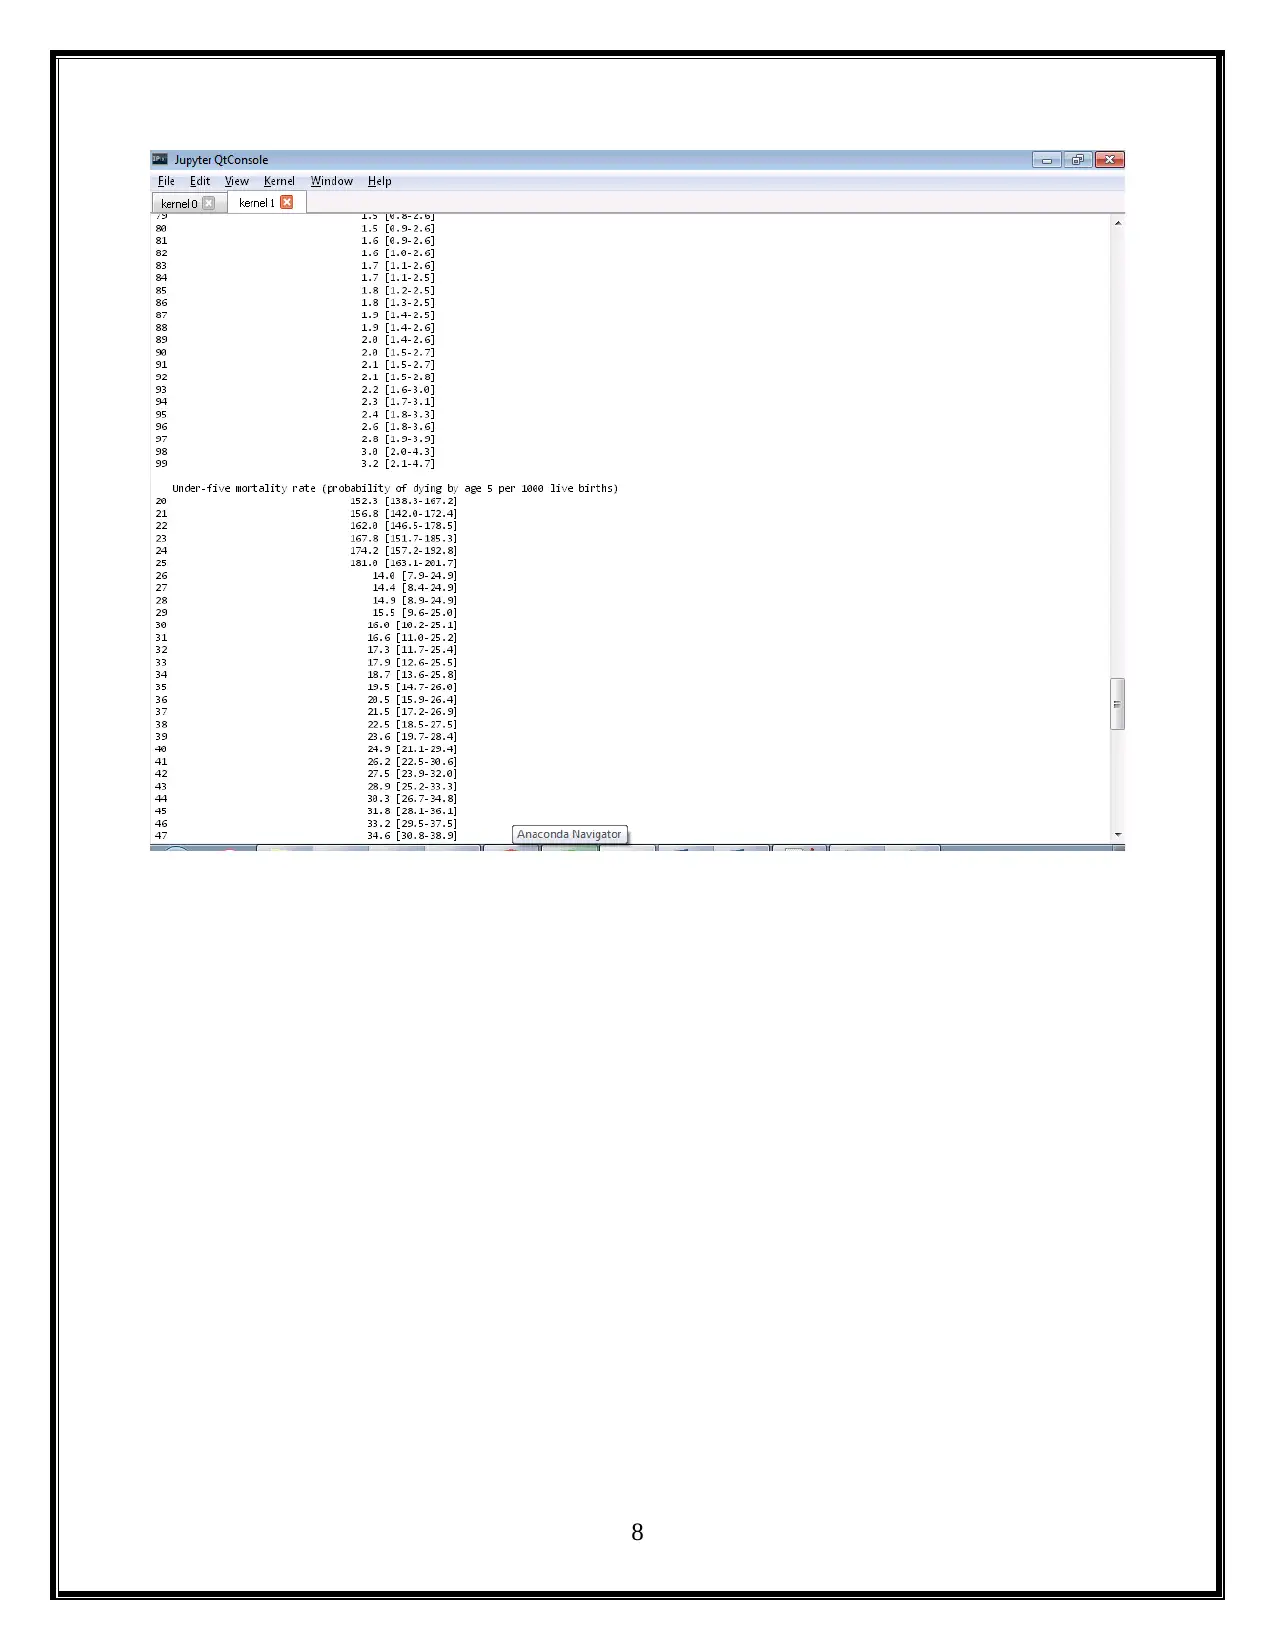
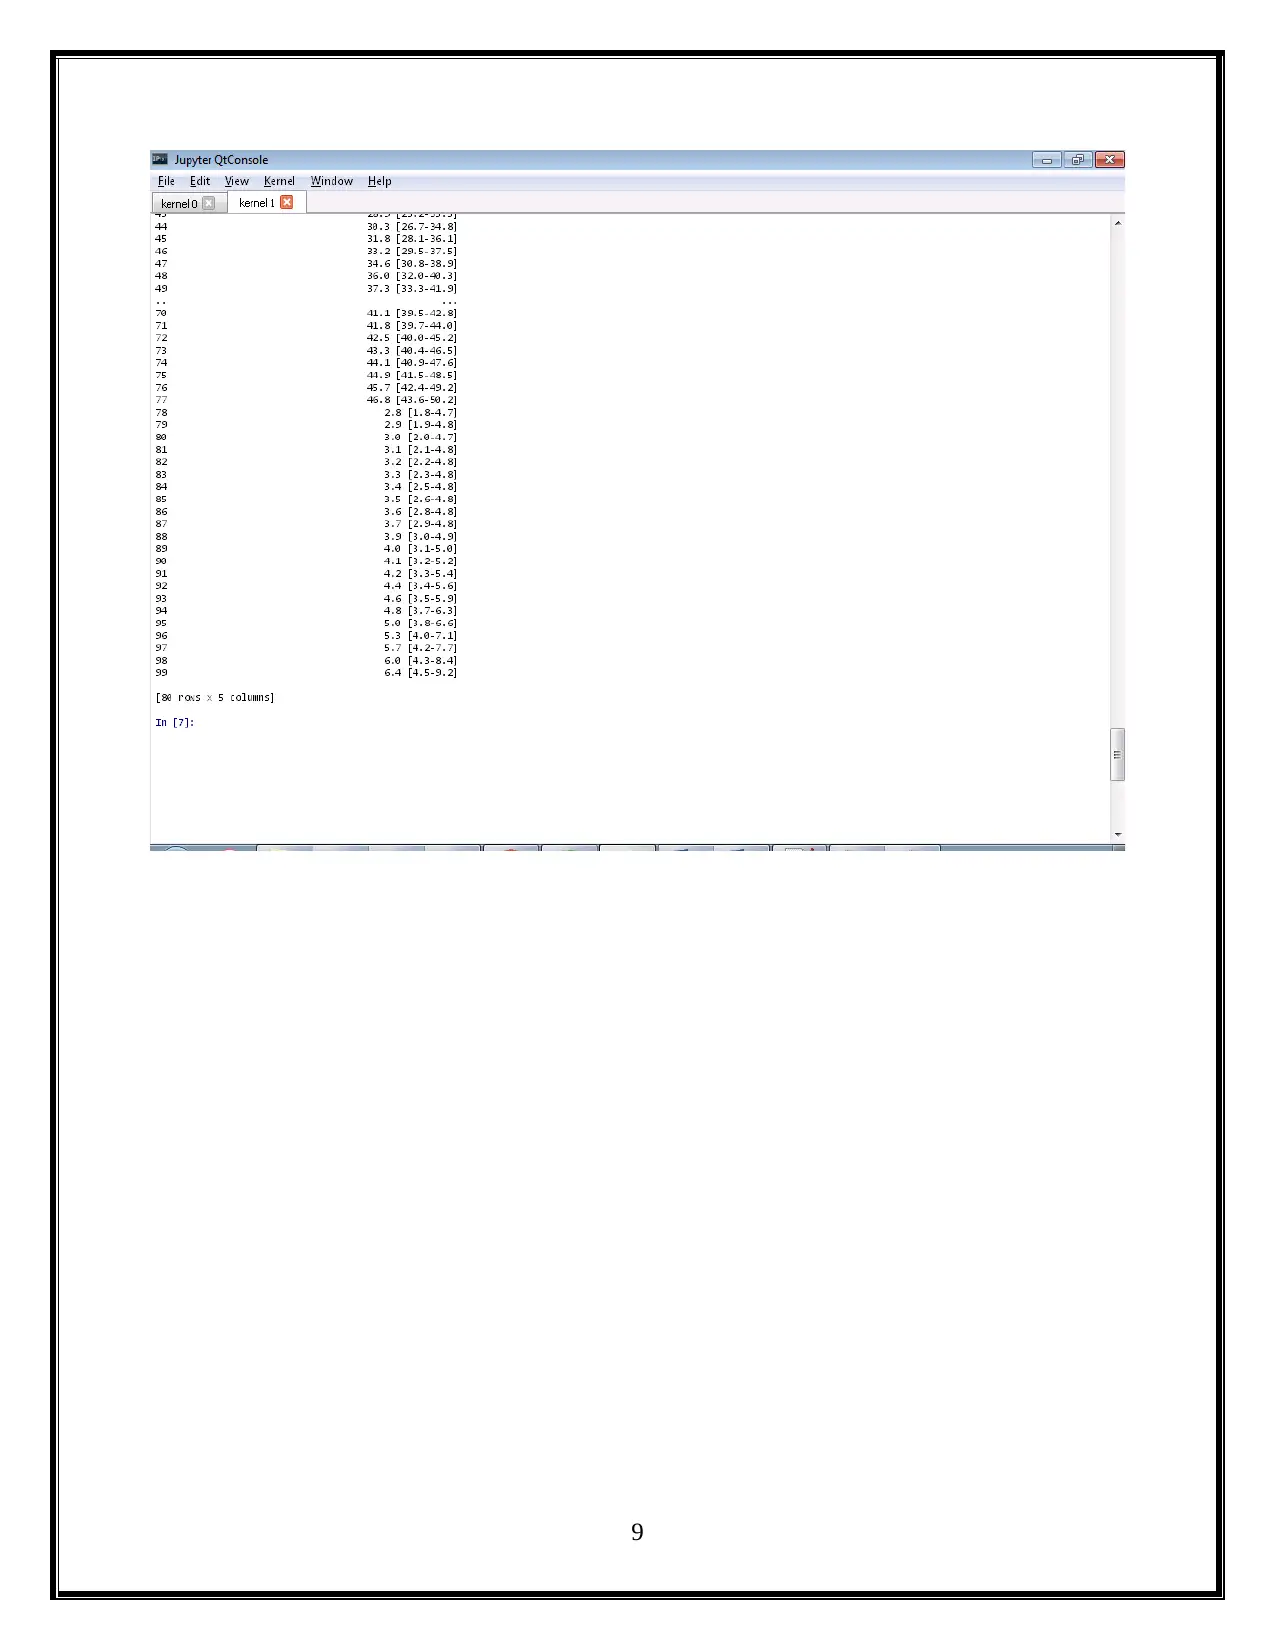
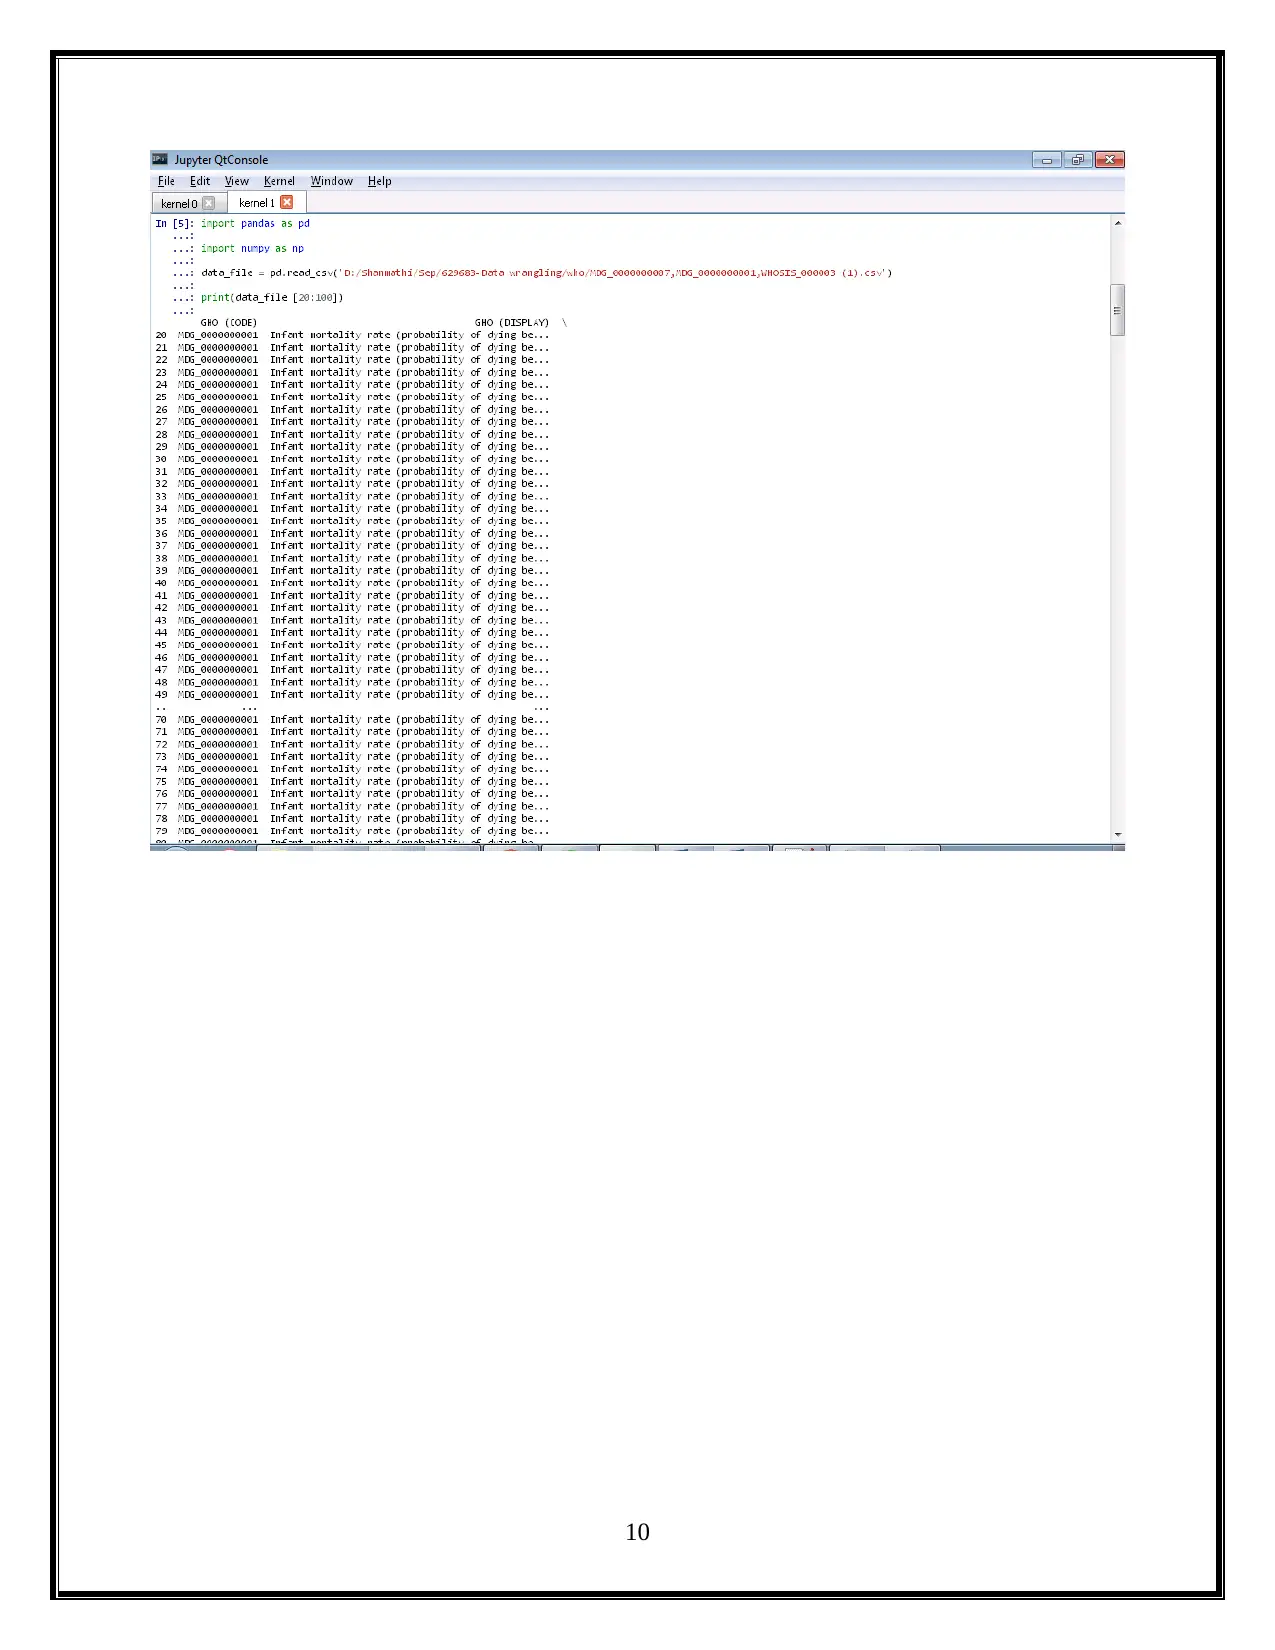
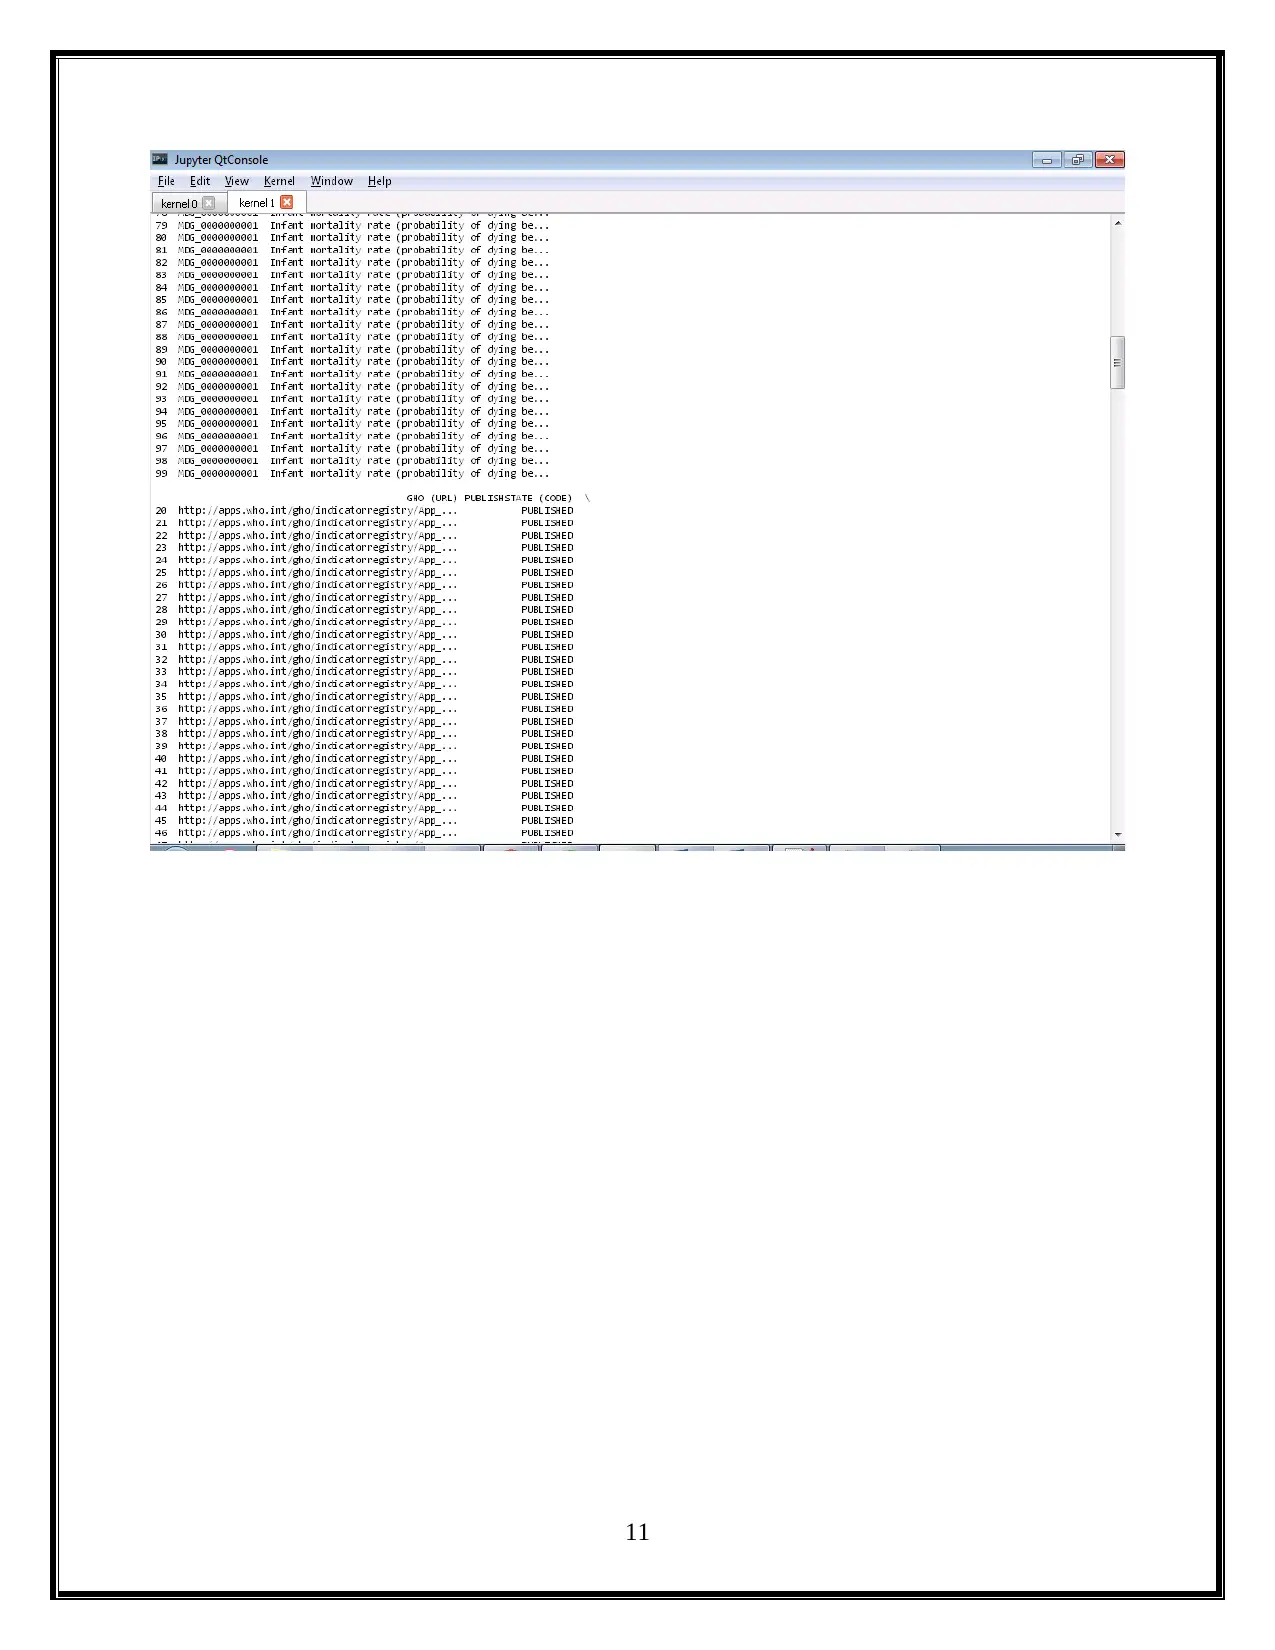
This project utilizes Python and Jupyter notebooks to analyze child mortality data from WHO. The assignment is divided into two parts: Part 1 focuses on data wrangling of CSV files, generating Python code to display mortality rates for different countries and years, and creating visualizations using libraries like Pandas and Matplotlib. Part 2 involves exploring nested JSON files to further analyze mortality rates, identify the top causes of child mortality (including pneumonia, birth complications, and diarrhea), and discuss potential solutions such as improved access to healthcare, nutrition, and sanitation. The project concludes with a summary of the findings and references relevant sources.
Document Page
Data
wrangling
tabler-icon-diamond-filled.svg

Paraphrase This Document

Need a fresh take? Get an instant paraphrase of this document with our AI Paraphraser
Document Page
Table of Contents
Overview.........................................................................................................................................2
TASK 2...........................................................................................................................................2
PART 1........................................................................................................................................2
PART 2......................................................................................................................................22
Reasons of Child Mortality.........................................................................................................23
Solution for child mortality.........................................................................................................24
Implementation............................................................................................................................24
Conclusion....................................................................................................................................24
References.....................................................................................................................................25
1
Document Page
Overview
In the project, python Jupiter notebook will be used for implementing child mortality
graphs as per given requirements. The data will be examined, inspected and will be provided as
python code with produced graph screenshots. Further, data wrangling process will be done. The
given csv files will be used and the output screenshots will be produced for child mortality with
numerous graphs.
The statistics is taken from the (WHO) provided link.
TASK 2
The task 2 is separated into two parts:
1. Part 1
2. Part 2
PART 1
Form the given csv file, the python code is produced and executed in part 1. The below
screenshot shows the csv file produced in python code for showing the year, country, Neonatal
mortality rate, infant mortality rate, and Under-five mortality rate. By introducing Pandas library
files in Jupiter platform, the python code is produced further. A brief introduction to python is
provided below
Python
Python is a one of the most widely used high level language and it is fast becoming the
preferred language for aspiring data scientists and for good reasons. It is the most important
language to learn and it also provides the rich ecosystem of a programming language and the
depth of good scientific computation libraries. Its major benefit is breadth.
Python is an interpreter that are available in many of the operating system, object based,
high-level programming language with contain dynamic semantics.it is very simple to learn the
syntax emphasis the readability and hence it decreases the overall production cost of the program
2
Document Page
maintenance (DataCamp Community, 2017). It care about the modules and packages which
boosts the package modularity and the code can be reuse.
Why python?
Most of the user chose Python in excess of other preferences because Python is easy and
simple to get started with and it can able to handles data wrangling tasks in a simple and
straightforward way. The Python community workings to generate a supportive background for
newcomers.
Python libraries
NumPy
NumPy is abbreviated as Numerical Python. It provides useful features for processes on
n-arrays and matrices in Python. The library offers vectorization of scientific operations on the
NumPy array type, which improves the performance and as a result speeds up the program
execution.
Pandas
The Python data manipulation library Pandas which is mainly used for data manipulation;
for those who are just opening out, this strength imply that this python package that can only be
close when preprocessing the information, but much a smaller amount is only true.
Matplotlib
The library is maintained by various platforms and it makes use of different GUI kits for the
representation of resultant visualizations.
Seaborn
Seaborn is mainly concentrated on the picturing of the statistical models; such type of
visualizations contains heat maps, that can be summarize the information but it still represent the
overall distributions. Seaborn is built on Matplotlib and extremely dependent on that library.
3
tabler-icon-diamond-filled.svg

Paraphrase This Document

Need a fresh take? Get an instant paraphrase of this document with our AI Paraphraser
Document Page
4
Document Page
5
Document Page
6
tabler-icon-diamond-filled.svg

Paraphrase This Document

Need a fresh take? Get an instant paraphrase of this document with our AI Paraphraser
Document Page
7
Document Page
8
Document Page
9
tabler-icon-diamond-filled.svg

Paraphrase This Document

Need a fresh take? Get an instant paraphrase of this document with our AI Paraphraser
Document Page
10
Document Page
11
chevron_up_icon
1 out of 27
circle_padding
hide_on_mobile
zoom_out_icon
[object Object]