MATH 1053 - Quantitative Methods: Q Events Case Study Report
VerifiedAdded on 2023/06/03
|17
|3601
|474
Case Study
AI Summary
This case study report focuses on optimising operations at Q Events Limited. It includes an analysis of historical business data, aiming to provide insights and models for increased profitability. The report examines the impact of social media on ticket sales, forecasting appropriate platforms for event promotion. It also develops models to determine optimal event durations across different cities and to forecast ticket prices based on advertising budgets. The analysis recommends specific event organisation strategies to minimise costs, identifies the influence of social media platforms on ticket sales for different event types, and models event running periods for Sydney, Adelaide, and Melbourne. Furthermore, it explores the relationship between advertising budgets and ticket prices, concluding with recommendations for Q Events to enhance operational efficiency and profitability, advising on event frequency and social media strategies to optimise marketing efforts.
`
Erro
r:
Refe
renc
e
sour
ce
not
foun
d
UNIVERSITY OF SOUTH AUSTRALIA
Assignment Cover Sheet – Internal
An Assignment cover sheet needs to be included with each assignment. Please complete all
details clearly.
When submitting the assignment online, please ensure this cover sheet is included at the start of
your document. (Not as a separate attachment.)
Please check your Course Information Booklet or contact your School Office for assignment
submission locations.
Name:
Student
ID
Email:
Course code and title: MATH 1053 – Quantitative Methods for Business
School: Info. Tech. & Mathematical Sciences Program Code:
Course Coordinator: Dr Nick Fewster-Young Tutor:
Day, Time, Location of Tutorial:
Paraphrase This Document
Need a fresh take? Get an instant paraphrase of this document with our AI Paraphraser
Assignment number: 2 Due date: by 12 noon on Tuesday 16th
October, 2018
Assignment topic as stated in Course Outline: Case Study Report
Further Information: (e.g. state if extension was granted and attach evidence of approval,
Revised Submission Date)
I declare that the work contained in this assignment is my own, except where acknowledgement
of sources is made.
I authorise the University to test any work submitted by me, using text comparison software, for
instances of plagiarism. I understand this will involve the University or its contractor copying my
work and storing it on a database to be used in future to test work submitted by others.
I understand that I can obtain further information on this matter at
http://www.unisanet.unisa.edu.au/learningconnection/student/studying/integrity.asp
Note: The attachment of this statement on any electronically submitted assignments will be
deemed to have the same authority as a signed statement.
Signed: Date:
Date received from student Assessment/grade Assessed by:
Recorded: Dispatched (if applicable):
2

Optimisation of Operations at the Q Events limited
18/10/2019
prepared by
Student Name
3
18/10/2019
prepared by
Student Name
3
⊘ This is a preview!⊘
Do you want full access?
Subscribe today to unlock all pages.
Trusted by 1+ million students worldwide
Introduction
Following the introduction and the taking off of the Q Events limited, I was contracted by
Gregory Lux to conduct an analysis of the business historical data and provide insights that can
assist the management understand the activities of the business. In addition, I was required to
generate models that can assist the firm optimise its operations in a bid to increase profitability.
Furthermore, the report will contain an analysis that will provide detailed information regarding
the impact of social media on the ticket sales. Under this objective the report will forecast on the
appropriate social media to promote each of the events organised by Q Events.
For the revenue from an event to be maximised there is need to carry out an event over a
calculated amount of time. Therefore, the report will try develop the quantity of time that can
optimise returns from an event in each of the three Australian cities of concern.
Afterwards, the tasked will involve developing a model that can be used to forecast the event
ticket prices using the advertising budget data. This will also involve conducting an analysing in
to the relationship between the ticket prices and the advertising budget.
4
Paraphrase This Document
Need a fresh take? Get an instant paraphrase of this document with our AI Paraphraser
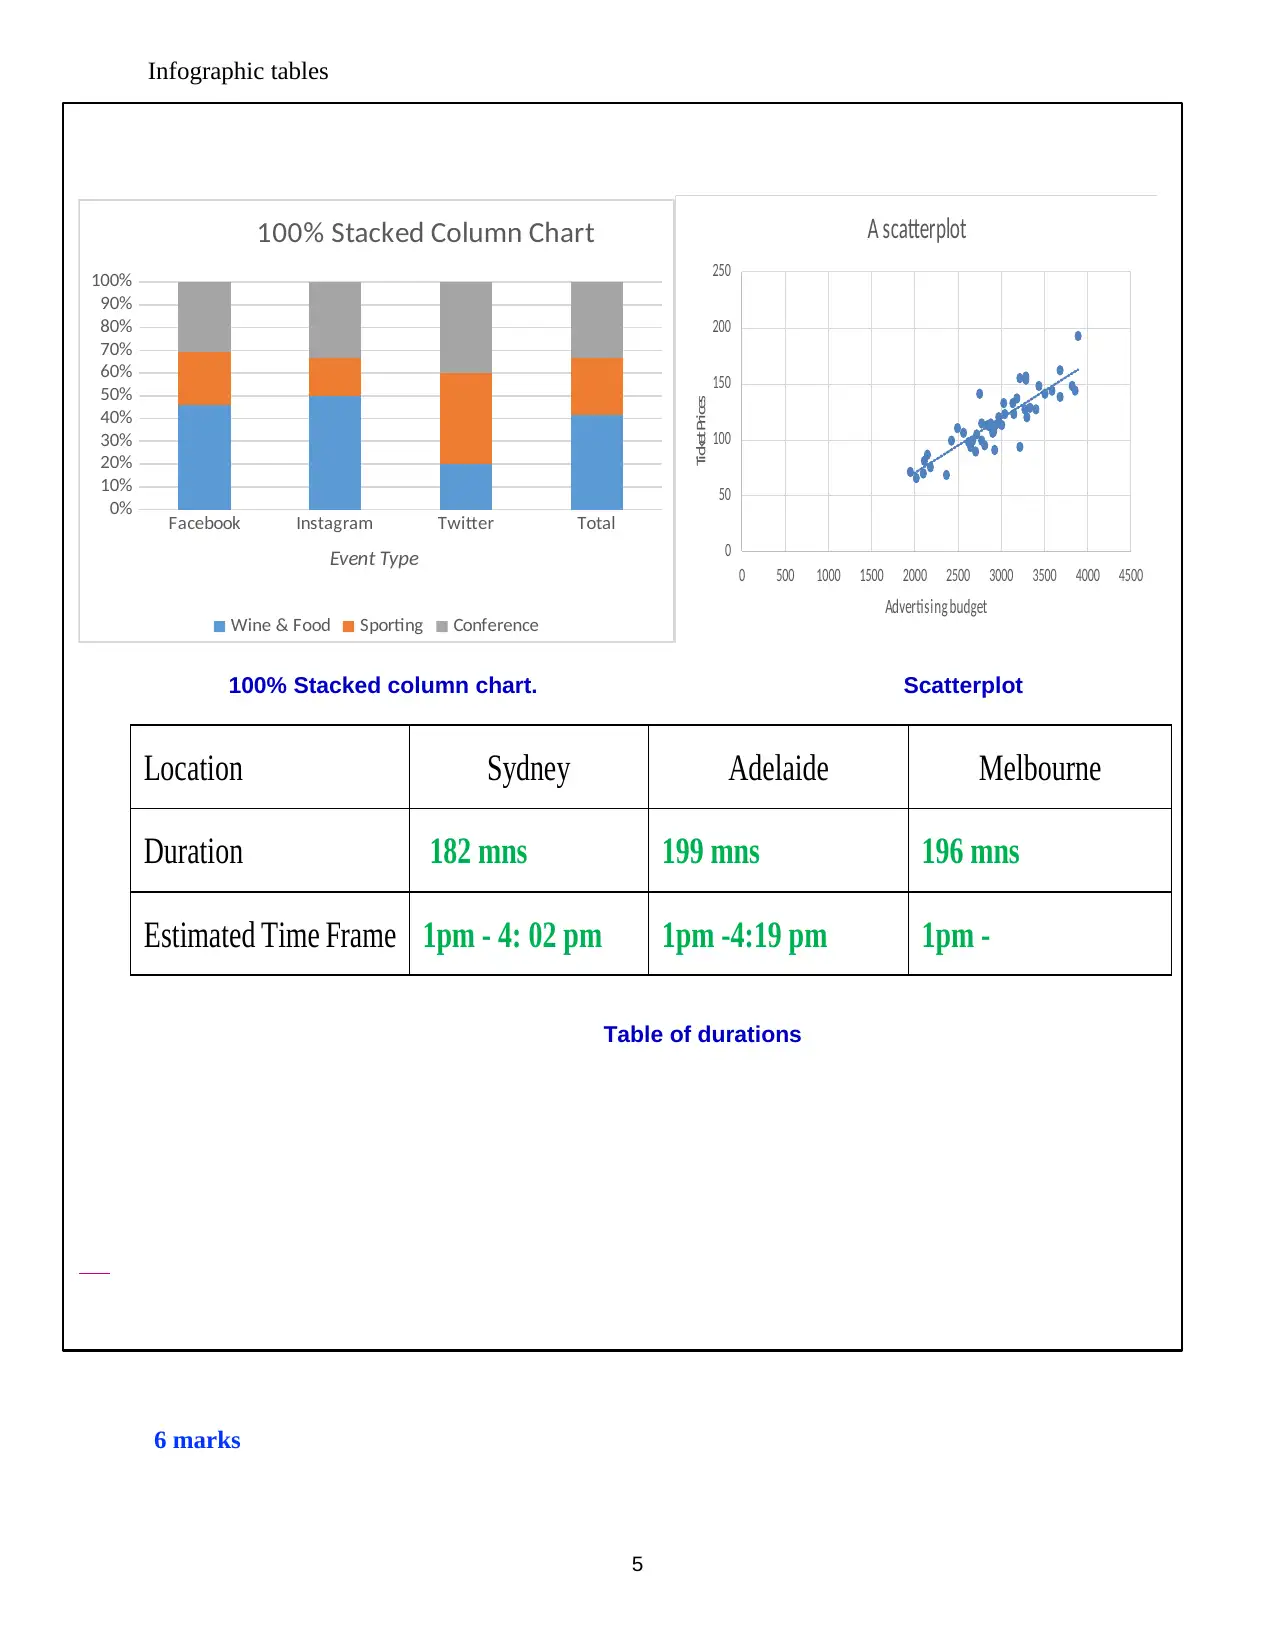
Infographic tables
6 marks
Facebook Instagram Twitter Total
0%
10%
20%
30%
40%
50%
60%
70%
80%
90%
100%
100% Stacked Column Chart
Wine & Food Sporting Conference
Event Type 0
50
100
150
200
250
0 500 1000 1500 2000 2500 3000 3500 4000 4500
TicketPrices
Advertising budget
A scatterplot
100% Stacked column chart. Scatterplot
Location Sydney Adelaide Melbourne
Duration 182 mns 199 mns 196 mns
Estimated Time Frame 1pm - 4: 02 pm 1pm -4:19 pm 1pm -
Table of durations
5
Body
Minimising cost of operation
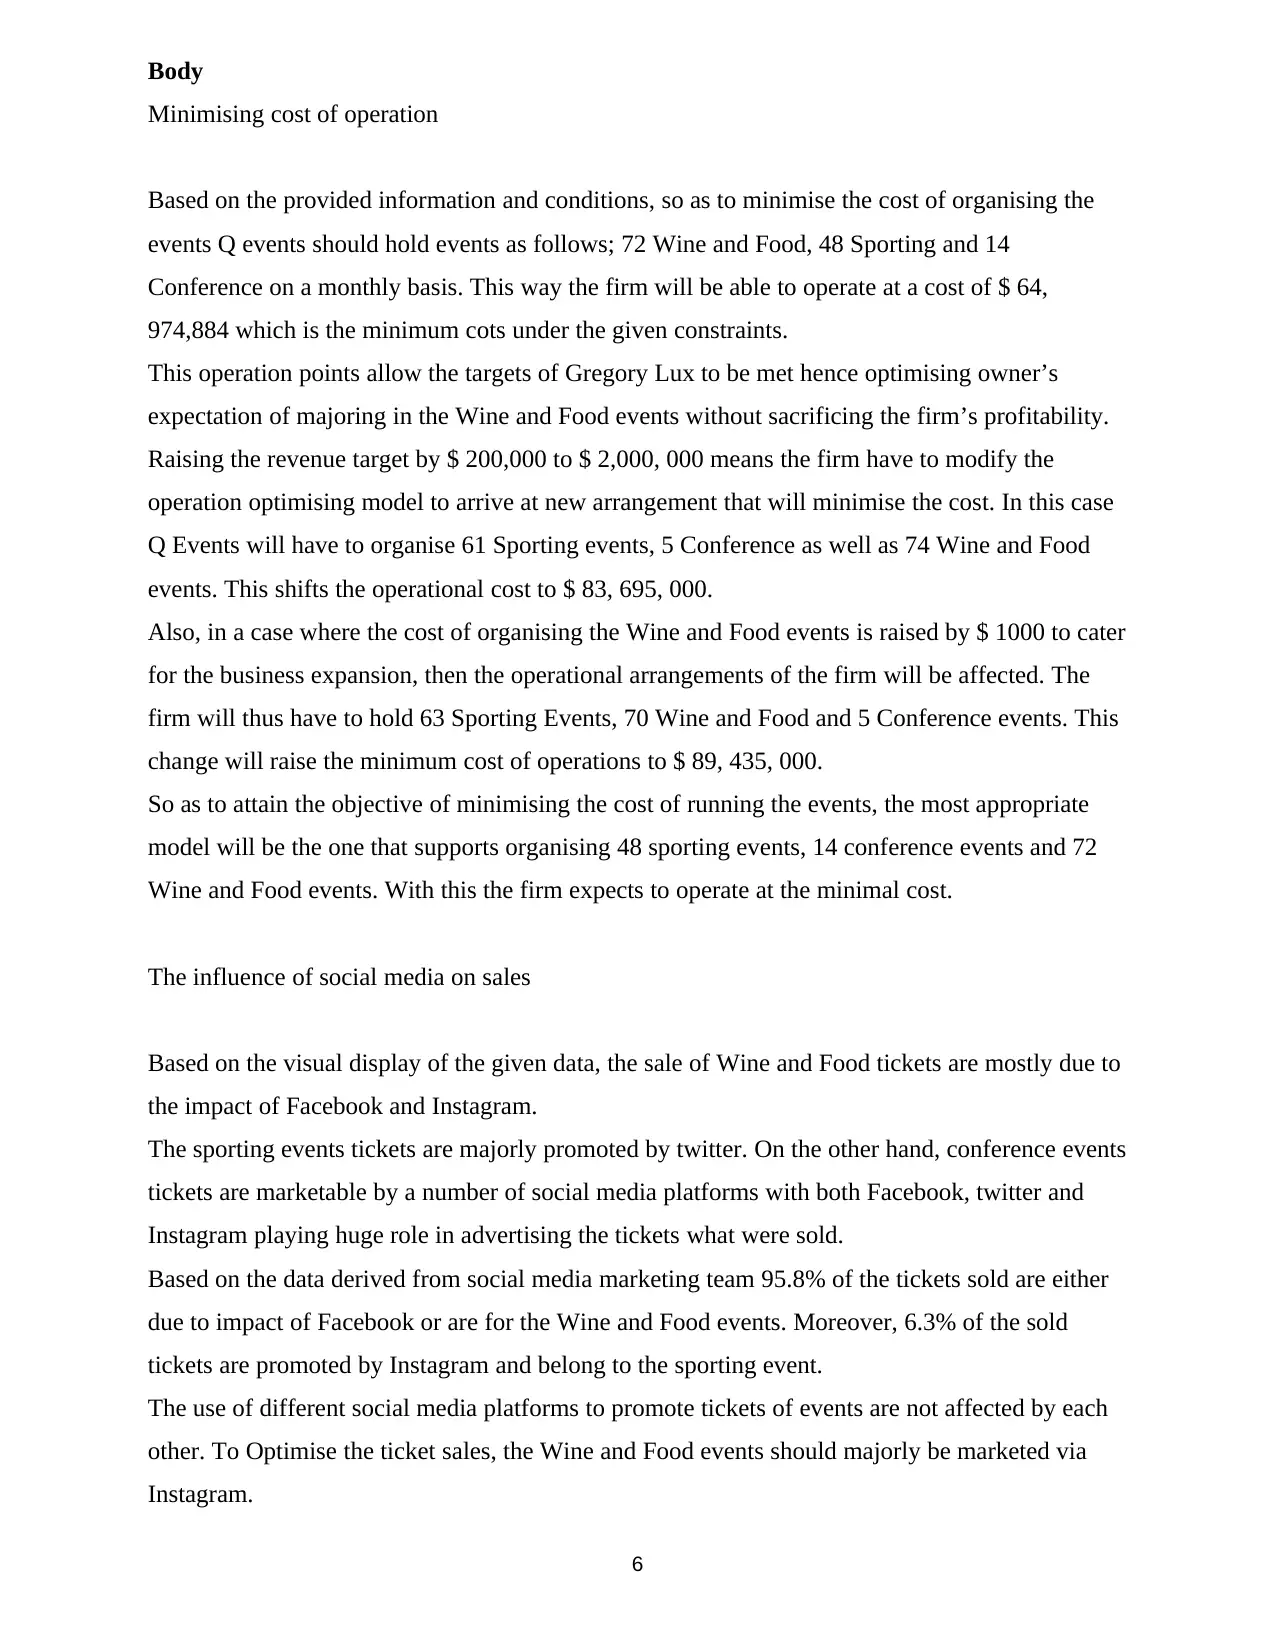
Based on the provided information and conditions, so as to minimise the cost of organising the
events Q events should hold events as follows; 72 Wine and Food, 48 Sporting and 14
Conference on a monthly basis. This way the firm will be able to operate at a cost of $ 64,
974,884 which is the minimum cots under the given constraints.
This operation points allow the targets of Gregory Lux to be met hence optimising owner’s
expectation of majoring in the Wine and Food events without sacrificing the firm’s profitability.
Raising the revenue target by $ 200,000 to $ 2,000, 000 means the firm have to modify the
operation optimising model to arrive at new arrangement that will minimise the cost. In this case
Q Events will have to organise 61 Sporting events, 5 Conference as well as 74 Wine and Food
events. This shifts the operational cost to $ 83, 695, 000.
Also, in a case where the cost of organising the Wine and Food events is raised by $ 1000 to cater
for the business expansion, then the operational arrangements of the firm will be affected. The
firm will thus have to hold 63 Sporting Events, 70 Wine and Food and 5 Conference events. This
change will raise the minimum cost of operations to $ 89, 435, 000.
So as to attain the objective of minimising the cost of running the events, the most appropriate
model will be the one that supports organising 48 sporting events, 14 conference events and 72
Wine and Food events. With this the firm expects to operate at the minimal cost.
The influence of social media on sales
Based on the visual display of the given data, the sale of Wine and Food tickets are mostly due to
the impact of Facebook and Instagram.
The sporting events tickets are majorly promoted by twitter. On the other hand, conference events
tickets are marketable by a number of social media platforms with both Facebook, twitter and
Instagram playing huge role in advertising the tickets what were sold.
Based on the data derived from social media marketing team 95.8% of the tickets sold are either
due to impact of Facebook or are for the Wine and Food events. Moreover, 6.3% of the sold
tickets are promoted by Instagram and belong to the sporting event.
The use of different social media platforms to promote tickets of events are not affected by each
other. To Optimise the ticket sales, the Wine and Food events should majorly be marketed via
Instagram.
6
Minimising cost of operation
Based on the provided information and conditions, so as to minimise the cost of organising the
events Q events should hold events as follows; 72 Wine and Food, 48 Sporting and 14
Conference on a monthly basis. This way the firm will be able to operate at a cost of $ 64,
974,884 which is the minimum cots under the given constraints.
This operation points allow the targets of Gregory Lux to be met hence optimising owner’s
expectation of majoring in the Wine and Food events without sacrificing the firm’s profitability.
Raising the revenue target by $ 200,000 to $ 2,000, 000 means the firm have to modify the
operation optimising model to arrive at new arrangement that will minimise the cost. In this case
Q Events will have to organise 61 Sporting events, 5 Conference as well as 74 Wine and Food
events. This shifts the operational cost to $ 83, 695, 000.
Also, in a case where the cost of organising the Wine and Food events is raised by $ 1000 to cater
for the business expansion, then the operational arrangements of the firm will be affected. The
firm will thus have to hold 63 Sporting Events, 70 Wine and Food and 5 Conference events. This
change will raise the minimum cost of operations to $ 89, 435, 000.
So as to attain the objective of minimising the cost of running the events, the most appropriate
model will be the one that supports organising 48 sporting events, 14 conference events and 72
Wine and Food events. With this the firm expects to operate at the minimal cost.
The influence of social media on sales
Based on the visual display of the given data, the sale of Wine and Food tickets are mostly due to
the impact of Facebook and Instagram.
The sporting events tickets are majorly promoted by twitter. On the other hand, conference events
tickets are marketable by a number of social media platforms with both Facebook, twitter and
Instagram playing huge role in advertising the tickets what were sold.
Based on the data derived from social media marketing team 95.8% of the tickets sold are either
due to impact of Facebook or are for the Wine and Food events. Moreover, 6.3% of the sold
tickets are promoted by Instagram and belong to the sporting event.
The use of different social media platforms to promote tickets of events are not affected by each
other. To Optimise the ticket sales, the Wine and Food events should majorly be marketed via
Instagram.
6
⊘ This is a preview!⊘
Do you want full access?
Subscribe today to unlock all pages.
Trusted by 1+ million students worldwide
Modelling events running period
The period needed to run events in each of the cities of Sydney, Adelaide and Melbourne do
differ with 182 minutes needed in Sydney, 199 in Adelaide while 196 minutes is consumed to
conduct an event in Melbourne. On a number of occasions, the vinothon events do take longer
than usual. This is due to the number of times listed in the data that are not within the normally
expected values.
From the computed tabular values, the recommended duration that needs to be taken at Vinothon
in either city include; 182 minutes for Sydney, 199 minutes for Adelaide and 196 minutes for
Melbourne.
Modelling ticket prices
From the information displayed in the infographics, there appears to be a positive relationship
between the advertising budget values and the ticket prices. This indicates that in a case where
the advertising budget rises, then will expect the ticket price to go up as well. When the
advertising budget value changes by a single unit the ticket price will be affected by a 0.0489
change in the values. The statistical computations of the data prove that advertising budget is
responsible for 75.69% of the alterations taking place in the ticket prices.
Using the developed model, the firm can be able to use the advertising budget to forecast the
expected prices of tickets, for example at a budget of $ 3000 the ticket price should be $ 117.43
also at a budget of $ 5000, the ticket price is expected to be $ 217.27.
In a situation where the price of the budget is 0 it seems we will have a negative ticket price. This
kind of situation is not realistic as it is not possible for a firm to charge negative prices for their
services. This therefore casts doubt over the accuracy of the model and the ability of the firm to
generate dependable information from it.
7
Paraphrase This Document
Need a fresh take? Get an instant paraphrase of this document with our AI Paraphraser
Conclusions and Recommendation
Based on the analysis of the past data from the activities of Q Events, it is advisable that Gregory
organise 48 Sporting Events, 14 Conference events as well as 72 Wine and Food events. By
implementing this the firm will be able to cut down the operation cost and operate at an optimum
point. Increasing the target revenue constraint by $ 200,000, the operation cost also raises hence
the move may not result in increased profitability.
Social media have an impact on the sales of the company products. For this reason, the firm
needs to be observant of the activities g=0ing on social media. From the past information trend,
Win and Food events need to be promoted majorly in the Facebook platform while sporting
events promoted via twitter. The conference events enjoy support across all the social media
platforms hence can be promoted in any.
Ticket prices assist the firm forecast on the expected revenue and hence allow for planning of
operations. To effectively forecast on the future prices, the firm should use the sales budget data.
Up to 75% of fluctuations in the ticket prices are due to the changes in the advertising budget.
8
Appendix 1 – Optimising operation costs
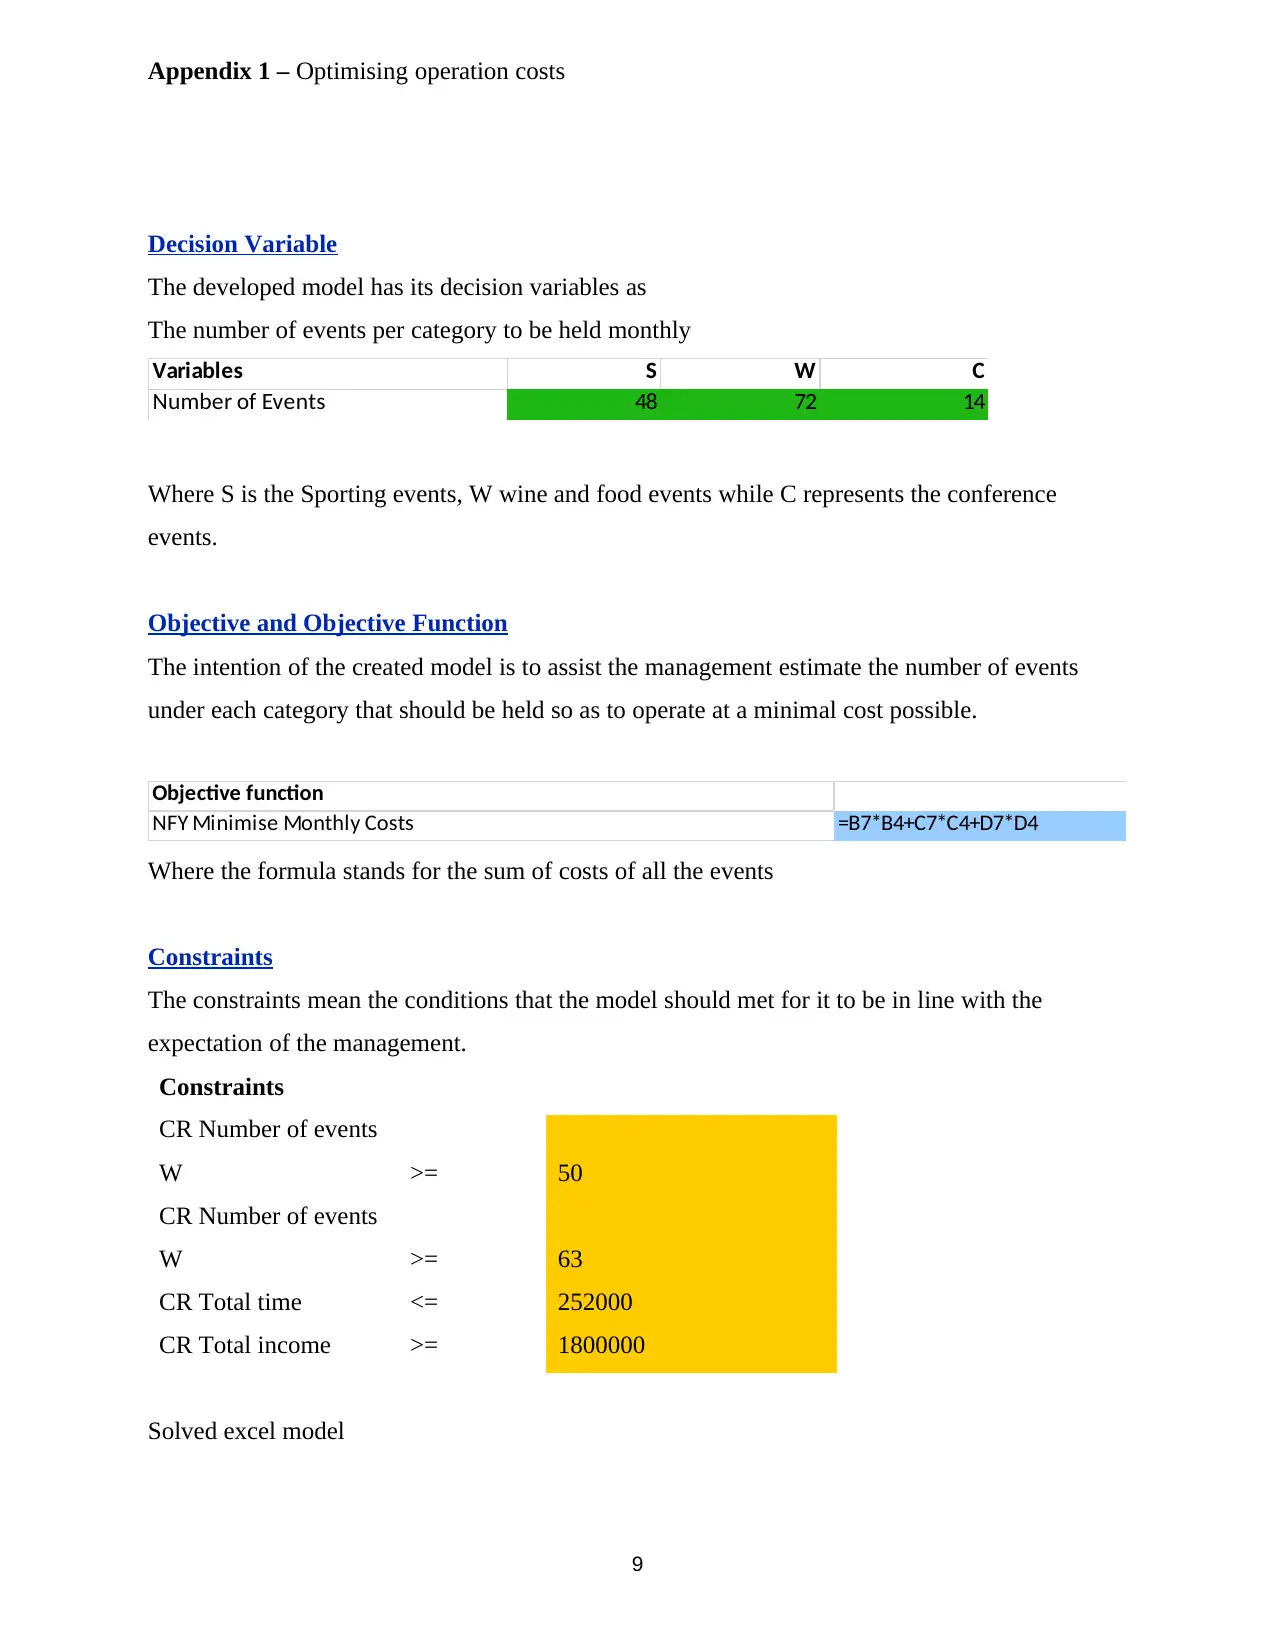
Decision Variable
The developed model has its decision variables as
The number of events per category to be held monthly
Variables S W C
Number of Events 48 72 14
Where S is the Sporting events, W wine and food events while C represents the conference
events.
Objective and Objective Function
The intention of the created model is to assist the management estimate the number of events
under each category that should be held so as to operate at a minimal cost possible.
Objective function
NFY Minimise Monthly Costs =B7*B4+C7*C4+D7*D4
Where the formula stands for the sum of costs of all the events
Constraints
The constraints mean the conditions that the model should met for it to be in line with the
expectation of the management.
Constraints
CR Number of events
W >= 50
CR Number of events
W >= 63
CR Total time <= 252000
CR Total income >= 1800000
Solved excel model
9
⊘ This is a preview!⊘
Do you want full access?
Subscribe today to unlock all pages.
Trusted by 1+ million students worldwide
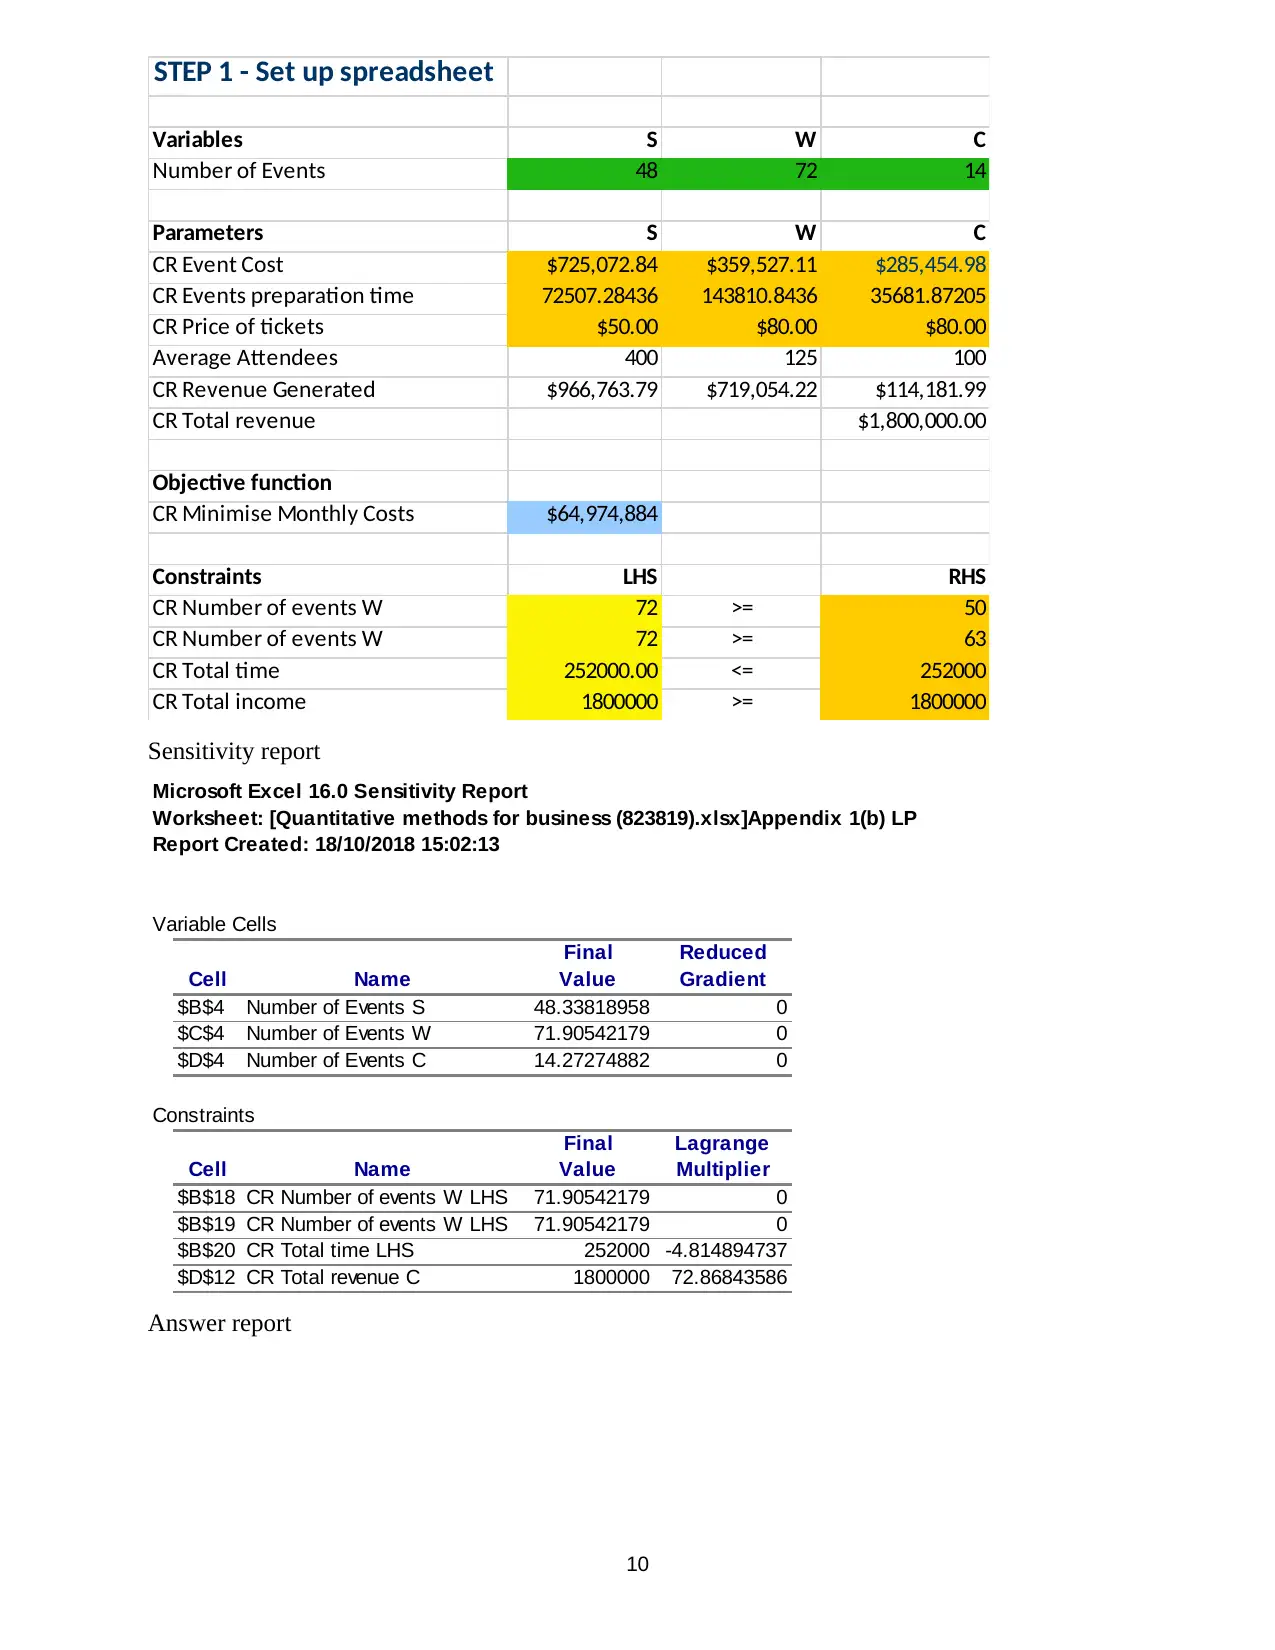
STEP 1 - Set up spreadsheet
Variables S W C
Number of Events 48 72 14
Parameters S W C
CR Event Cost $725,072.84 $359,527.11 $285,454.98
CR Events preparation time 72507.28436 143810.8436 35681.87205
CR Price of tickets $50.00 $80.00 $80.00
Average Attendees 400 125 100
CR Revenue Generated $966,763.79 $719,054.22 $114,181.99
CR Total revenue $1,800,000.00
Objective function
CR Minimise Monthly Costs $64,974,884
Constraints LHS RHS
CR Number of events W 72 >= 50
CR Number of events W 72 >= 63
CR Total time 252000.00 <= 252000
CR Total income 1800000 >= 1800000
Sensitivity report
Microsoft Excel 16.0 Sensitivity Report
Worksheet: [Quantitative methods for business (823819).xlsx]Appendix 1(b) LP
Report Created: 18/10/2018 15:02:13
Variable Cells
Final Reduced
Cell Name Value Gradient
$B$4 Number of Events S 48.33818958 0
$C$4 Number of Events W 71.90542179 0
$D$4 Number of Events C 14.27274882 0
Constraints
Final Lagrange
Cell Name Value Multiplier
$B$18 CR Number of events W LHS 71.90542179 0
$B$19 CR Number of events W LHS 71.90542179 0
$B$20 CR Total time LHS 252000 -4.814894737
$D$12 CR Total revenue C 1800000 72.86843586
Answer report
10
Paraphrase This Document
Need a fresh take? Get an instant paraphrase of this document with our AI Paraphraser
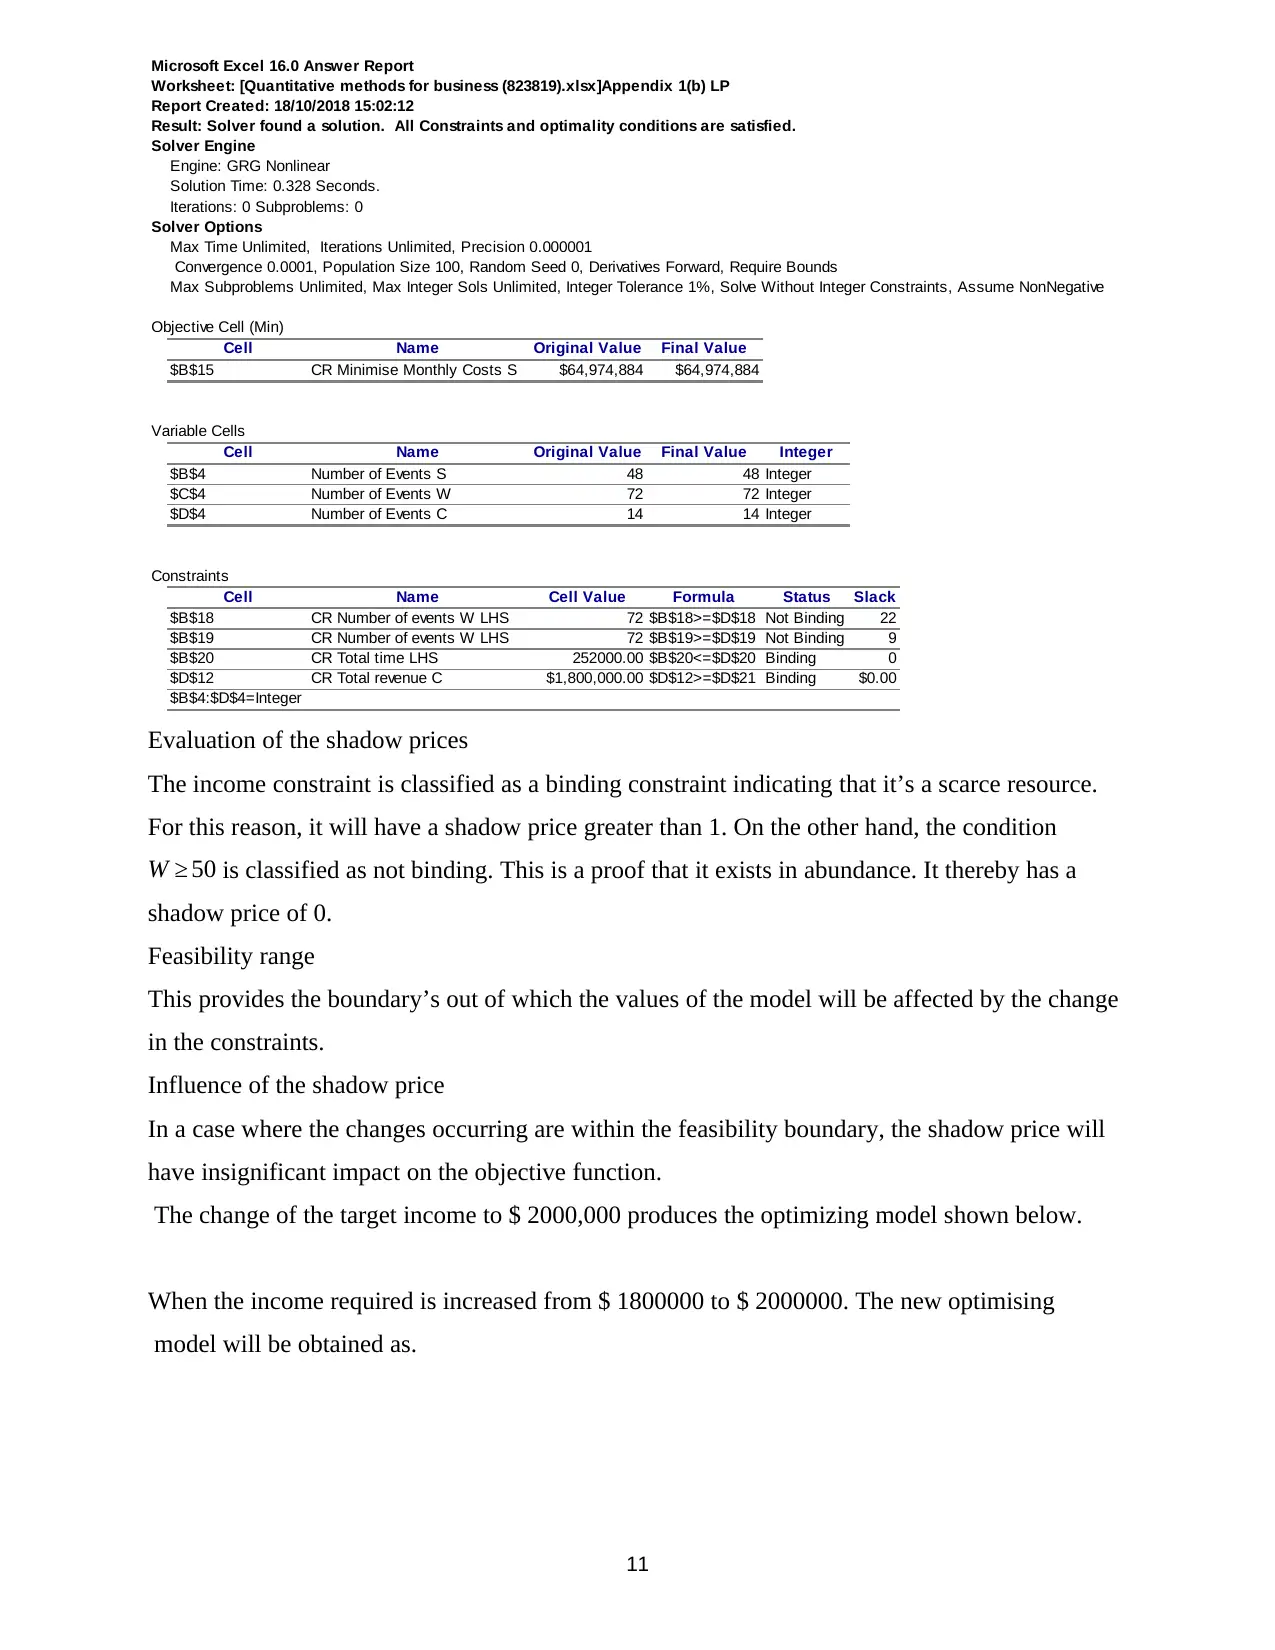
Microsoft Excel 16.0 Answer Report
Worksheet: [Quantitative methods for business (823819).xlsx]Appendix 1(b) LP
Report Created: 18/10/2018 15:02:12
Result: Solver found a solution. All Constraints and optimality conditions are satisfied.
Solver Engine
Engine: GRG Nonlinear
Solution Time: 0.328 Seconds.
Iterations: 0 Subproblems: 0
Solver Options
Max Time Unlimited, Iterations Unlimited, Precision 0.000001
Convergence 0.0001, Population Size 100, Random Seed 0, Derivatives Forward, Require Bounds
Max Subproblems Unlimited, Max Integer Sols Unlimited, Integer Tolerance 1%, Solve Without Integer Constraints, Assume NonNegative
Objective Cell (Min)
Cell Name Original Value Final Value
$B$15 CR Minimise Monthly Costs S $64,974,884 $64,974,884
Variable Cells
Cell Name Original Value Final Value Integer
$B$4 Number of Events S 48 48 Integer
$C$4 Number of Events W 72 72 Integer
$D$4 Number of Events C 14 14 Integer
Constraints
Cell Name Cell Value Formula Status Slack
$B$18 CR Number of events W LHS 72 $B$18>=$D$18 Not Binding 22
$B$19 CR Number of events W LHS 72 $B$19>=$D$19 Not Binding 9
$B$20 CR Total time LHS 252000.00 $B$20<=$D$20 Binding 0
$D$12 CR Total revenue C $1,800,000.00 $D$12>=$D$21 Binding $0.00
$B$4:$D$4=Integer
Evaluation of the shadow prices
The income constraint is classified as a binding constraint indicating that it’s a scarce resource.
For this reason, it will have a shadow price greater than 1. On the other hand, the condition
W ≥ 50 is classified as not binding. This is a proof that it exists in abundance. It thereby has a
shadow price of 0.
Feasibility range
This provides the boundary’s out of which the values of the model will be affected by the change
in the constraints.
Influence of the shadow price
In a case where the changes occurring are within the feasibility boundary, the shadow price will
have insignificant impact on the objective function.
The change of the target income to $ 2000,000 produces the optimizing model shown below.
When the income required is increased from $ 1800000 to $ 2000000. The new optimising
model will be obtained as.
11
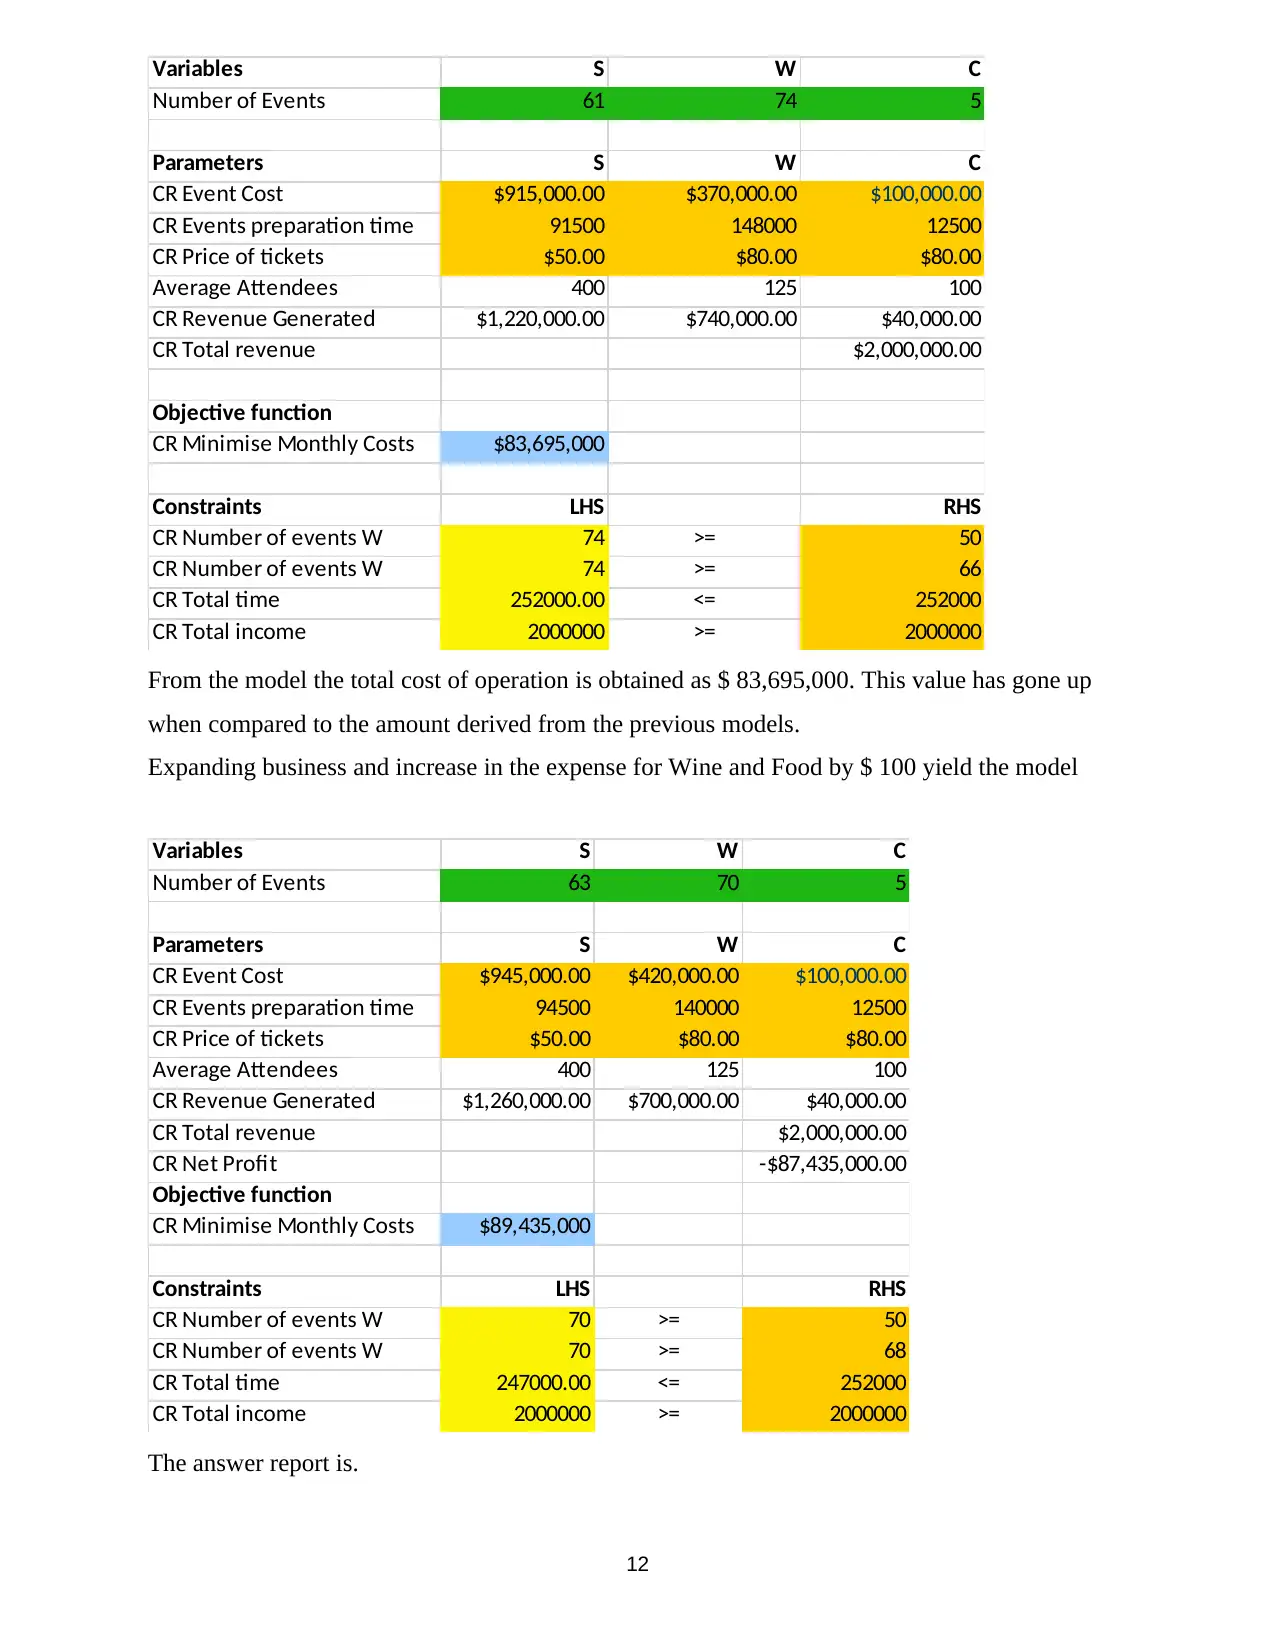
Variables S W C
Number of Events 61 74 5
Parameters S W C
CR Event Cost $915,000.00 $370,000.00 $100,000.00
CR Events preparation time 91500 148000 12500
CR Price of tickets $50.00 $80.00 $80.00
Average Attendees 400 125 100
CR Revenue Generated $1,220,000.00 $740,000.00 $40,000.00
CR Total revenue $2,000,000.00
Objective function
CR Minimise Monthly Costs $83,695,000
Constraints LHS RHS
CR Number of events W 74 >= 50
CR Number of events W 74 >= 66
CR Total time 252000.00 <= 252000
CR Total income 2000000 >= 2000000
From the model the total cost of operation is obtained as $ 83,695,000. This value has gone up
when compared to the amount derived from the previous models.
Expanding business and increase in the expense for Wine and Food by $ 100 yield the model
Variables S W C
Number of Events 63 70 5
Parameters S W C
CR Event Cost $945,000.00 $420,000.00 $100,000.00
CR Events preparation time 94500 140000 12500
CR Price of tickets $50.00 $80.00 $80.00
Average Attendees 400 125 100
CR Revenue Generated $1,260,000.00 $700,000.00 $40,000.00
CR Total revenue $2,000,000.00
CR Net Profit -$87,435,000.00
Objective function
CR Minimise Monthly Costs $89,435,000
Constraints LHS RHS
CR Number of events W 70 >= 50
CR Number of events W 70 >= 68
CR Total time 247000.00 <= 252000
CR Total income 2000000 >= 2000000
The answer report is.
12
⊘ This is a preview!⊘
Do you want full access?
Subscribe today to unlock all pages.
Trusted by 1+ million students worldwide
1 out of 17
Related Documents


Your All-in-One AI-Powered Toolkit for Academic Success.
+13062052269
info@desklib.com
Available 24*7 on WhatsApp / Email
![[object Object]](/_next/static/media/star-bottom.7253800d.svg)
Unlock your academic potential
Copyright © 2020–2026 A2Z Services. All Rights Reserved. Developed and managed by ZUCOL.