QAB105 Quantitative Analysis for Business Project - Semester 2, 2018

Verified

Added on  2023/06/04

|8
|881
|261
Project
AI Summary
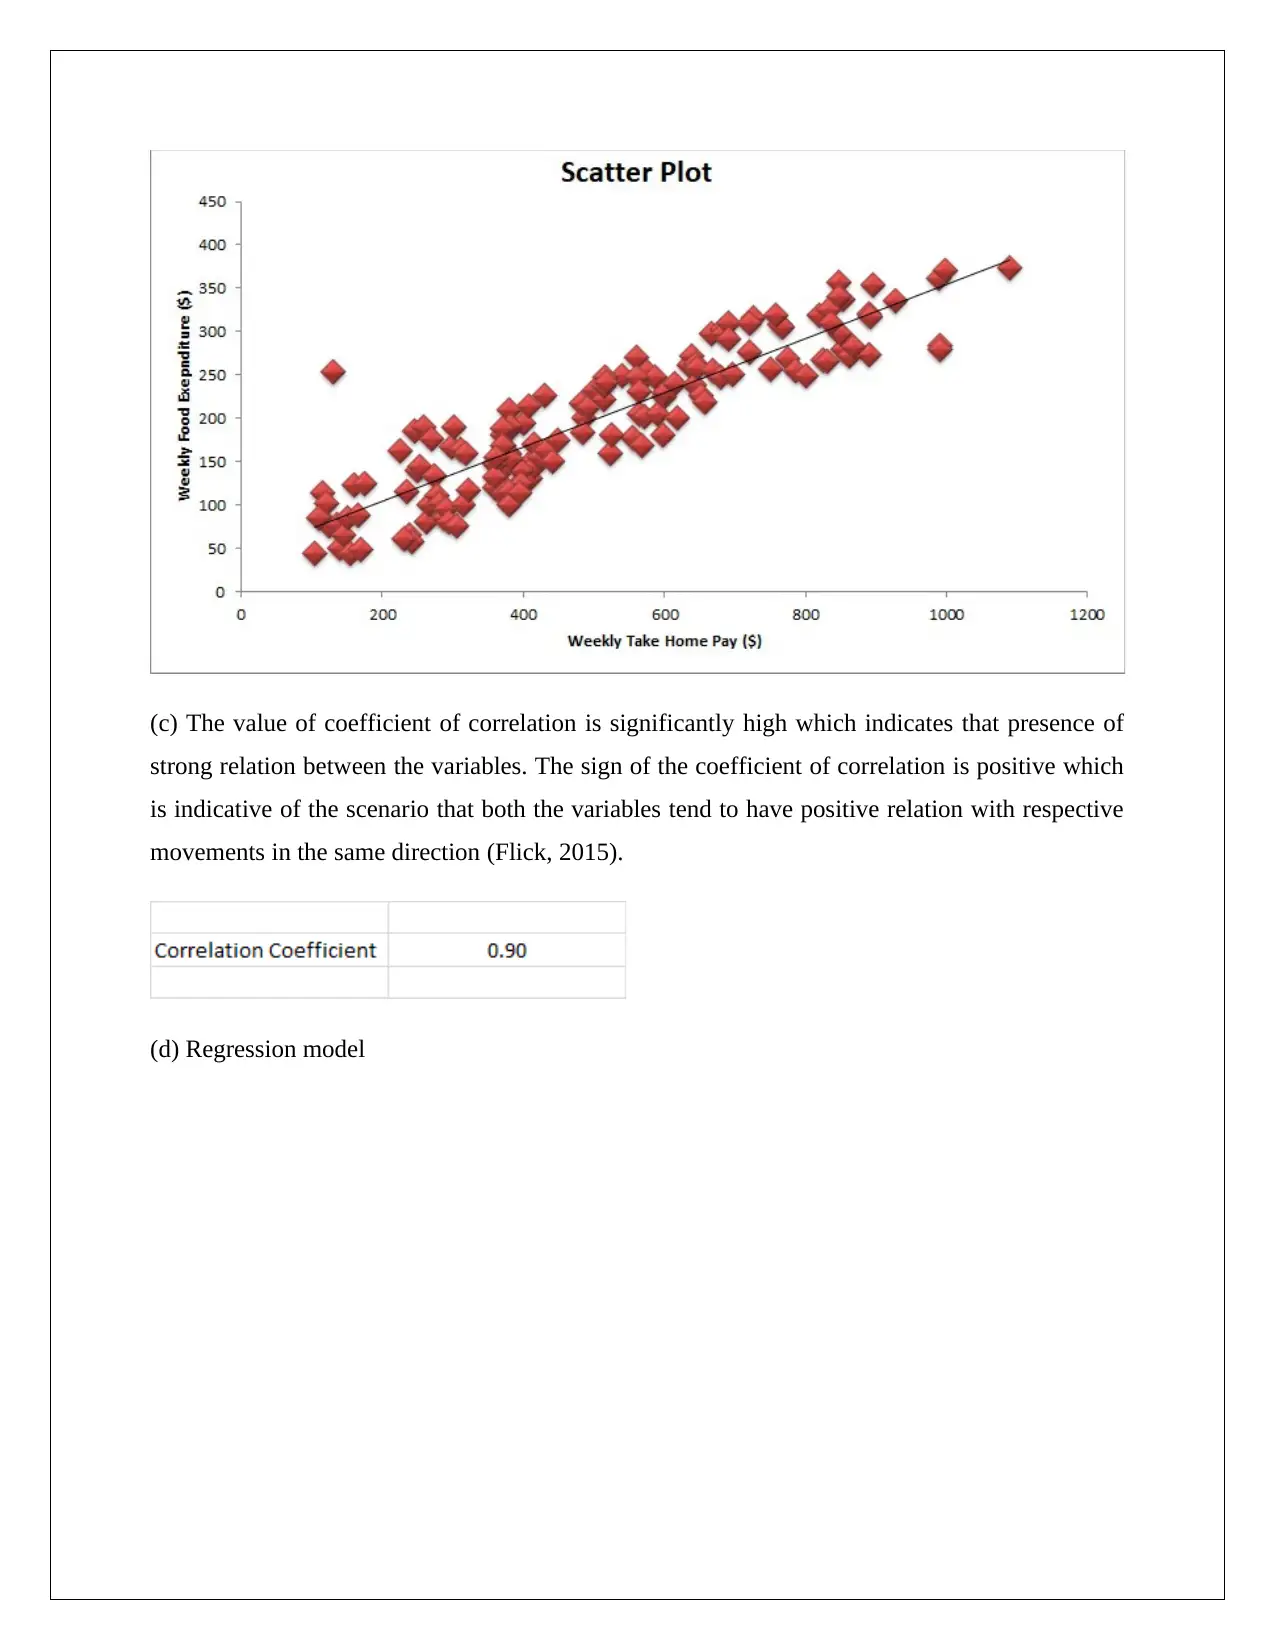
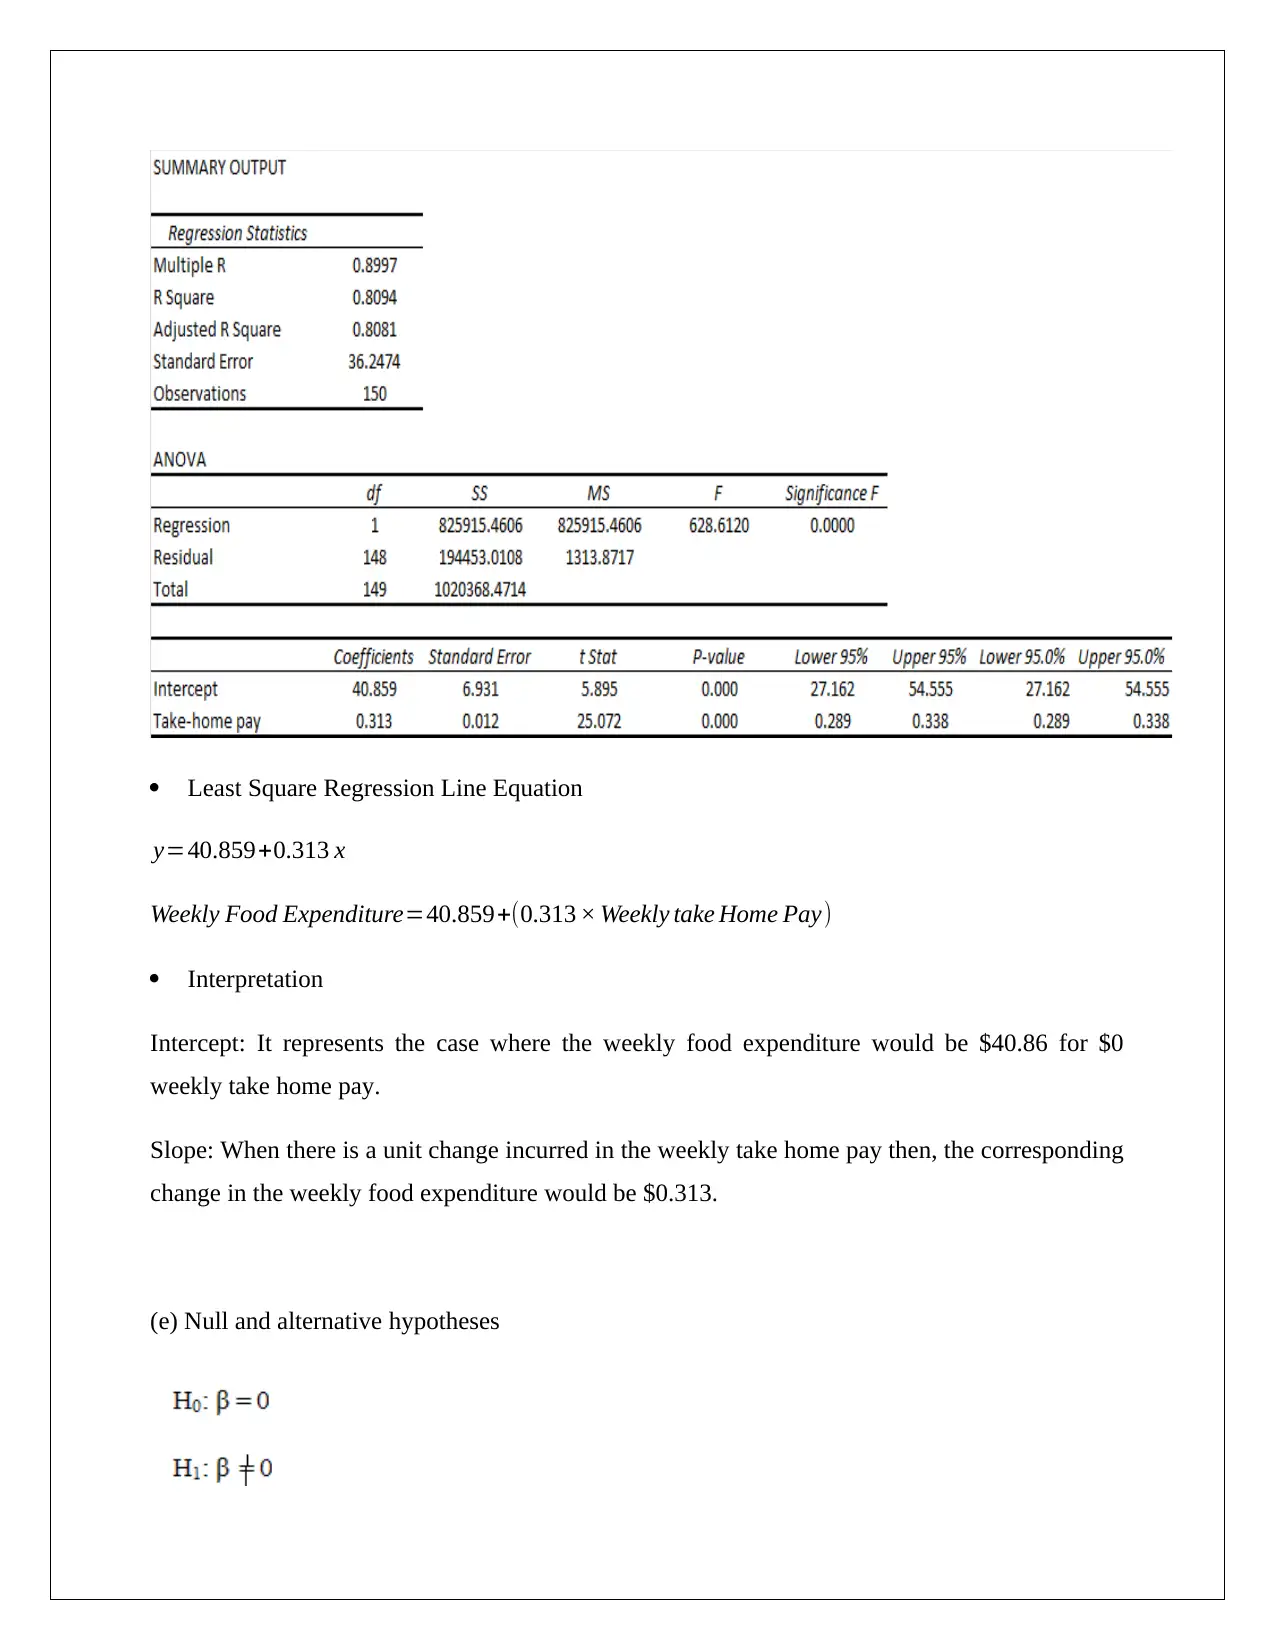
This project solution demonstrates quantitative analysis techniques applied to business data. It covers data collection methods, sampling techniques, and potential issues in data collection. The analysis includes histogram interpretation, numerical summaries, and skewness identification. Furthermore, it explores regression analysis, correlation, and hypothesis testing to determine the relationship between weekly take-home pay and weekly food expenditure. The project concludes that the variables do not exhibit a normal distribution due to positive skew and that there is a statistically significant positive relationship between the two variables. Desklib offers a wide array of such solved assignments and past papers to aid students in their studies.
tabler-icon-diamond-filled.svg

Contribute Materials

Your contribution can guide someone’s learning journey. Share your documents today.
Document Page
QUANTITATIVE ANALYSIS FOR BUSINESS
STUDENT NAME/ID
[Pick the date]
tabler-icon-diamond-filled.svg

Secure Best Marks with AI Grader

Need help grading? Try our AI Grader for instant feedback on your assignments.
Document Page
PART 1
(a) Data collection by using online survey platform would be an appropriate procedure because
the research questions are factual which would easily be answered through online surveying.
Further, collecting responses from this surveying will be time as well as cost saving
especially considering the wide reach required (Hillier, 2016).
(b) The stratified random sampling should be used to draw the sample from the large population.
The sample from this sampling would acquire all the respective attributes of the population
and thus, the result from this population would be true representative of the population
(Lieberman et.al., 2015).
(c) The primary issue with the collection of data would be in the form of non-responses from the
sample population. This could result in mismatch of the attributes of the sample and the
population of interest. Further, there could be also be incomplete responses coupled with
false information (Flick, 2015).
PART 2
(a) The researcher has selected class intervals considering the range of the data along with the
underlying distribution of the data so as to ensure that the data is not concentrated within a
given class only. Typically, higher is the range of data, higher would be the number of class
intervals. Also, the class sizes ought to be limited in size so that all the observations are not
recorded in some classes only (Hair et. al., 2015).
(b) Histograms
Document Page
(c) Numerical summary
Document Page
(d) It can be observed from the histograms that for both the cases rightward tail is longer than the
leftward tail which indicates that positive skew is present for the variables. The positive skew is
also witnessed from the above shown numerical summary as the mean is more than median
value. This evidence points towards the non-normal distribution of the variables (Hillier, 2016).
PART 3
(a) Weekly take home pay (x) = Independent variable
Weekly food expenditure (y) =Dependent variable
The above understanding has been formed based on the fact that expenditure is a function of the
take home pay. An individual would make food related expenditure based on his/her take home
pay.
(b) Scatter plot
tabler-icon-diamond-filled.svg

Secure Best Marks with AI Grader

Need help grading? Try our AI Grader for instant feedback on your assignments.
Document Page
(c) The value of coefficient of correlation is significantly high which indicates that presence of
strong relation between the variables. The sign of the coefficient of correlation is positive which
is indicative of the scenario that both the variables tend to have positive relation with respective
movements in the same direction (Flick, 2015).
(d) Regression model
Document Page
Least Square Regression Line Equation
y=40.859+0.313 x
Weekly Food Expenditure=40.859+(0.313 × Weekly take Home Pay)
Interpretation
Intercept: It represents the case where the weekly food expenditure would be $40.86 for $0
weekly take home pay.
Slope: When there is a unit change incurred in the weekly take home pay then, the corresponding
change in the weekly food expenditure would be $0.313.
(e) Null and alternative hypotheses
Document Page
The significance F (p value) from the ANOVA table can be found as 0.00.
Let the significance level = 5%
Observation: The p value < significance level
Result: Sufficient evidence to reject null hypothesis. As a result, accept alternative hypothesis
(Hair et. al., 2015).
Conclusion: Slope is significant and thus, regression model is said to be statistical significant.
PART 4
In line with the analysis conducted in part 2, it is apparent that the given variables of interest do
not tend to exhibit a normal distribution. This is confirmed by the presence of positive skew
which implies presence of certain individuals that tend to have very high values of take home
salary and corresponding home expenditure. Also, with the use of regression and correlation
analysis, it can be estimated that there is a strong relationship between the food expenditure and
the take home pay. Further, the underlying relationship between the two is positive with about
31% of the weekly pay being spent on food.
tabler-icon-diamond-filled.svg

Paraphrase This Document

Need a fresh take? Get an instant paraphrase of this document with our AI Paraphraser
Document Page
References
Flick, U. (2015) Introducing research methodology: A beginner's guide to doing a research
project. 4th ed. New York: Sage Publications.
Hair, J. F., Wolfinbarger, M., Money, A. H., Samouel, P., and Page, M. J. (2015) Essentials of
business research methods. 2nd ed. New York: Routledge.
Hillier, F. (2016) Introduction to Operations Research. 6th ed. New York: McGraw Hill
Publications.
Lieberman, F. J., Nag, B., Hiller, F.S. and Basu, P. (2013) Introduction To Operations Research.
5th ed. New Delhi: Tata McGraw Hill Publishers.
chevron_up_icon
1 out of 8
circle_padding
hide_on_mobile
zoom_out_icon
logo.png

Your All-in-One AI-Powered Toolkit for Academic Success.

Available 24*7 on WhatsApp / Email

[object Object]