Comprehensive Financial Analysis of Qantas Airways Limited
VerifiedAdded on 2021/06/15
|18
|2953
|59
Report
AI Summary
This report presents a comprehensive financial analysis of Qantas Airways Limited. It begins with an overview of the company, including its subsidiary businesses, financial highlights, and key competitors. The report delves into Qantas's financial structure, examining its sources of funds, including equity and long-term debt, and evaluates its financial performance based on the 2017 annual report, highlighting key metrics such as PBT, revenue, and operating expenses. It also discusses changes in accounting policies, new accounting standards, and provides detailed information on the carrying amounts of plant, equipment, and property, as well as intangible assets. The analysis covers accounting policies for property, plant, and equipment, and intangible assets, including impairment assessments. The report concludes with a summary of the key findings and insights into Qantas's financial position.
Qantas Airways Limited
Paraphrase This Document
Need a fresh take? Get an instant paraphrase of this document with our AI Paraphraser
COPORATE ACCOUNTING 1
Contents
First Part................................................................................................................................................2
Company overview............................................................................................................................2
Subsidiary business of Qantas...........................................................................................................2
Financial Highlight............................................................................................................................3
Competitors of Qantas.......................................................................................................................3
Source of Funds.................................................................................................................................4
Financial structure of Qantas Airlines Limited..................................................................................4
Financial Performance.......................................................................................................................5
Changes in Accounting Policies........................................................................................................8
New Accounting Standards and Interpretation..................................................................................8
Second Part............................................................................................................................................8
Carrying Amount of Plant, Equipment and Property.........................................................................8
Accounting Policies for Property Plant and Equipment...................................................................10
Composition of Intangible Assets....................................................................................................10
Accounting policies for Intangible Assets.......................................................................................12
Impairment......................................................................................................................................12
Plant Property and Equipment impairment amount.........................................................................13
Intangible assets impairment amount...............................................................................................14
Conclusion...........................................................................................................................................16
References...........................................................................................................................................17
COPORATE ACCOUNTING 2
First Part
Company overview
Qantas is world’s second largest airline company. It was established in 1920 in
Queensland. The company grows as an Australia’s biggest global and local airline. Qantas
widely known as world’s top most long distance airline. Qantas first fly its passengers in
1935. Qantas built its reputation in global market by focuses on some important factors like
operational reliability, customer service, engineering and safety (Qantas, 2018).
Subsidiary business of Qantas
The core business of Qantas is transporting of airline passengers. In addition to
the core business Qantas operates few subsidiary businesses these are:
1. QantasLink: It is a local airline of the company had 2000 flights which connect
56 local and metropolitan destinations of Australia every week.
2. Q Catering: It is a finest service flight caterer, they operate in five food
production and catering centre.
3. Express Ground Handling: It is a exclusively owned subsidiary of the Company
that provides wide-range ground handling services to Jetstar and to several other
local airlines.
4. Qantas Holidays: It is a unit of Jetset Travel world Group, it is Australia’s top
travel wholesalers. Through Qantas holidays they offer competitive low price
holiday plans and airline booking option to customers. They also sell package for
special events to be held in Australia.
⊘ This is a preview!⊘
Do you want full access?
Subscribe today to unlock all pages.
Trusted by 1+ million students worldwide
COPORATE ACCOUNTING 3
5. Jetstar: Jetstar first started operating in 2004 and grows as a low cost carrier in
Asia Pacific. From 2004 till now Jetstar Group has flown almost 200 million
passengers (Qantas, 2018).
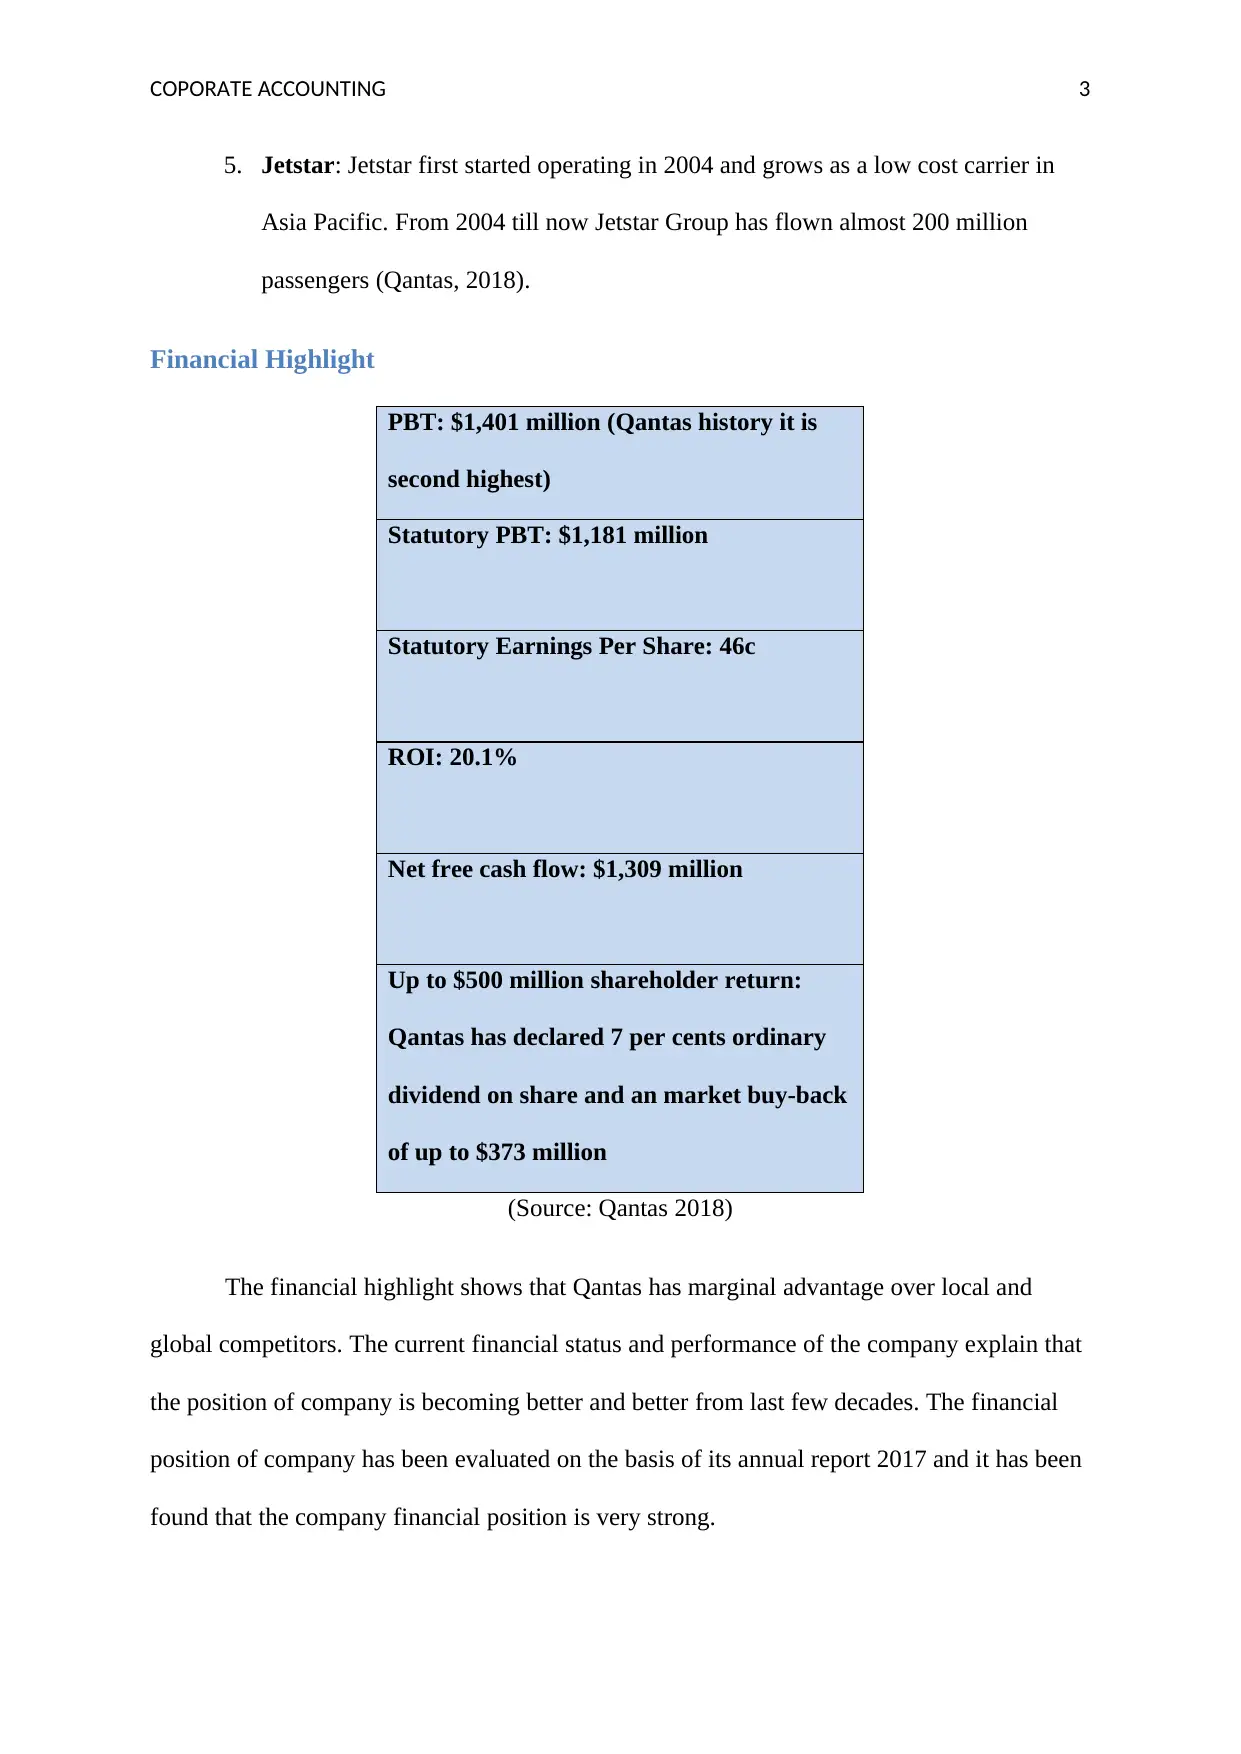
Financial Highlight
PBT: $1,401 million (Qantas history it is
second highest)
Statutory PBT: $1,181 million
Statutory Earnings Per Share: 46c
ROI: 20.1%
Net free cash flow: $1,309 million
Up to $500 million shareholder return:
Qantas has declared 7 per cents ordinary
dividend on share and an market buy-back
of up to $373 million
(Source: Qantas 2018)
The financial highlight shows that Qantas has marginal advantage over local and
global competitors. The current financial status and performance of the company explain that
the position of company is becoming better and better from last few decades. The financial
position of company has been evaluated on the basis of its annual report 2017 and it has been
found that the company financial position is very strong.
5. Jetstar: Jetstar first started operating in 2004 and grows as a low cost carrier in
Asia Pacific. From 2004 till now Jetstar Group has flown almost 200 million
passengers (Qantas, 2018).
Financial Highlight
PBT: $1,401 million (Qantas history it is
second highest)
Statutory PBT: $1,181 million
Statutory Earnings Per Share: 46c
ROI: 20.1%
Net free cash flow: $1,309 million
Up to $500 million shareholder return:
Qantas has declared 7 per cents ordinary
dividend on share and an market buy-back
of up to $373 million
(Source: Qantas 2018)
The financial highlight shows that Qantas has marginal advantage over local and
global competitors. The current financial status and performance of the company explain that
the position of company is becoming better and better from last few decades. The financial
position of company has been evaluated on the basis of its annual report 2017 and it has been
found that the company financial position is very strong.
Paraphrase This Document
Need a fresh take? Get an instant paraphrase of this document with our AI Paraphraser
COPORATE ACCOUNTING 4
Competitors of Qantas
Top 5 Competitors from Aviation industry of Qantas Airways Limited are:
1. Virgin America,
2. Air France,
3. Monarch Airlines,
4. Millican, and
5. EL AL IsRael AirLines Ltd (Datafox, 2018).
Source of Funds
Internal source of finance for Qantas Airline Limited – Retain earning and that
amounted to AUD 472 million.
External source of finance for Qantas Airline Limited-
Short term borrowing- 00
Long term Debts- AUD 3144 million
Total Shareholder’s equity- AUD 3537 million (Qantas Annual Report, 2017)
Financial structure of Qantas Airlines Limited
Total stockholders' equity 3537
Long-term debt 3144
(Source: Annual Report Qantas, 2017).
COPORATE ACCOUNTING 5
53%
47%
Capital Structure
Total stockholders' equity Long-term debt
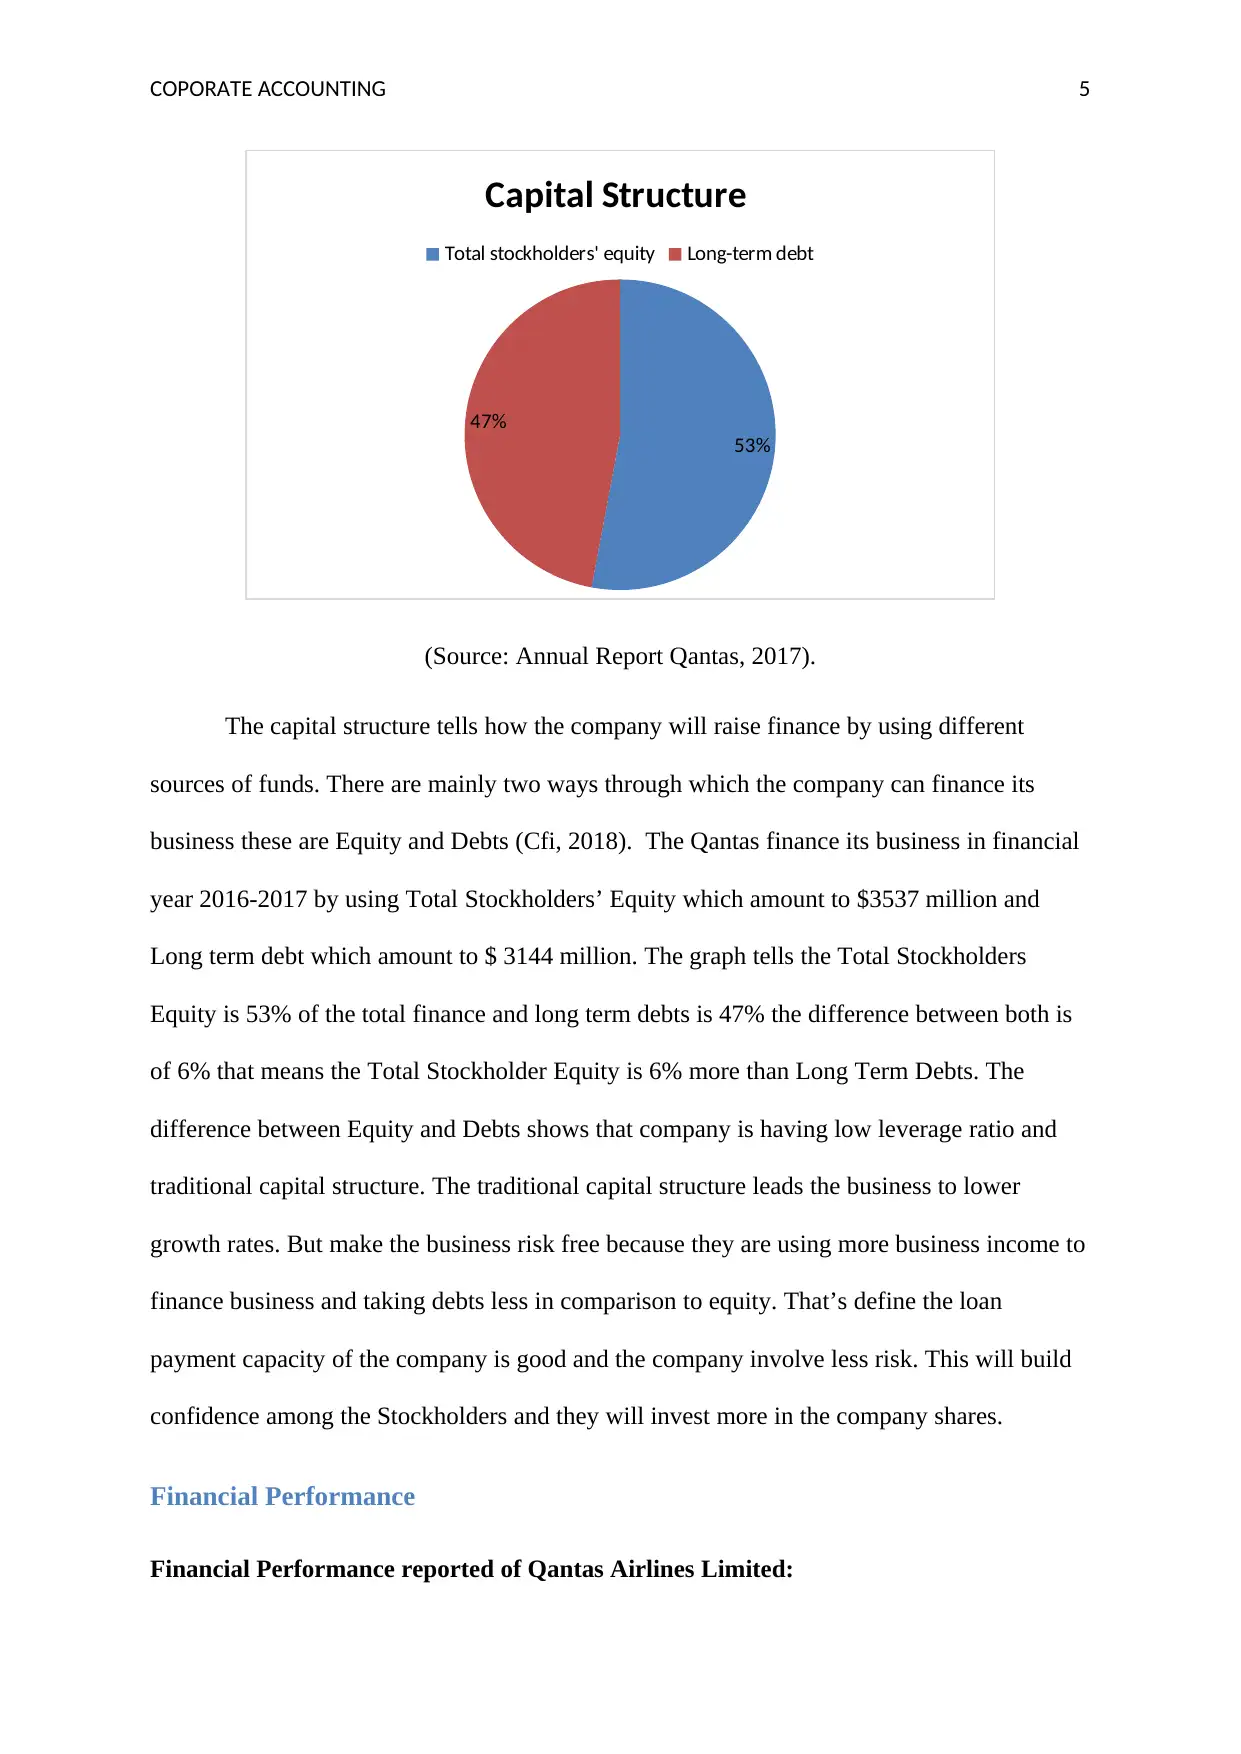
(Source: Annual Report Qantas, 2017).
The capital structure tells how the company will raise finance by using different
sources of funds. There are mainly two ways through which the company can finance its
business these are Equity and Debts (Cfi, 2018). The Qantas finance its business in financial
year 2016-2017 by using Total Stockholders’ Equity which amount to $3537 million and
Long term debt which amount to $ 3144 million. The graph tells the Total Stockholders
Equity is 53% of the total finance and long term debts is 47% the difference between both is
of 6% that means the Total Stockholder Equity is 6% more than Long Term Debts. The
difference between Equity and Debts shows that company is having low leverage ratio and
traditional capital structure. The traditional capital structure leads the business to lower
growth rates. But make the business risk free because they are using more business income to
finance business and taking debts less in comparison to equity. That’s define the loan
payment capacity of the company is good and the company involve less risk. This will build
confidence among the Stockholders and they will invest more in the company shares.
Financial Performance
Financial Performance reported of Qantas Airlines Limited:
53%
47%
Capital Structure
Total stockholders' equity Long-term debt
(Source: Annual Report Qantas, 2017).
The capital structure tells how the company will raise finance by using different
sources of funds. There are mainly two ways through which the company can finance its
business these are Equity and Debts (Cfi, 2018). The Qantas finance its business in financial
year 2016-2017 by using Total Stockholders’ Equity which amount to $3537 million and
Long term debt which amount to $ 3144 million. The graph tells the Total Stockholders
Equity is 53% of the total finance and long term debts is 47% the difference between both is
of 6% that means the Total Stockholder Equity is 6% more than Long Term Debts. The
difference between Equity and Debts shows that company is having low leverage ratio and
traditional capital structure. The traditional capital structure leads the business to lower
growth rates. But make the business risk free because they are using more business income to
finance business and taking debts less in comparison to equity. That’s define the loan
payment capacity of the company is good and the company involve less risk. This will build
confidence among the Stockholders and they will invest more in the company shares.
Financial Performance
Financial Performance reported of Qantas Airlines Limited:
⊘ This is a preview!⊘
Do you want full access?
Subscribe today to unlock all pages.
Trusted by 1+ million students worldwide
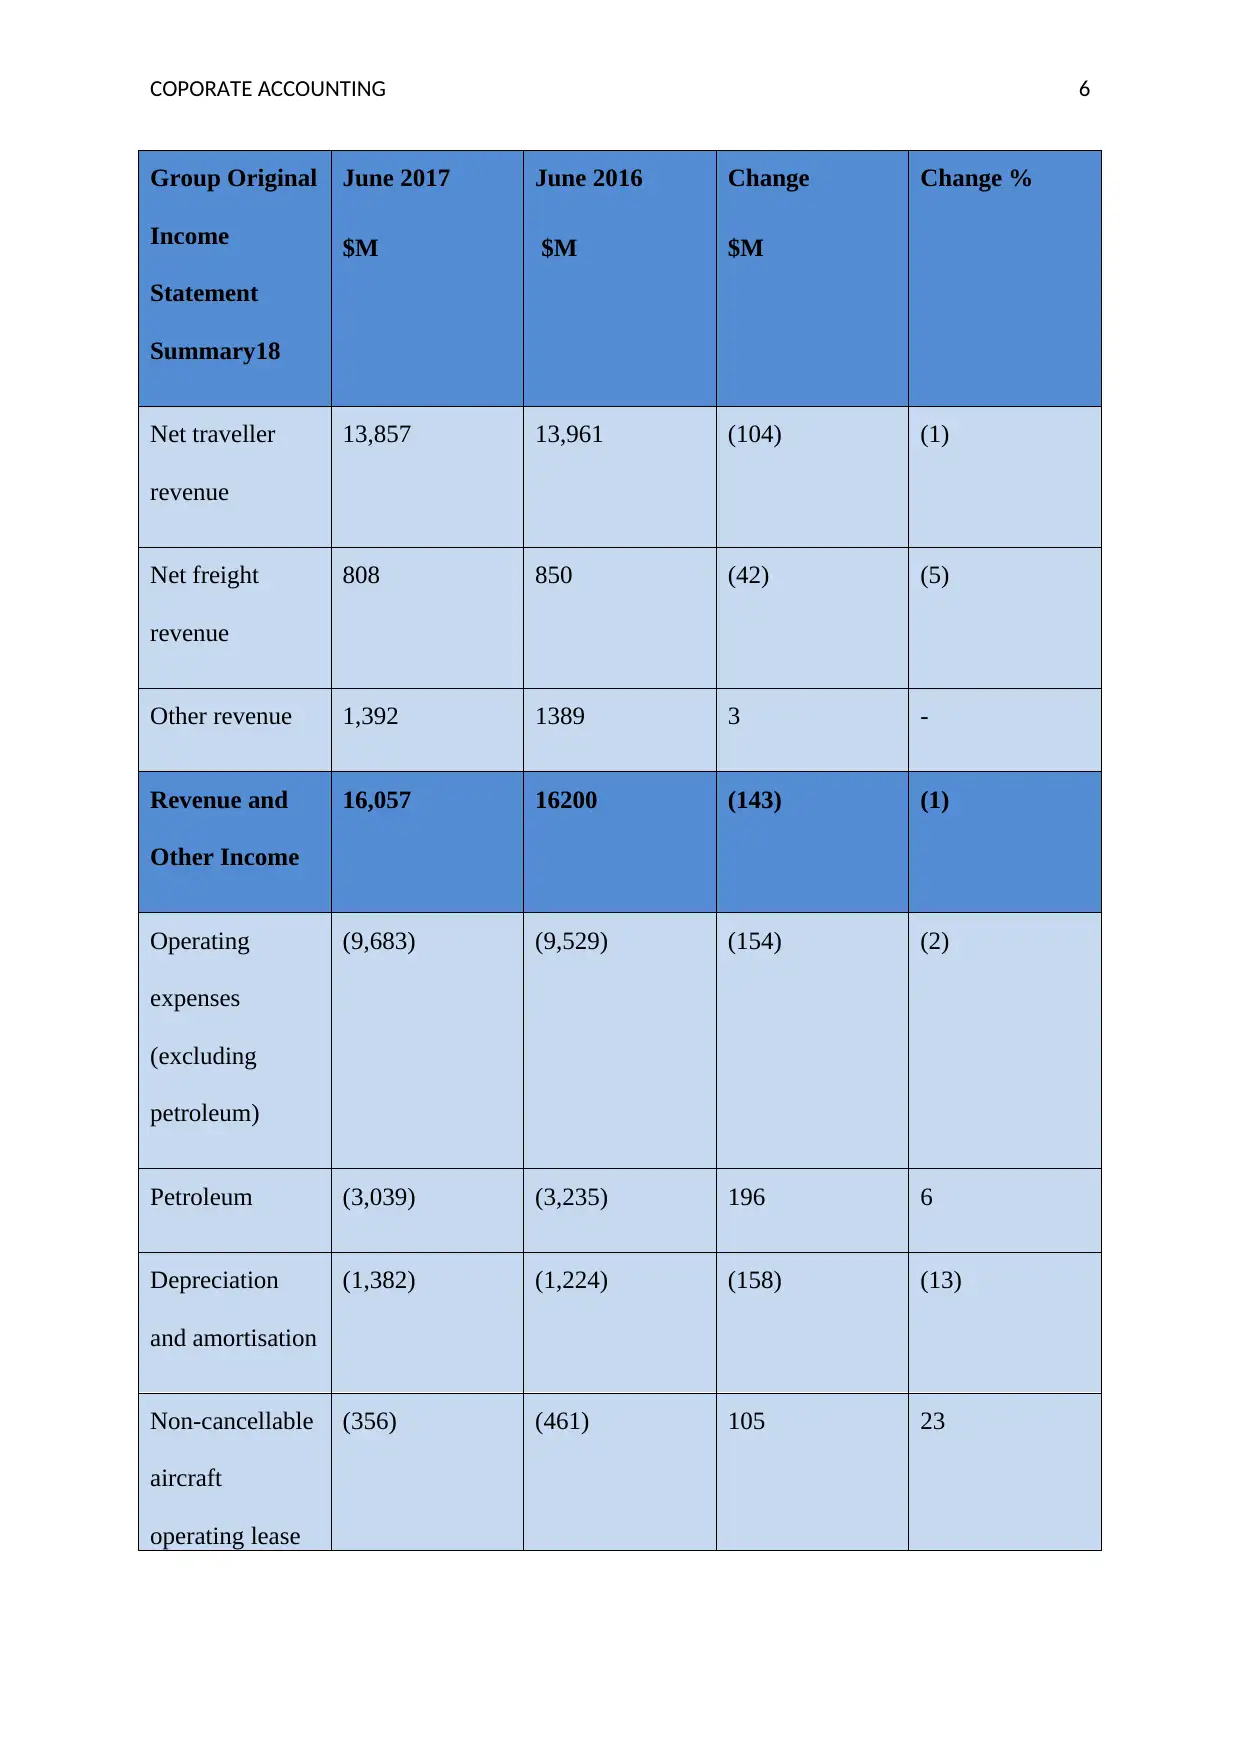
COPORATE ACCOUNTING 6
Group Original
Income
Statement
Summary18
June 2017
$M
June 2016
$M
Change
$M
Change %
Net traveller
revenue
13,857 13,961 (104) (1)
Net freight
revenue
808 850 (42) (5)
Other revenue 1,392 1389 3 -
Revenue and
Other Income
16,057 16200 (143) (1)
Operating
expenses
(excluding
petroleum)
(9,683) (9,529) (154) (2)
Petroleum (3,039) (3,235) 196 6
Depreciation
and amortisation
(1,382) (1,224) (158) (13)
Non-cancellable
aircraft
operating lease
(356) (461) 105 23
Paraphrase This Document
Need a fresh take? Get an instant paraphrase of this document with our AI Paraphraser
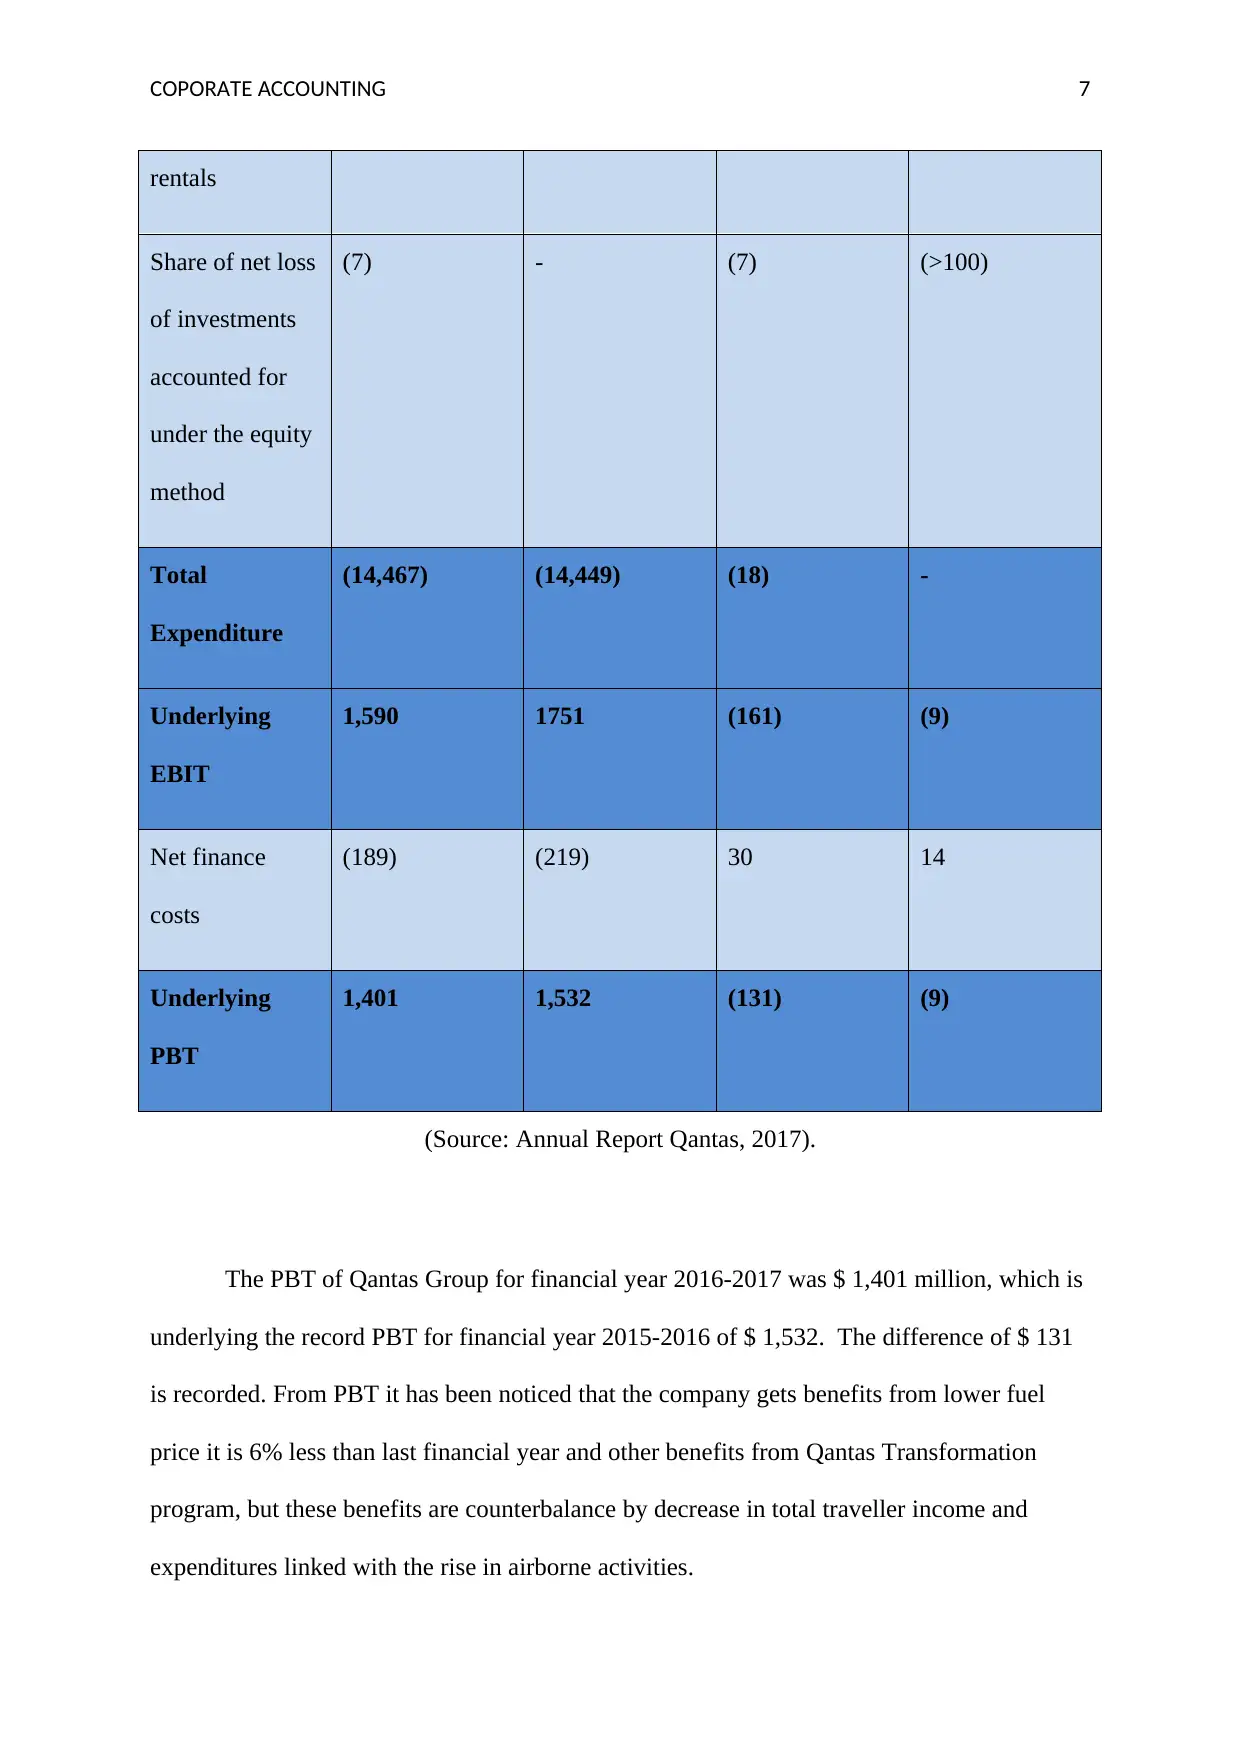
COPORATE ACCOUNTING 7
rentals
Share of net loss
of investments
accounted for
under the equity
method
(7) - (7) (>100)
Total
Expenditure
(14,467) (14,449) (18) -
Underlying
EBIT
1,590 1751 (161) (9)
Net finance
costs
(189) (219) 30 14
Underlying
PBT
1,401 1,532 (131) (9)
(Source: Annual Report Qantas, 2017).
The PBT of Qantas Group for financial year 2016-2017 was $ 1,401 million, which is
underlying the record PBT for financial year 2015-2016 of $ 1,532. The difference of $ 131
is recorded. From PBT it has been noticed that the company gets benefits from lower fuel
price it is 6% less than last financial year and other benefits from Qantas Transformation
program, but these benefits are counterbalance by decrease in total traveller income and
expenditures linked with the rise in airborne activities.
COPORATE ACCOUNTING 8
The total traveller income was reduced by 1 per cent, this happens because of
competitive pressures arise in global market and the introduction of the new paths
overshadowed the enhanced Revenue unit from local business and benefits from income from
the company transformation programme. The decrease in a petroleum expenses caused due to
lower AUD petroleum rates and fuel efficiency measurement process include in the company
transformation program which are counterbalance the rise in consumption related to the extra
airborne activities.
Changes in Accounting Policies
In the financial year 2016-2017 there is no change in the policies of accounting are recorded.
New Accounting Standards and Interpretation
1. AASB 9 (2014) introduce for Financial Instruments: The Company expected to accept
AASB 9 (2014) from 1 July 2018. Amendment includes a new estimated credit loss
model which will helpful in calculation of impairment on financial assets.
2. AASB 15 introduce for the Revenue generate from Contracts with customers- AASB
15 will substitute with AABS 111. This amendment supposed to accept from 1 of July
2018.
3. AASB 16 introduce for Leases- AASB 16 will be replace by AASB 117 and this
amendment will accept by the company from 1 July 2019 (Annual report Qantas,
2017)
Second Part
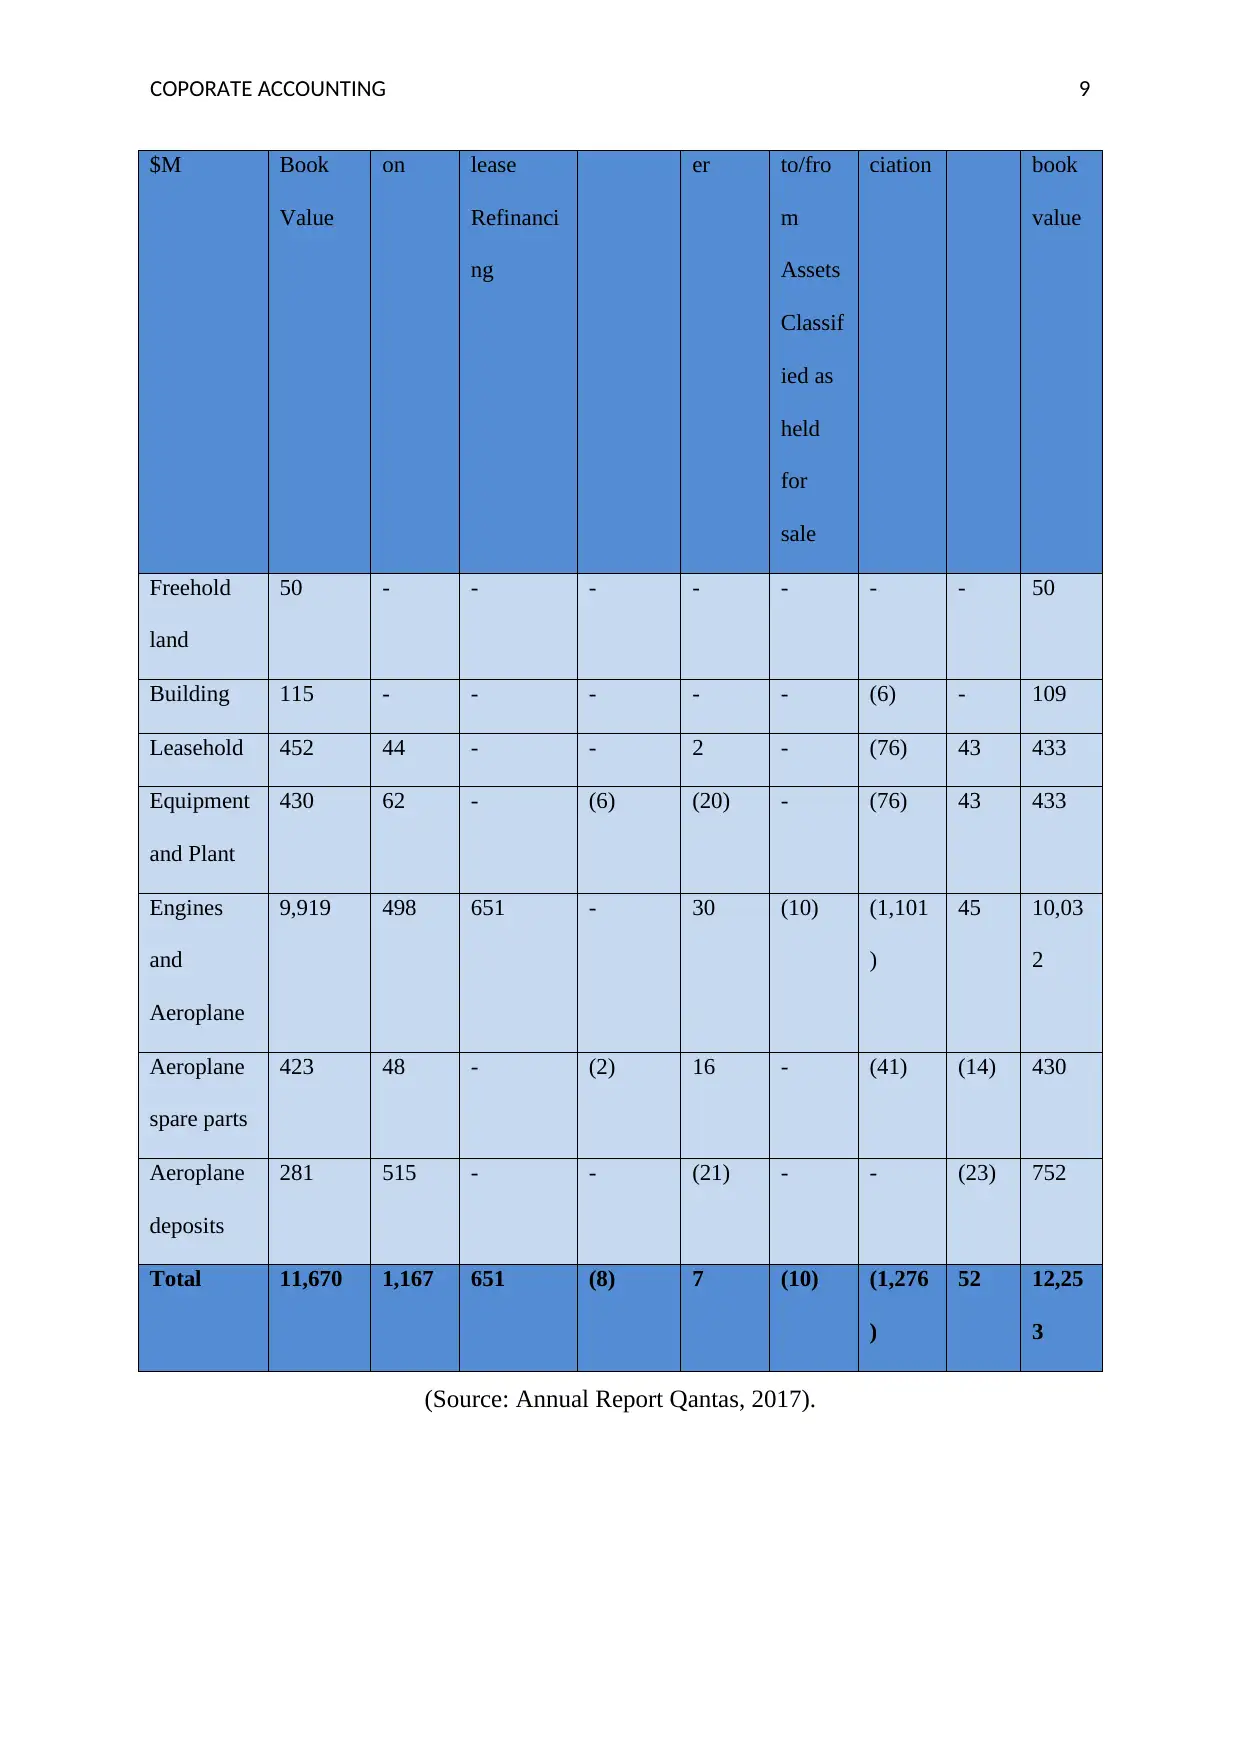
Carrying Amount of Plant, Equipment and Property
2017 Opening
Net
Additi Aircraft
Operating
Disposal Transf Transf
erred
Depre other Closi
ng net
The total traveller income was reduced by 1 per cent, this happens because of
competitive pressures arise in global market and the introduction of the new paths
overshadowed the enhanced Revenue unit from local business and benefits from income from
the company transformation programme. The decrease in a petroleum expenses caused due to
lower AUD petroleum rates and fuel efficiency measurement process include in the company
transformation program which are counterbalance the rise in consumption related to the extra
airborne activities.
Changes in Accounting Policies
In the financial year 2016-2017 there is no change in the policies of accounting are recorded.
New Accounting Standards and Interpretation
1. AASB 9 (2014) introduce for Financial Instruments: The Company expected to accept
AASB 9 (2014) from 1 July 2018. Amendment includes a new estimated credit loss
model which will helpful in calculation of impairment on financial assets.
2. AASB 15 introduce for the Revenue generate from Contracts with customers- AASB
15 will substitute with AABS 111. This amendment supposed to accept from 1 of July
2018.
3. AASB 16 introduce for Leases- AASB 16 will be replace by AASB 117 and this
amendment will accept by the company from 1 July 2019 (Annual report Qantas,
2017)
Second Part
Carrying Amount of Plant, Equipment and Property
2017 Opening
Net
Additi Aircraft
Operating
Disposal Transf Transf
erred
Depre other Closi
ng net
⊘ This is a preview!⊘
Do you want full access?
Subscribe today to unlock all pages.
Trusted by 1+ million students worldwide
COPORATE ACCOUNTING 9
$M Book
Value
on lease
Refinanci
ng
er to/fro
m
Assets
Classif
ied as
held
for
sale
ciation book
value
Freehold
land
50 - - - - - - - 50
Building 115 - - - - - (6) - 109
Leasehold 452 44 - - 2 - (76) 43 433
Equipment
and Plant
430 62 - (6) (20) - (76) 43 433
Engines
and
Aeroplane
9,919 498 651 - 30 (10) (1,101
)
45 10,03
2
Aeroplane
spare parts
423 48 - (2) 16 - (41) (14) 430
Aeroplane
deposits
281 515 - - (21) - - (23) 752
Total 11,670 1,167 651 (8) 7 (10) (1,276
)
52 12,25
3
(Source: Annual Report Qantas, 2017).
Paraphrase This Document
Need a fresh take? Get an instant paraphrase of this document with our AI Paraphraser
COPORATE ACCOUNTING 10
The total carrying amount for the year 2017 for Equipment, Property and Plant is
12,253
Accounting Policies for Equipment Property and Plant
Qantas apply Australian Accounting Standards (AASBs) when they prepare
company’s Annual Financial report. The three key policies of accounting are Plant,
Equipment, Property and Plant lease, asset, valuation and depreciation
The Australian Accounting Standards Board made Standard of Accounting AASB
116 for Equipment, Property and Plant. This is based on section 334 of the Corporation Act
2001.
In respect of Qantas PPE asset valuation policy, the item will be calculated on deemed
cost or cost less accumulated depreciation and loss due to impairment. The original amount
of the asset will be calculated at cost which include fair value of asset add incidental
acquisition cost (Fair value + Incidental cost). The incidental acquisition cost includes initial
estimate of instalment and usage and other applicable costs (Acca, 2018).
Lease accounting policy includes all substantial risk and benefits associate with
ownership. This type of lease capitalised as both assets and liabilities at present value. And
other leases are grouped as operating lease (Pwc, 2018).
Under Depreciation policy Qantas apply straight line depreciation method on all
articles of Plant, Equipment and Property. Freehold land is excluded from depreciable items.
To allocate the valuation and cost of an asset this standard of accounting help to determine
the rate to depreciation will be applicable on them. The rate of deprecation will be decided by
this standard of accounting for the assets, from the date they are acquire and till the entire life
of usage (Australian government, 2014).
COPORATE ACCOUNTING 11
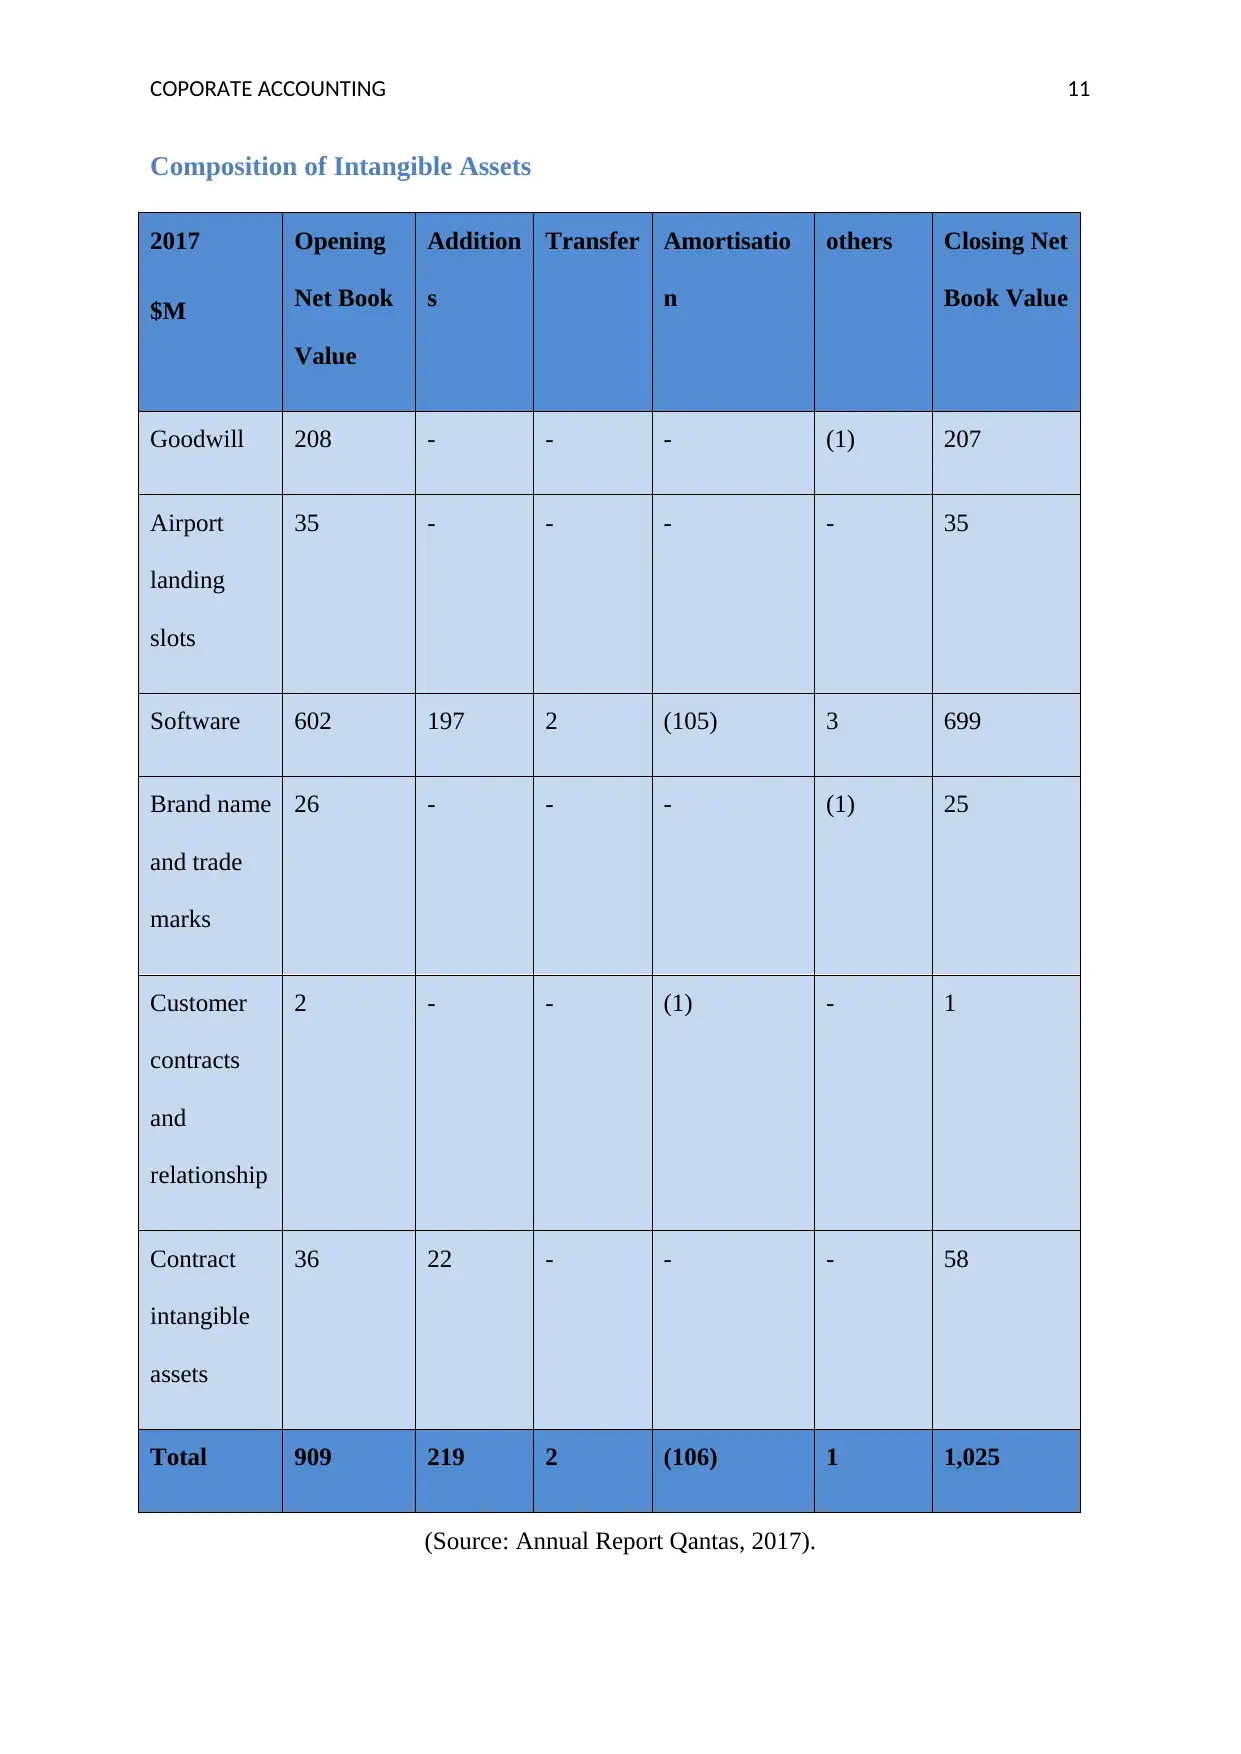
Composition of Intangible Assets
2017
$M
Opening
Net Book
Value
Addition
s
Transfer Amortisatio
n
others Closing Net
Book Value
Goodwill 208 - - - (1) 207
Airport
landing
slots
35 - - - - 35
Software 602 197 2 (105) 3 699
Brand name
and trade
marks
26 - - - (1) 25
Customer
contracts
and
relationship
2 - - (1) - 1
Contract
intangible
assets
36 22 - - - 58
Total 909 219 2 (106) 1 1,025
(Source: Annual Report Qantas, 2017).
⊘ This is a preview!⊘
Do you want full access?
Subscribe today to unlock all pages.
Trusted by 1+ million students worldwide
1 out of 18
Related Documents


Your All-in-One AI-Powered Toolkit for Academic Success.
+13062052269
info@desklib.com
Available 24*7 on WhatsApp / Email
![[object Object]](/_next/static/media/star-bottom.7253800d.svg)
Unlock your academic potential
Copyright © 2020–2026 A2Z Services. All Rights Reserved. Developed and managed by ZUCOL.