Financial Performance Analysis of Qantas Airways (AFA1201)
VerifiedAdded on 2022/11/13
|12
|2456
|353
Report
AI Summary
This report provides a comprehensive financial analysis of Qantas Airways, examining its performance from 2015 to 2018. The analysis includes an executive summary, introduction, and company overview, followed by detailed trend analysis of revenue and net profit, revealing fluctuations and an overall upward trend. Vertical analysis of the income statement and balance sheet for 2018 identifies key proportions and resource allocation. Ratio analysis assesses profitability using return on equity, return on assets, and net profit margin, demonstrating increasing profitability. Liquidity ratios, including current and quick ratios, are also calculated, highlighting the need for improved current asset management. The report concludes with a summary of findings and references, offering valuable insights into Qantas Airways' financial health and performance.

1
Accounting for managers
Accounting for managers
Paraphrase This Document
Need a fresh take? Get an instant paraphrase of this document with our AI Paraphraser
2
Executive summary
The report has been prepared for the Qantas airways and in that there is the consideration
of the trends which are involved in the revenues and profits of the company. It is identified that
there is an increasing trend and company is performing in the best possible manner. There is the
identification of the proportion which is maintained by all of the elements and for that the
vertical analysis has been performed. There is the ratio analysis which is performed and in that
there is the consideration of the profitability which is maintained by the company in an adequate
manner. The liquidity is also covered and it is not maintained by the company and they will be
facing the difficulty in the payment of the obligations. This will be required to be improved and
there will be further investments which will have to be made in the current assets by the
company.
3
Table of Contents
Executive summary.........................................................................................................................2
Introduction......................................................................................................................................4
Company overview..........................................................................................................................4
Analysis...........................................................................................................................................4
Trend analysis..............................................................................................................................4
Vertical analysis...........................................................................................................................6
Ratio analysis...............................................................................................................................7
Conclusion.......................................................................................................................................9
References......................................................................................................................................10
Appendix........................................................................................................................................11
⊘ This is a preview!⊘
Do you want full access?
Subscribe today to unlock all pages.
Trusted by 1+ million students worldwide
4
Introduction
In the business, there are various aspects which are involved in accounting. It is necessary
that the analysis shall be carried in an effective manner and for that there are various techniques
which will be used. The most common of all the techniques are trend analysis, ratio analysis, and
vertical analysis. Under them all of the information which is available will be used and by that
help of that the calculations will be made. There will be calculation of various ratios by which
the performance and liquidity of the company will be evaluated. The trend which is present in
the company will be identified and then the further decisions will be made accordingly.
Company overview
A Qantas airway is the airline company which provides the transport facilities. The
company is performing in various sections and in that operations are carried in the domestic and
international air transportation. The company is found in 1920 and has attained the growth since
then. It is considered as the leading airlines of the world. There are various features for which the
company is known and that include reliability, safety, maintenance and customer services
(Qantas airways, 2019). There are two brands which are involved and they are Jetstar and
Qantas. It provides the transport facilities to the passengers in domestic as well as international
market. There is the expansion which is carried and in that the total numbers of flights which are
undertaken are increased.
Analysis
Trend analysis
Trend analysis is the technique in which the changes which are taking place among
various items from the past few years are analyzed. The changes which are taking place are taken
into consideration and with that, the trend whether upward or downward are identified (DeFusco
et al., 2015). The trend analysis for the total revenue and net profit is provided below:
Paraphrase This Document
Need a fresh take? Get an instant paraphrase of this document with our AI Paraphraser
5
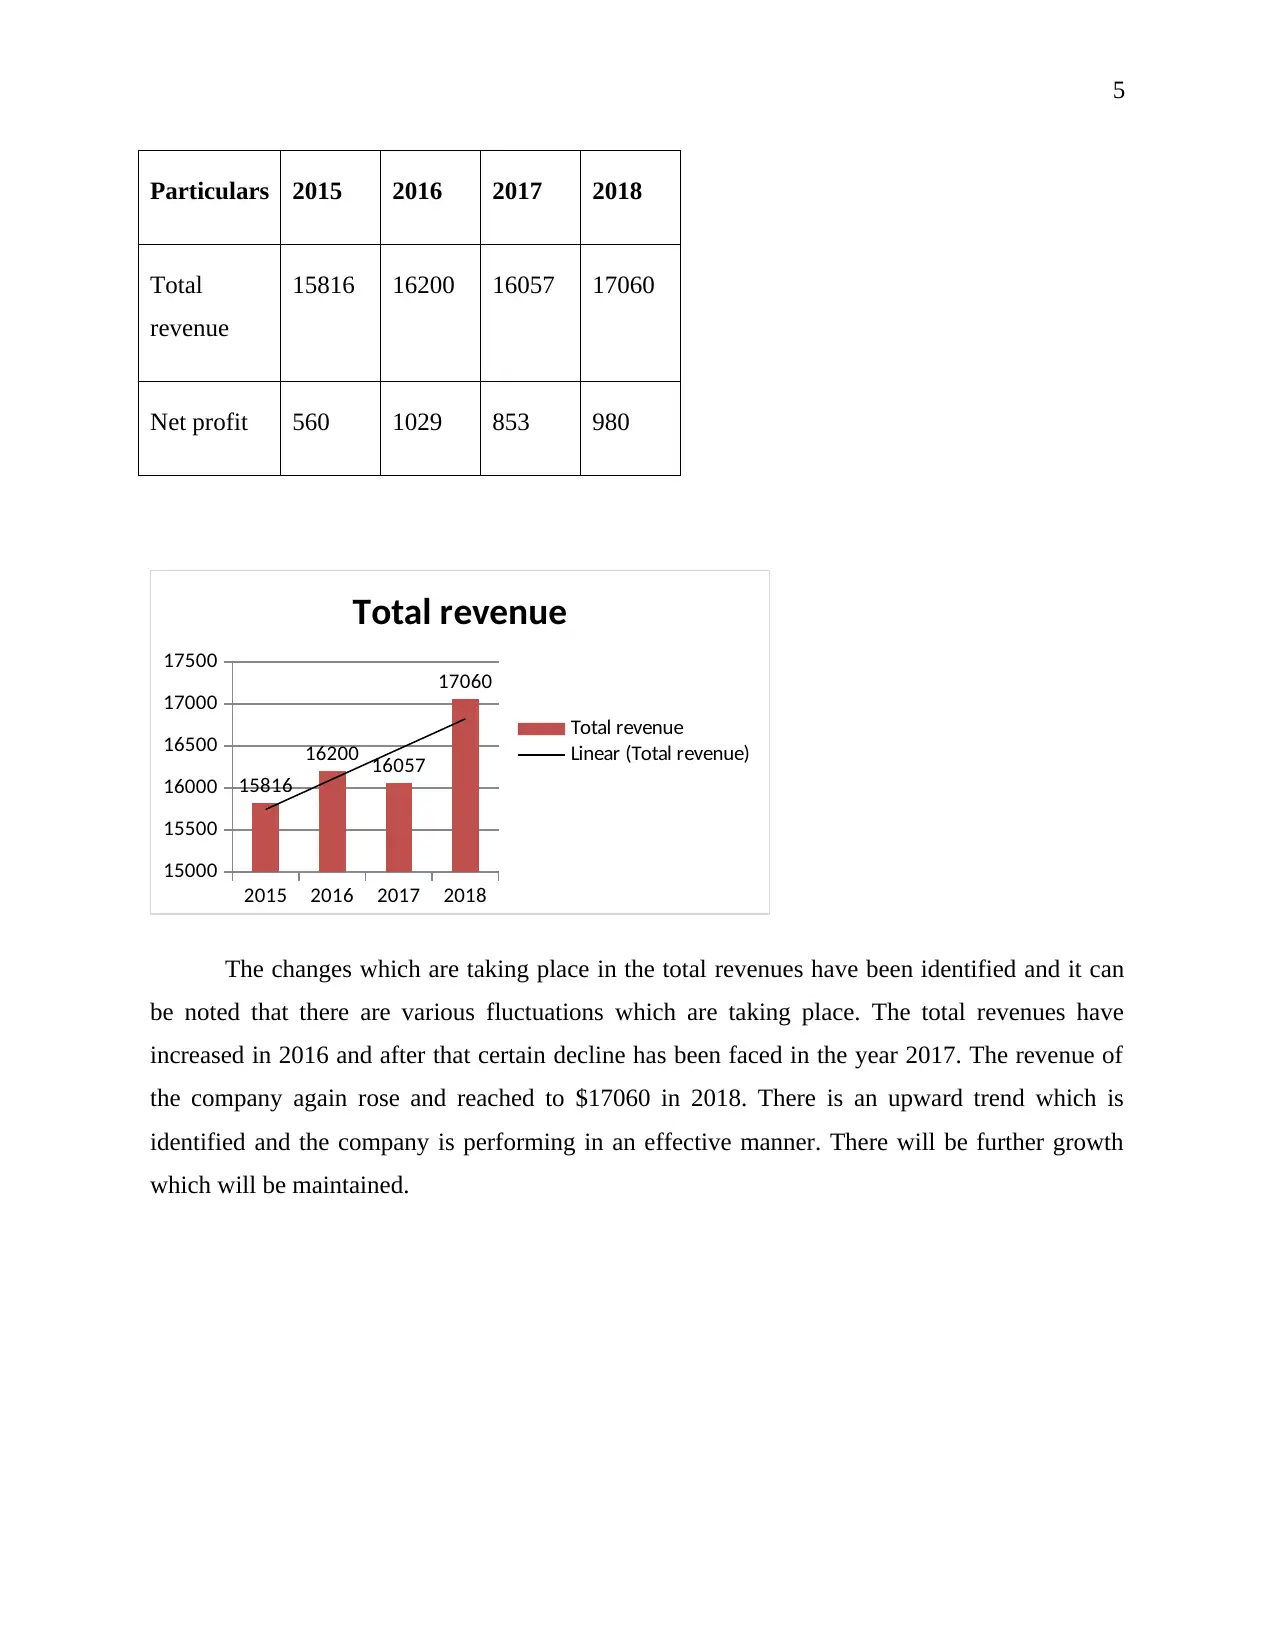
Particulars 2015 2016 2017 2018
Total
revenue
15816 16200 16057 17060
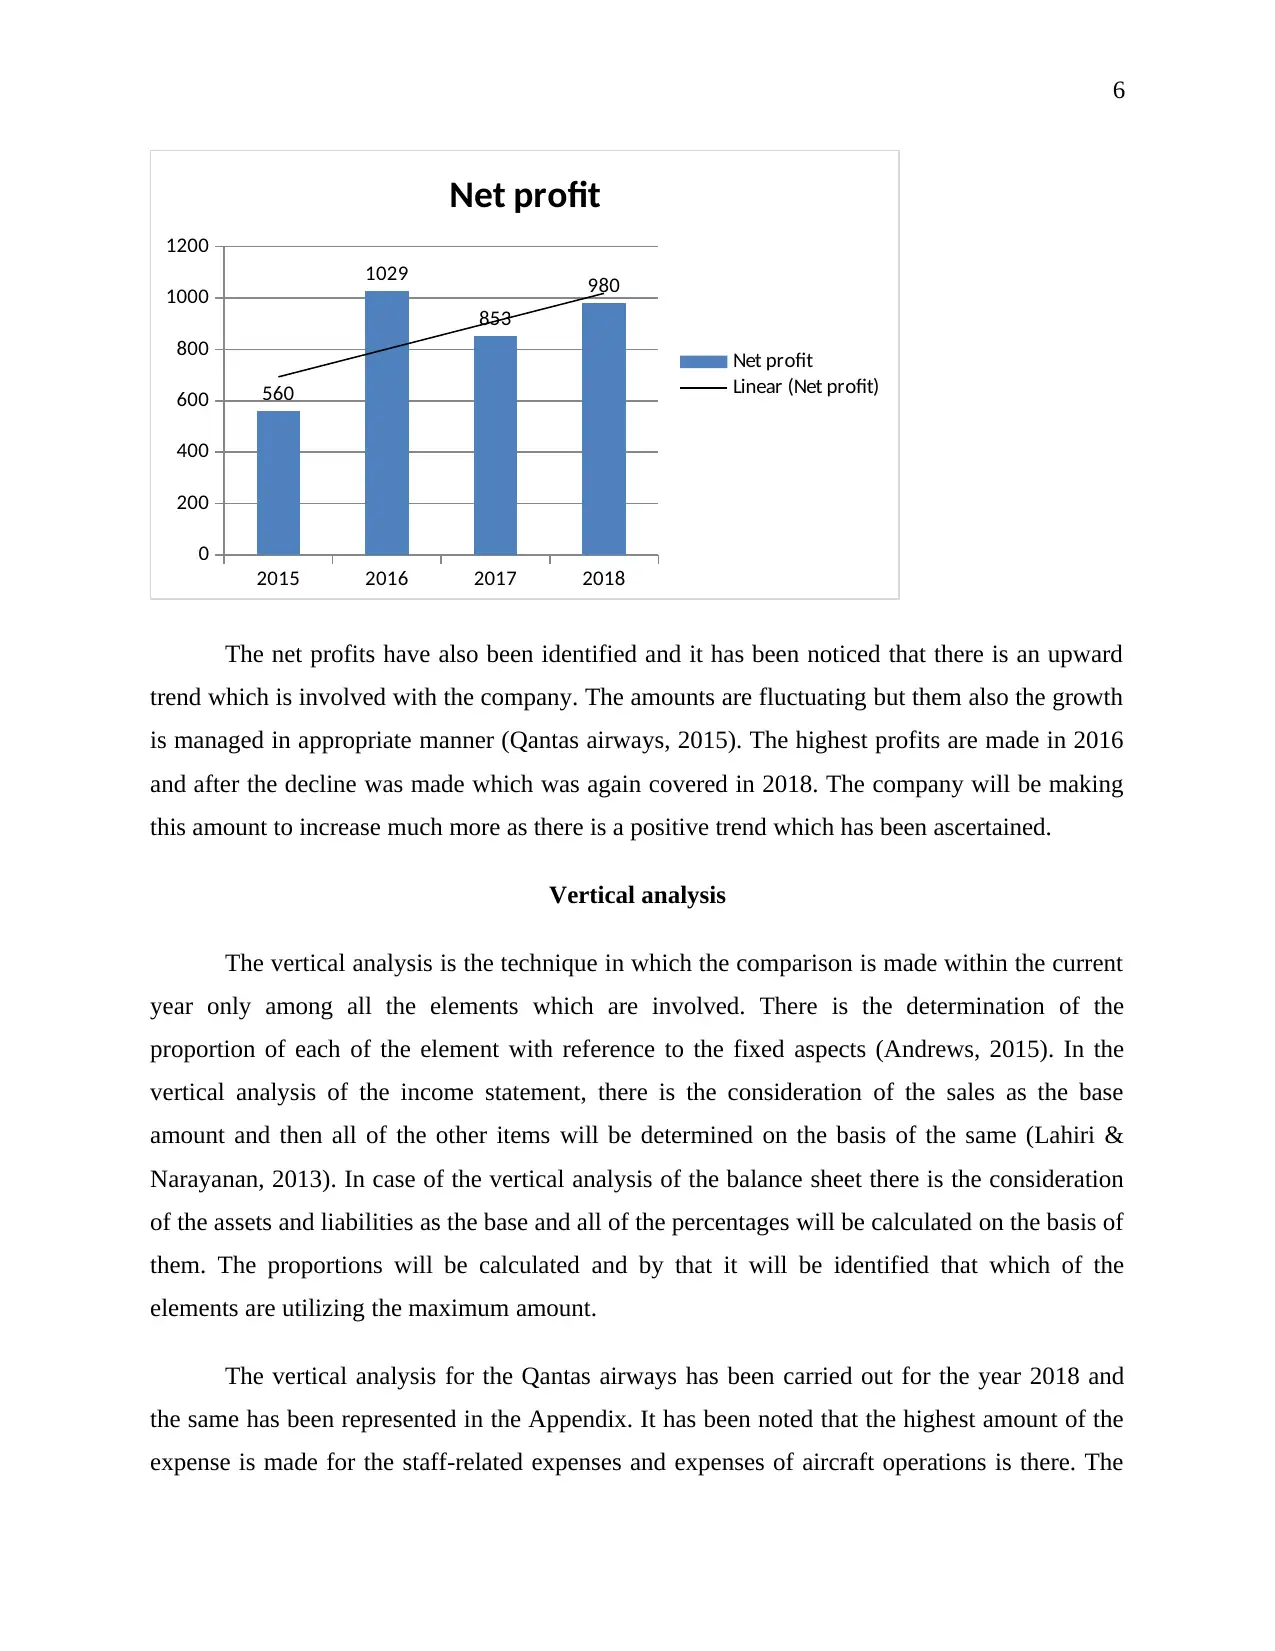
Net profit 560 1029 853 980
2015 2016 2017 2018
15000
15500
16000
16500
17000
17500
15816
16200 16057
17060
Total revenue
Total revenue
Linear (Total revenue)
The changes which are taking place in the total revenues have been identified and it can
be noted that there are various fluctuations which are taking place. The total revenues have
increased in 2016 and after that certain decline has been faced in the year 2017. The revenue of
the company again rose and reached to $17060 in 2018. There is an upward trend which is
identified and the company is performing in an effective manner. There will be further growth
which will be maintained.
Particulars 2015 2016 2017 2018
Total
revenue
15816 16200 16057 17060
Net profit 560 1029 853 980
2015 2016 2017 2018
15000
15500
16000
16500
17000
17500
15816
16200 16057
17060
Total revenue
Total revenue
Linear (Total revenue)
The changes which are taking place in the total revenues have been identified and it can
be noted that there are various fluctuations which are taking place. The total revenues have
increased in 2016 and after that certain decline has been faced in the year 2017. The revenue of
the company again rose and reached to $17060 in 2018. There is an upward trend which is
identified and the company is performing in an effective manner. There will be further growth
which will be maintained.
6
2015 2016 2017 2018
0
200
400
600
800
1000
1200
560
1029
853
980
Net profit
Net profit
Linear (Net profit)
The net profits have also been identified and it has been noticed that there is an upward
trend which is involved with the company. The amounts are fluctuating but them also the growth
is managed in appropriate manner (Qantas airways, 2015). The highest profits are made in 2016
and after the decline was made which was again covered in 2018. The company will be making
this amount to increase much more as there is a positive trend which has been ascertained.
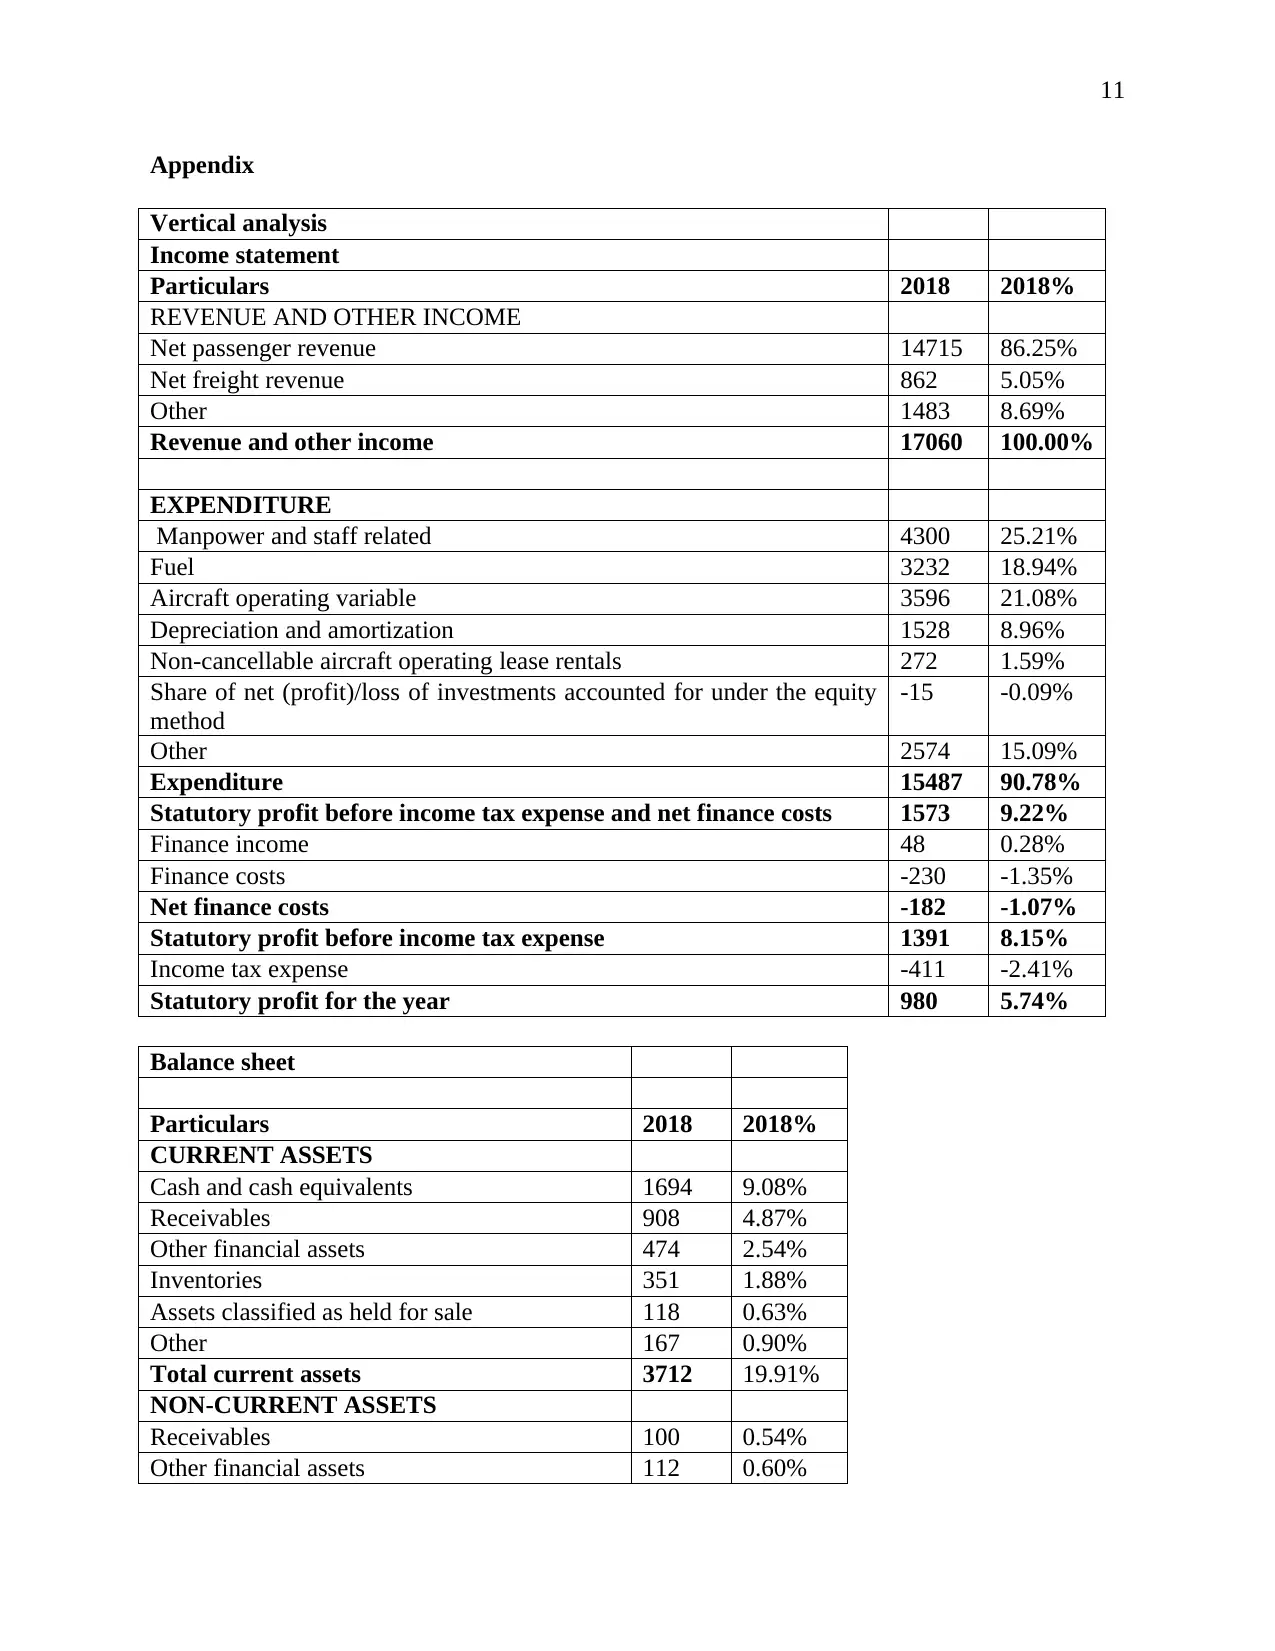
Vertical analysis
The vertical analysis is the technique in which the comparison is made within the current
year only among all the elements which are involved. There is the determination of the
proportion of each of the element with reference to the fixed aspects (Andrews, 2015). In the
vertical analysis of the income statement, there is the consideration of the sales as the base
amount and then all of the other items will be determined on the basis of the same (Lahiri &
Narayanan, 2013). In case of the vertical analysis of the balance sheet there is the consideration
of the assets and liabilities as the base and all of the percentages will be calculated on the basis of
them. The proportions will be calculated and by that it will be identified that which of the
elements are utilizing the maximum amount.
The vertical analysis for the Qantas airways has been carried out for the year 2018 and
the same has been represented in the Appendix. It has been noted that the highest amount of the
expense is made for the staff-related expenses and expenses of aircraft operations is there. The
2015 2016 2017 2018
0
200
400
600
800
1000
1200
560
1029
853
980
Net profit
Net profit
Linear (Net profit)
The net profits have also been identified and it has been noticed that there is an upward
trend which is involved with the company. The amounts are fluctuating but them also the growth
is managed in appropriate manner (Qantas airways, 2015). The highest profits are made in 2016
and after the decline was made which was again covered in 2018. The company will be making
this amount to increase much more as there is a positive trend which has been ascertained.
Vertical analysis
The vertical analysis is the technique in which the comparison is made within the current
year only among all the elements which are involved. There is the determination of the
proportion of each of the element with reference to the fixed aspects (Andrews, 2015). In the
vertical analysis of the income statement, there is the consideration of the sales as the base
amount and then all of the other items will be determined on the basis of the same (Lahiri &
Narayanan, 2013). In case of the vertical analysis of the balance sheet there is the consideration
of the assets and liabilities as the base and all of the percentages will be calculated on the basis of
them. The proportions will be calculated and by that it will be identified that which of the
elements are utilizing the maximum amount.
The vertical analysis for the Qantas airways has been carried out for the year 2018 and
the same has been represented in the Appendix. It has been noted that the highest amount of the
expense is made for the staff-related expenses and expenses of aircraft operations is there. The
⊘ This is a preview!⊘
Do you want full access?
Subscribe today to unlock all pages.
Trusted by 1+ million students worldwide
7
company has made net profits which are 5.74% of the sales (Qantas airways, 2016). This shows
that company is maintaining the profitability.
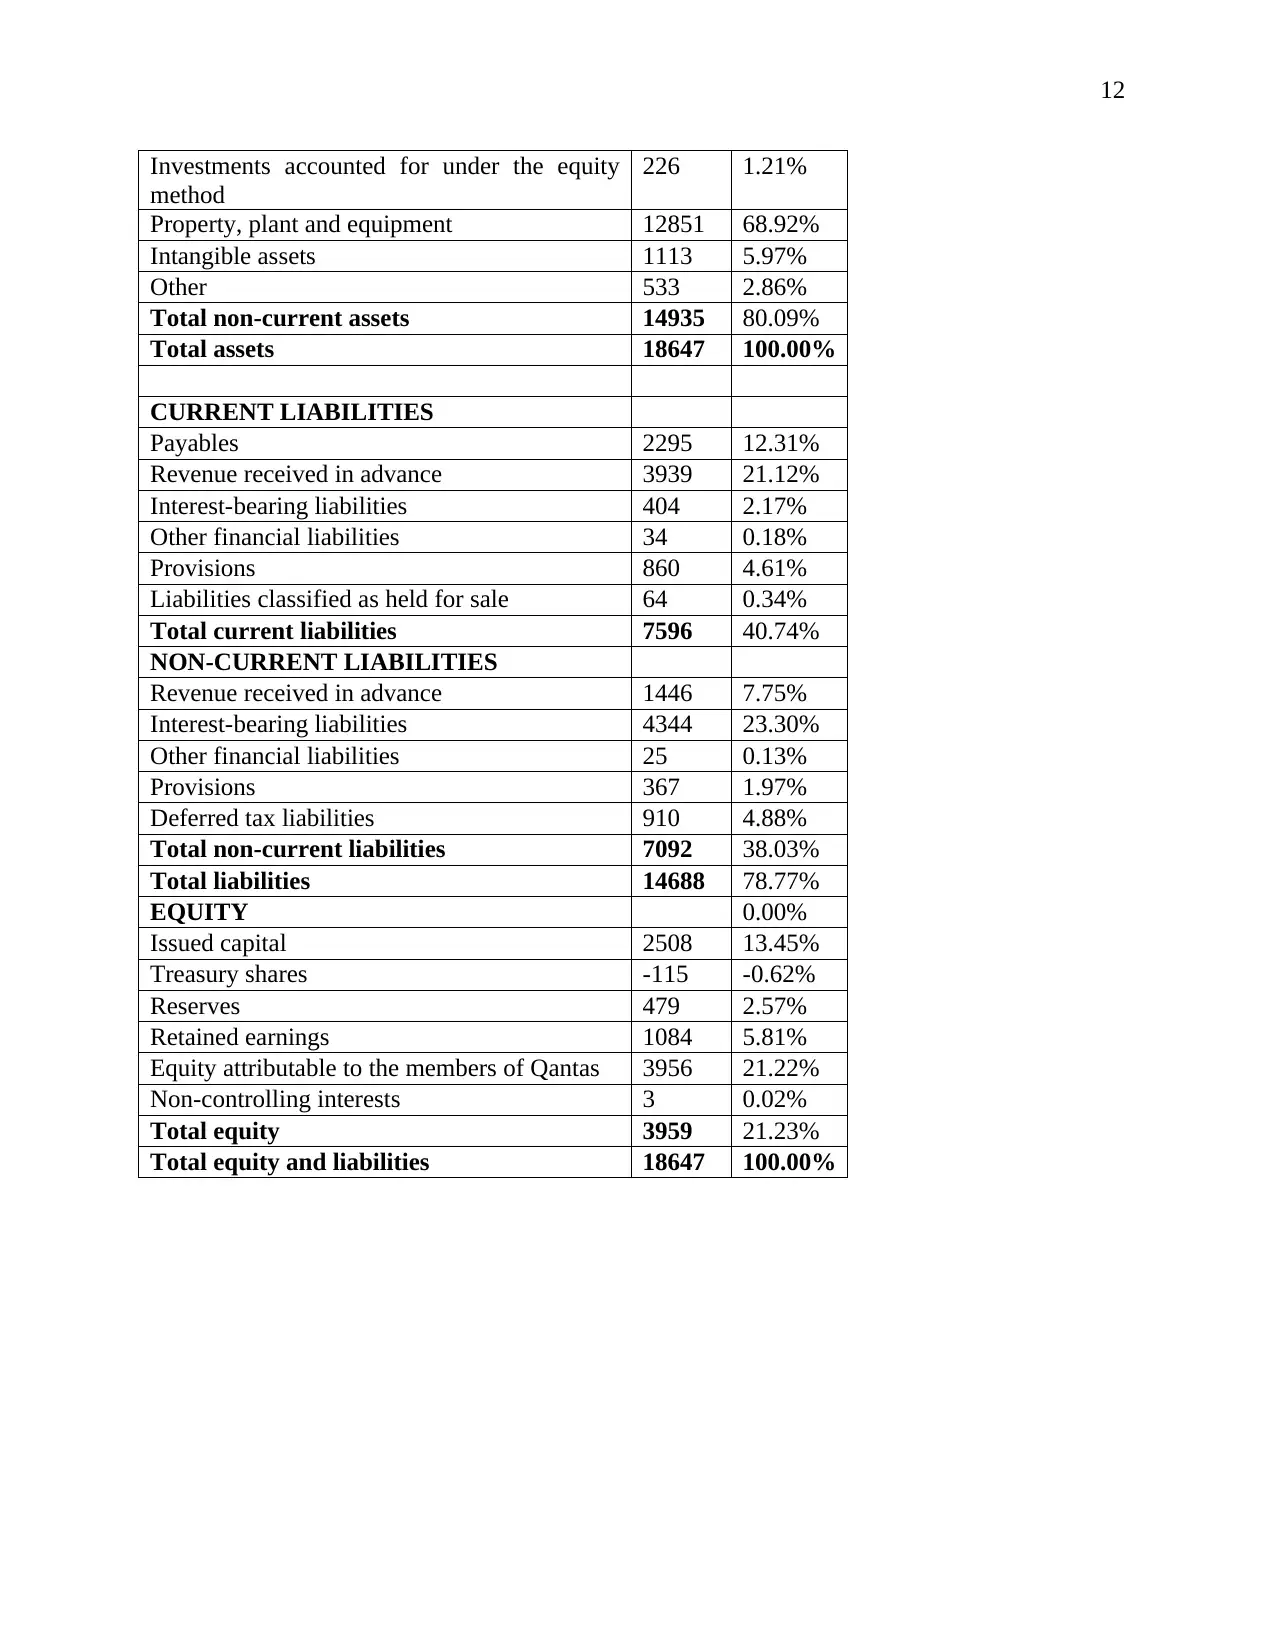
In the assets plant and property comprise of the highest stake and after that cash balance
is maintained by the company. Interest-bearing liabilities are the highest in the liabilities
category and this shows that company will be required to bear the same and meet all of the
expenses which are there in relation to the same. All of the findings which are made will be used
by the company to take further decisions and the pan for the coming period will be made. It will
be prepared by taking all the findings in account and by that there will be rise in the profits in the
future and business will attain growth.
Ratio analysis
A ratio is another technique which is used to analyze the performance and in this, there
are various categories which are involved. They will be taken into consideration with the help of
available data and then the comparison will be made. There will be use of the data and the
calculation will be made in such manner that the profitability and liquidity will be analyzed in
the most appropriate manner.
Profitability ratios:
These are the ratios by which the profits which are made by the company will be
evaluated. There will be consideration of the net profit and then compared with the other
elements will be made (Delen et al., 2013). In the given case there will be calculation of the
return on equity, return on total assets and net profit margin ratios. The calculation is made and it
shows hereunder:
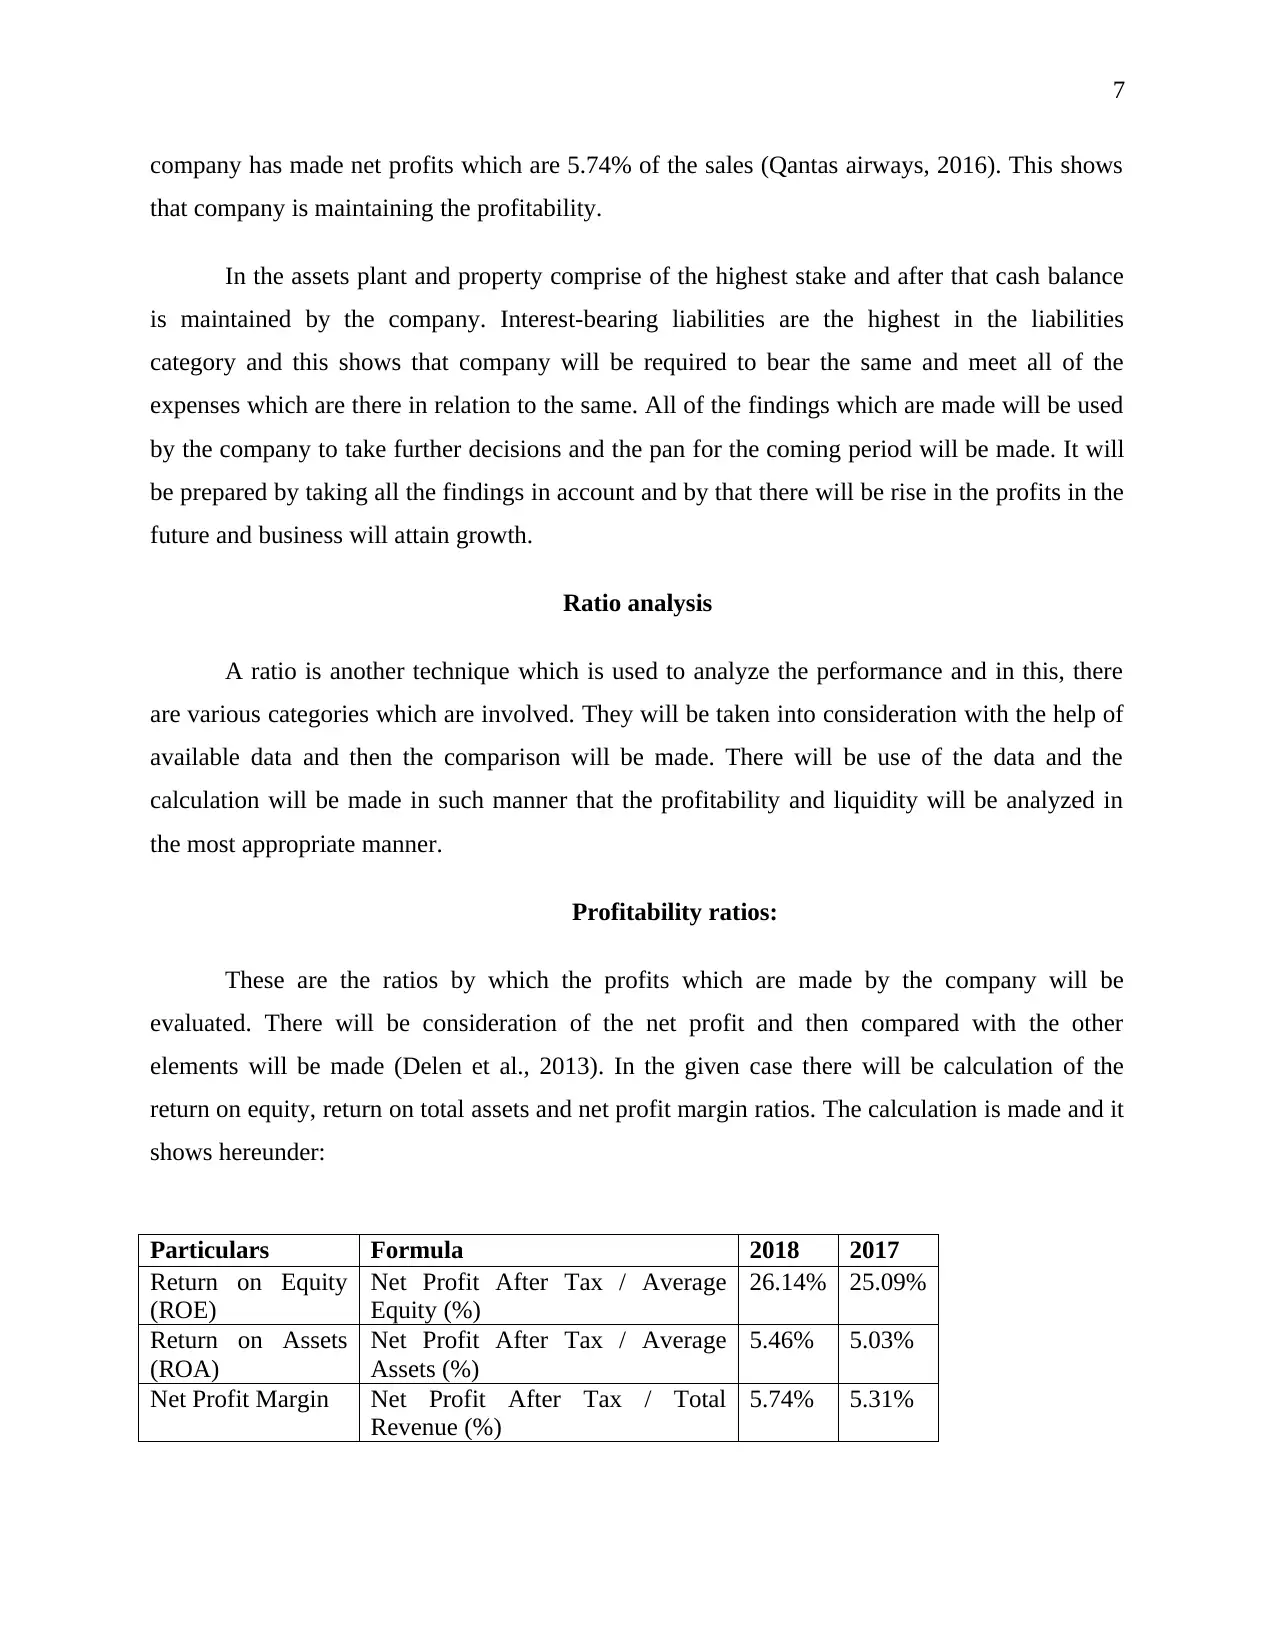
Particulars Formula 2018 2017
Return on Equity
(ROE)
Net Profit After Tax / Average
Equity (%)
26.14% 25.09%
Return on Assets
(ROA)
Net Profit After Tax / Average
Assets (%)
5.46% 5.03%
Net Profit Margin Net Profit After Tax / Total
Revenue (%)
5.74% 5.31%
company has made net profits which are 5.74% of the sales (Qantas airways, 2016). This shows
that company is maintaining the profitability.
In the assets plant and property comprise of the highest stake and after that cash balance
is maintained by the company. Interest-bearing liabilities are the highest in the liabilities
category and this shows that company will be required to bear the same and meet all of the
expenses which are there in relation to the same. All of the findings which are made will be used
by the company to take further decisions and the pan for the coming period will be made. It will
be prepared by taking all the findings in account and by that there will be rise in the profits in the
future and business will attain growth.
Ratio analysis
A ratio is another technique which is used to analyze the performance and in this, there
are various categories which are involved. They will be taken into consideration with the help of
available data and then the comparison will be made. There will be use of the data and the
calculation will be made in such manner that the profitability and liquidity will be analyzed in
the most appropriate manner.
Profitability ratios:
These are the ratios by which the profits which are made by the company will be
evaluated. There will be consideration of the net profit and then compared with the other
elements will be made (Delen et al., 2013). In the given case there will be calculation of the
return on equity, return on total assets and net profit margin ratios. The calculation is made and it
shows hereunder:
Particulars Formula 2018 2017
Return on Equity
(ROE)
Net Profit After Tax / Average
Equity (%)
26.14% 25.09%
Return on Assets
(ROA)
Net Profit After Tax / Average
Assets (%)
5.46% 5.03%
Net Profit Margin Net Profit After Tax / Total
Revenue (%)
5.74% 5.31%
Paraphrase This Document
Need a fresh take? Get an instant paraphrase of this document with our AI Paraphraser
8
The calculations have been made and in that it can be noted that there is an increase
which is made in the profitability of the company. There is an increase in the return on equity
and that is from 25.09% in 2017 to 26.14% in 2018 and this is because of the increase in the
earnings which is made by the company. The other two ratios are also increasing and that is
because the net profit which is made by the company has increased (Qantas airways, 2017). The
revenue has raised and with that the profits of the company have also increased. This is good for
the company and it shows that the business will be able to maintain sustainability and that will
continue in the long run. There will be funds which will be used for the making of the further
investments which will earn more returns in addition to the current profits.
Liquidity ratios:
In the business, there are various liabilities which are to be met and for that the liquidity
is required to be managed. In that all of the liabilities which are there will be analyzed together
with the assets which are available to meet them (Paradi & Zhu, 2013). The company is required
to maintain the adequate level of the assets by which the obligations will be met on time and that
will be making the company efficient in dealing with the liabilities. The calculation of the ratios
in this respect is shown below:
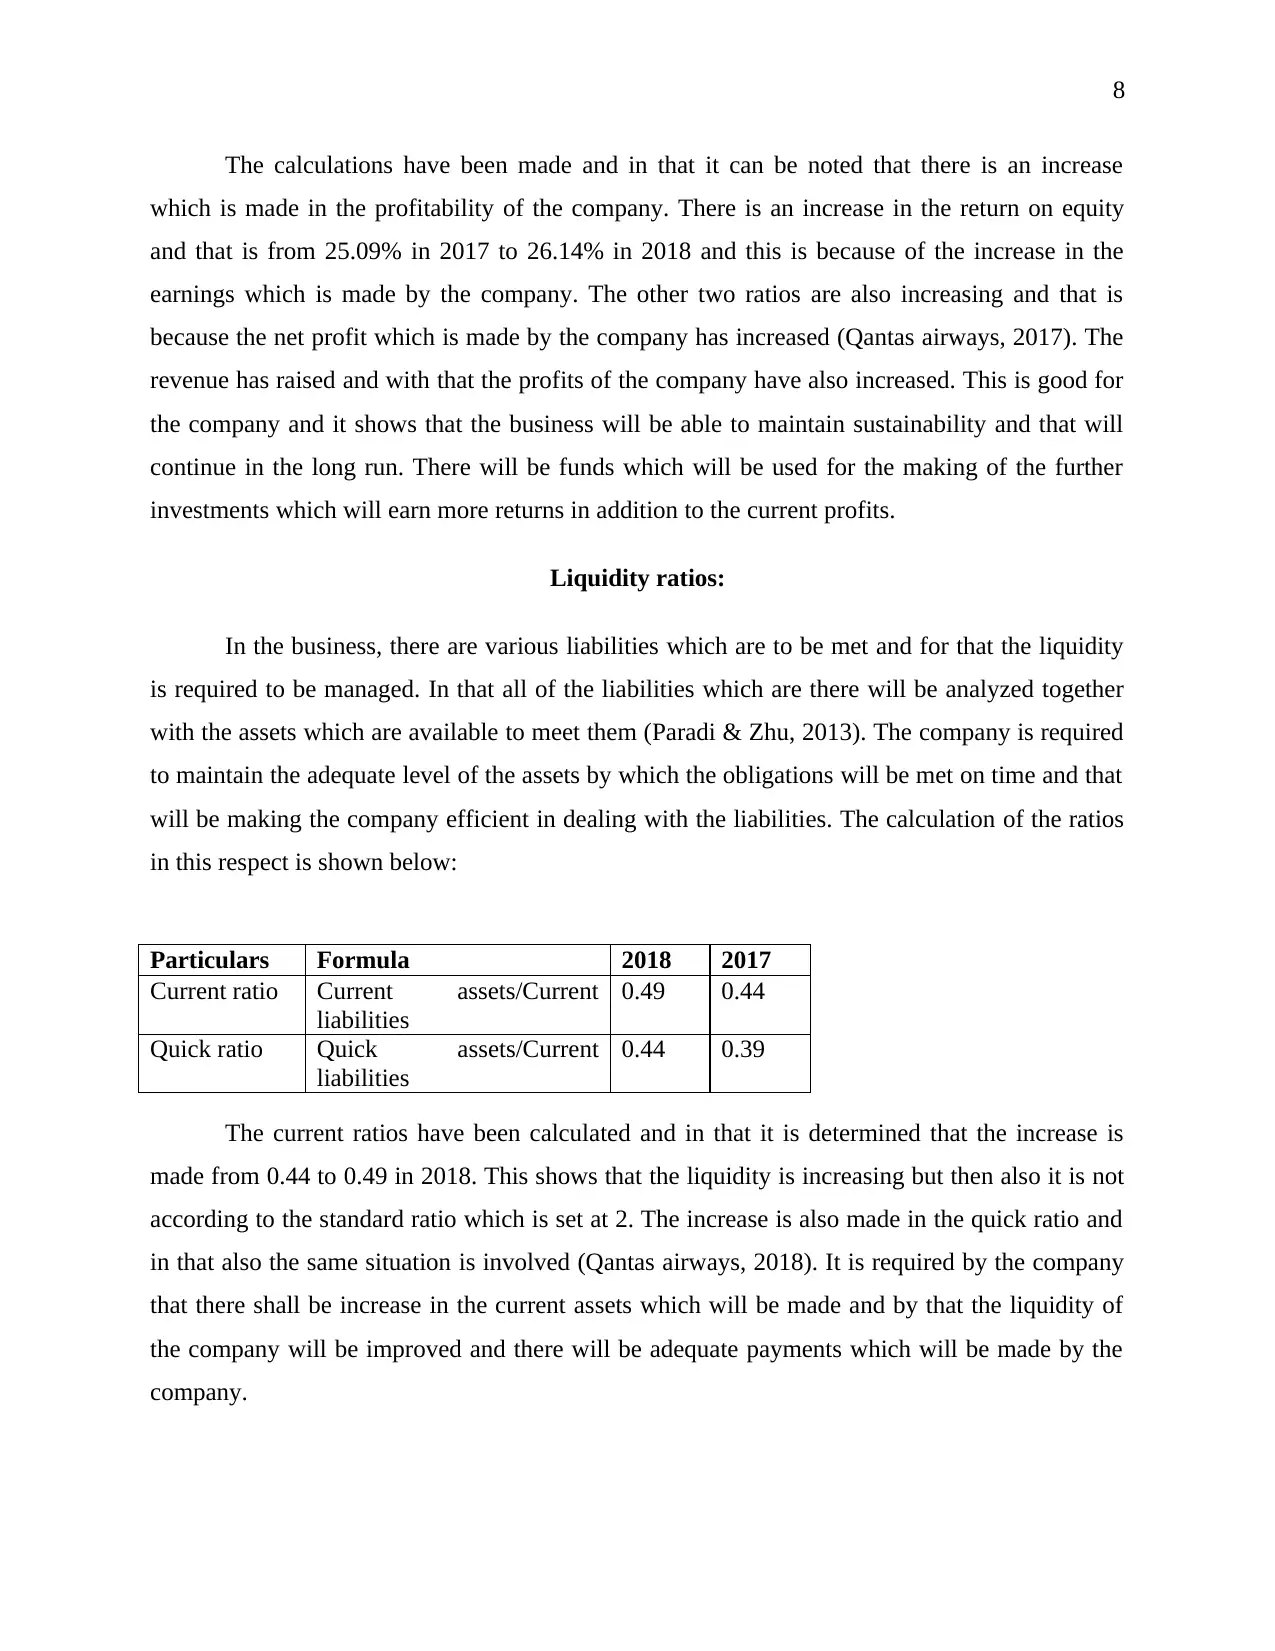
Particulars Formula 2018 2017
Current ratio Current assets/Current
liabilities
0.49 0.44
Quick ratio Quick assets/Current
liabilities
0.44 0.39
The current ratios have been calculated and in that it is determined that the increase is
made from 0.44 to 0.49 in 2018. This shows that the liquidity is increasing but then also it is not
according to the standard ratio which is set at 2. The increase is also made in the quick ratio and
in that also the same situation is involved (Qantas airways, 2018). It is required by the company
that there shall be increase in the current assets which will be made and by that the liquidity of
the company will be improved and there will be adequate payments which will be made by the
company.
The calculations have been made and in that it can be noted that there is an increase
which is made in the profitability of the company. There is an increase in the return on equity
and that is from 25.09% in 2017 to 26.14% in 2018 and this is because of the increase in the
earnings which is made by the company. The other two ratios are also increasing and that is
because the net profit which is made by the company has increased (Qantas airways, 2017). The
revenue has raised and with that the profits of the company have also increased. This is good for
the company and it shows that the business will be able to maintain sustainability and that will
continue in the long run. There will be funds which will be used for the making of the further
investments which will earn more returns in addition to the current profits.
Liquidity ratios:
In the business, there are various liabilities which are to be met and for that the liquidity
is required to be managed. In that all of the liabilities which are there will be analyzed together
with the assets which are available to meet them (Paradi & Zhu, 2013). The company is required
to maintain the adequate level of the assets by which the obligations will be met on time and that
will be making the company efficient in dealing with the liabilities. The calculation of the ratios
in this respect is shown below:
Particulars Formula 2018 2017
Current ratio Current assets/Current
liabilities
0.49 0.44
Quick ratio Quick assets/Current
liabilities
0.44 0.39
The current ratios have been calculated and in that it is determined that the increase is
made from 0.44 to 0.49 in 2018. This shows that the liquidity is increasing but then also it is not
according to the standard ratio which is set at 2. The increase is also made in the quick ratio and
in that also the same situation is involved (Qantas airways, 2018). It is required by the company
that there shall be increase in the current assets which will be made and by that the liquidity of
the company will be improved and there will be adequate payments which will be made by the
company.
9
Conclusion
The report has covered the analysis of the Qantas airways and in that there is the
consideration of all the methods which are available for the same. The trend analysis is
performed and with that there is an upward trend which is identified. There is the consideration
of the sales and profits in that and in both of them an increase has been identified. The vertical
analysis is made and with that the proportion of all the elements is identified. The ratio
calculation is made and with that the profitability and liquidity are ascertained. The improvement
will be required in the liquidity and that has been identified for the company.
⊘ This is a preview!⊘
Do you want full access?
Subscribe today to unlock all pages.
Trusted by 1+ million students worldwide
10
References
Andrews, R. (2015). Vertical consolidation and financial sustainability: evidence from English
local government. Environment and Planning C: Government and Policy, 33(6), 1518-
1545.
DeFusco, R. A., McLeavey, D. W., Pinto, J. E., Runkle, D. E., & Anson, M. J.
(2015). Quantitative investment analysis. John Wiley & Sons.
Delen, D., Kuzey, C., & Uyar, A. (2013). Measuring firm performance using financial ratios: A
decision tree approach. Expert Systems with Applications, 40(10), 3970-3983.
Lahiri, N., & Narayanan, S. (2013). Vertical integration, innovation, and alliance portfolio size:
Implications for firm performance. Strategic Management Journal, 34(9), 1042-1064.
Paradi, J. C., & Zhu, H. (2013). A survey on bank branch efficiency and performance research
with data envelopment analysis. Omega, 41(1), 61-79.
Qantas airways. (2015). Annual report. Retrieved from:
https://investor.qantas.com/FormBuilder/_Resource/_module/doLLG5ufYkCyEPjF1tpgy
w/file/annual-reports/2015_qantas_annual_report.pdf
Qantas airways. (2016). Annual report. Retrieved from:
https://investor.qantas.com/FormBuilder/_Resource/_module/doLLG5ufYkCyEPjF1tpgy
w/file/annual-reports/2016AnnualReport.pdf
Qantas airways. (2017). Annual report. Retrieved from:
https://investor.qantas.com/FormBuilder/_Resource/_module/doLLG5ufYkCyEPjF1tpgy
w/file/annual-reports/2017AnnualReport.pdf
Qantas airways. (2018). Annual report. Retrieved from:
https://investor.qantas.com/FormBuilder/_Resource/_module/doLLG5ufYkCyEPjF1tpgy
w/file/annual-reports/2018-Annual-Report-ASX.pdf
Qantas airways. (2019). About us. Retrieved from: https://www.qantas.com/us/en/about-us.html
Paraphrase This Document
Need a fresh take? Get an instant paraphrase of this document with our AI Paraphraser
11
Appendix
Vertical analysis
Income statement
Particulars 2018 2018%
REVENUE AND OTHER INCOME
Net passenger revenue 14715 86.25%
Net freight revenue 862 5.05%
Other 1483 8.69%
Revenue and other income 17060 100.00%
EXPENDITURE
Manpower and staff related 4300 25.21%
Fuel 3232 18.94%
Aircraft operating variable 3596 21.08%
Depreciation and amortization 1528 8.96%
Non-cancellable aircraft operating lease rentals 272 1.59%
Share of net (profit)/loss of investments accounted for under the equity
method
-15 -0.09%
Other 2574 15.09%
Expenditure 15487 90.78%
Statutory profit before income tax expense and net finance costs 1573 9.22%
Finance income 48 0.28%
Finance costs -230 -1.35%
Net finance costs -182 -1.07%
Statutory profit before income tax expense 1391 8.15%
Income tax expense -411 -2.41%
Statutory profit for the year 980 5.74%
Balance sheet
Particulars 2018 2018%
CURRENT ASSETS
Cash and cash equivalents 1694 9.08%
Receivables 908 4.87%
Other financial assets 474 2.54%
Inventories 351 1.88%
Assets classified as held for sale 118 0.63%
Other 167 0.90%
Total current assets 3712 19.91%
NON-CURRENT ASSETS
Receivables 100 0.54%
Other financial assets 112 0.60%
12
Investments accounted for under the equity
method
226 1.21%
Property, plant and equipment 12851 68.92%
Intangible assets 1113 5.97%
Other 533 2.86%
Total non-current assets 14935 80.09%
Total assets 18647 100.00%
CURRENT LIABILITIES
Payables 2295 12.31%
Revenue received in advance 3939 21.12%
Interest-bearing liabilities 404 2.17%
Other financial liabilities 34 0.18%
Provisions 860 4.61%
Liabilities classified as held for sale 64 0.34%
Total current liabilities 7596 40.74%
NON-CURRENT LIABILITIES
Revenue received in advance 1446 7.75%
Interest-bearing liabilities 4344 23.30%
Other financial liabilities 25 0.13%
Provisions 367 1.97%
Deferred tax liabilities 910 4.88%
Total non-current liabilities 7092 38.03%
Total liabilities 14688 78.77%
EQUITY 0.00%
Issued capital 2508 13.45%
Treasury shares -115 -0.62%
Reserves 479 2.57%
Retained earnings 1084 5.81%
Equity attributable to the members of Qantas 3956 21.22%
Non-controlling interests 3 0.02%
Total equity 3959 21.23%
Total equity and liabilities 18647 100.00%
⊘ This is a preview!⊘
Do you want full access?
Subscribe today to unlock all pages.
Trusted by 1+ million students worldwide
1 out of 12
Related Documents


Your All-in-One AI-Powered Toolkit for Academic Success.
+13062052269
info@desklib.com
Available 24*7 on WhatsApp / Email
![[object Object]](/_next/static/media/star-bottom.7253800d.svg)
Unlock your academic potential
Copyright © 2020–2026 A2Z Services. All Rights Reserved. Developed and managed by ZUCOL.