HI5002 Finance: Analyzing Qantas Airways Financial Performance
VerifiedAdded on 2023/06/11
|18
|4053
|415
Case Study
AI Summary
This case study provides a comprehensive financial analysis of Qantas Airways, examining its ownership structure, governance, and financial performance from 2016 to 2018. It includes an analysis of key financial ratios depicting liquidity, leverage, asset utilization, profitability, and market performance. The study utilizes data from the ASX website to assess Qantas' share price movement against the All Ordinaries Index (AORD) and incorporates information from Reuters, including the company's beta and required rate of return. The analysis also considers Qantas' weighted average cost of capital (WACC) and debt ratio, providing insights into its financial stability and investment potential. The report concludes with a recommendation for investment in Qantas Airways, tailored for a wealthy investor.
Running head: MASTERS OF PROFESSIONAL ACCOUNTING
Masters of Professional Accounting
Name of the Student
Name of the University
Authors Note
Course ID
Masters of Professional Accounting
Name of the Student
Name of the University
Authors Note
Course ID
Paraphrase This Document
Need a fresh take? Get an instant paraphrase of this document with our AI Paraphraser
1MASTERS OF PROFESSIONAL ACCOUNTING
Table of Contents
Introduction................................................................................................................................3
1. Qantas Airways -Description of the business........................................................................3
2. Government structure and ownership of Qantas Airways.....................................................4
2i. List of substantial shareholders.........................................................................................4
2ii. List of significant members in the governance of Qantas................................................5
3. Computation of performance ratios for 2017 and 2016.........................................................7
Ratios Depicting Liquidity.....................................................................................................7
Ratios depicting leverage.......................................................................................................7
Ratios depicting utilisation of asset........................................................................................8
Ratios depicting profitability..................................................................................................8
Ratios depicting market performance....................................................................................9
4. Using of Information from ASX Website..............................................................................9
4i. Share price movement of Qantas Airways from 2016-2018 against All Ordinaries Index
................................................................................................................................................9
4ii. Report on comparison of stock price movement with AORD.......................................10
5. Financial/Business publications implying changes in share price of Qantas.......................11
6. Information collected from Reuters.....................................................................................12
6i. Beta of Qantas Airways......................................................................................................12
Based on the assessment of information of share price summary the beta value of Qantas is
0.77...........................................................................................................................................12
6ii. Required Rate of Return of Qantas Airways.................................................................12
6iii. Reason for Conservative Investment............................................................................13
7. WACC of Qantas.................................................................................................................14
7i. Computation of WACC..................................................................................................14
7ii. Implication of WACC on prospective investment.........................................................14
8. Debt Ratio............................................................................................................................14
8i. Interpretation of Debt Ratio................................................................................................14
8ii. Adjustment for during ratio...........................................................................................15
9.Dividend policy.....................................................................................................................15
10. Recommendation to the client............................................................................................15
Conclusion:..............................................................................................................................16
References................................................................................................................................17
2MASTERS OF PROFESSIONAL ACCOUNTING
Introduction
The present objectives of the study relate to assessment of financial performance of
Qantas Airways. Some of the important discussions of the various sections of the study will
relate to present ownership governance structure along with the identification of the main
executives in the board of directors. Some of the other evaluation of the study is based on the
depiction of fundamental ratios which will include the relevant discussions on the present
efficiency, liquidity and financial leverage position of the company. Along with these, the
study will also show stock performance and profitability. The next section of the study will
retrieve relevant information from an online source which will state about the monthly share
price movement during the last two years of the company. In addition to this, the movement
of the share price will be compared with “All Ordinaries Index”. The main excerpts of the
discussion will closely correlate the various factors such as positive or negative increase as
per the market index. It will also depict on the volatility of the share prices. Some of the other
sections of the study will include computation of rate of return with the use of CAPM,
thereby providing the main assertion of nature of investment which is to be made in Qantas
Airways. The latter part of the report will include important discussions on debt ratio of the
company thereby setting on the rational whether the management has taken any initiative
towards payment of borrowings or buying back of shares. The final section of the study has
recommended the company for investment purpose with the recommendation letter to the
client (Titman, Keown and Martin 2017).
1. Qantas Airways -Description of the business
Qantas Airways, established in 1920 operates is headquartered in Mascot. In Australia
and internationally, “Qantas Airways Ltd” is considered as one of the pioneering passenger
and cargo transportation services with a fleet of 303 aircrafts. Some of the most notable fleet
⊘ This is a preview!⊘
Do you want full access?
Subscribe today to unlock all pages.
Trusted by 1+ million students worldwide
3MASTERS OF PROFESSIONAL ACCOUNTING
of the company includes aircraft such as “Airbus A330-220, Airbus A330-300, Boeing 747-
400, Boeing 747-400ER and Boeing 787-9”. Some of the core activities of the airliner can be
depicted in terms of providing travel services, freight air services, catering and ground
handling services (Lau 2016). The company also offers various facilities to the frequent flyer
with their frequent flyer loyalty program. Some of the notable logistics services provided by
Qantas Airways has been depicted with interstate trucking services for the International air
freight and domestic industries. Qantas Airways is also responsible for providing various
types of courier services to the medium and small -sized companies and individuals with
varieties of baggage related services. The various types of subsidiaries of the airliner can be
recognised with “Jetconnect, Australia Asia Airlines, Impulse Airlines, Network Aviation
and Qantas Link”. The main focus cities include “Singapore Changi Airport”, “Darwin
International Airport” and “Los Angeles International Airport”. In addition to this, secondary
hubs of the company include airports such as Perth and Adelaide (Renz and Herman, R.D.
2016).
2. Government structure and ownership of Qantas Airways
2i. List of substantial shareholders
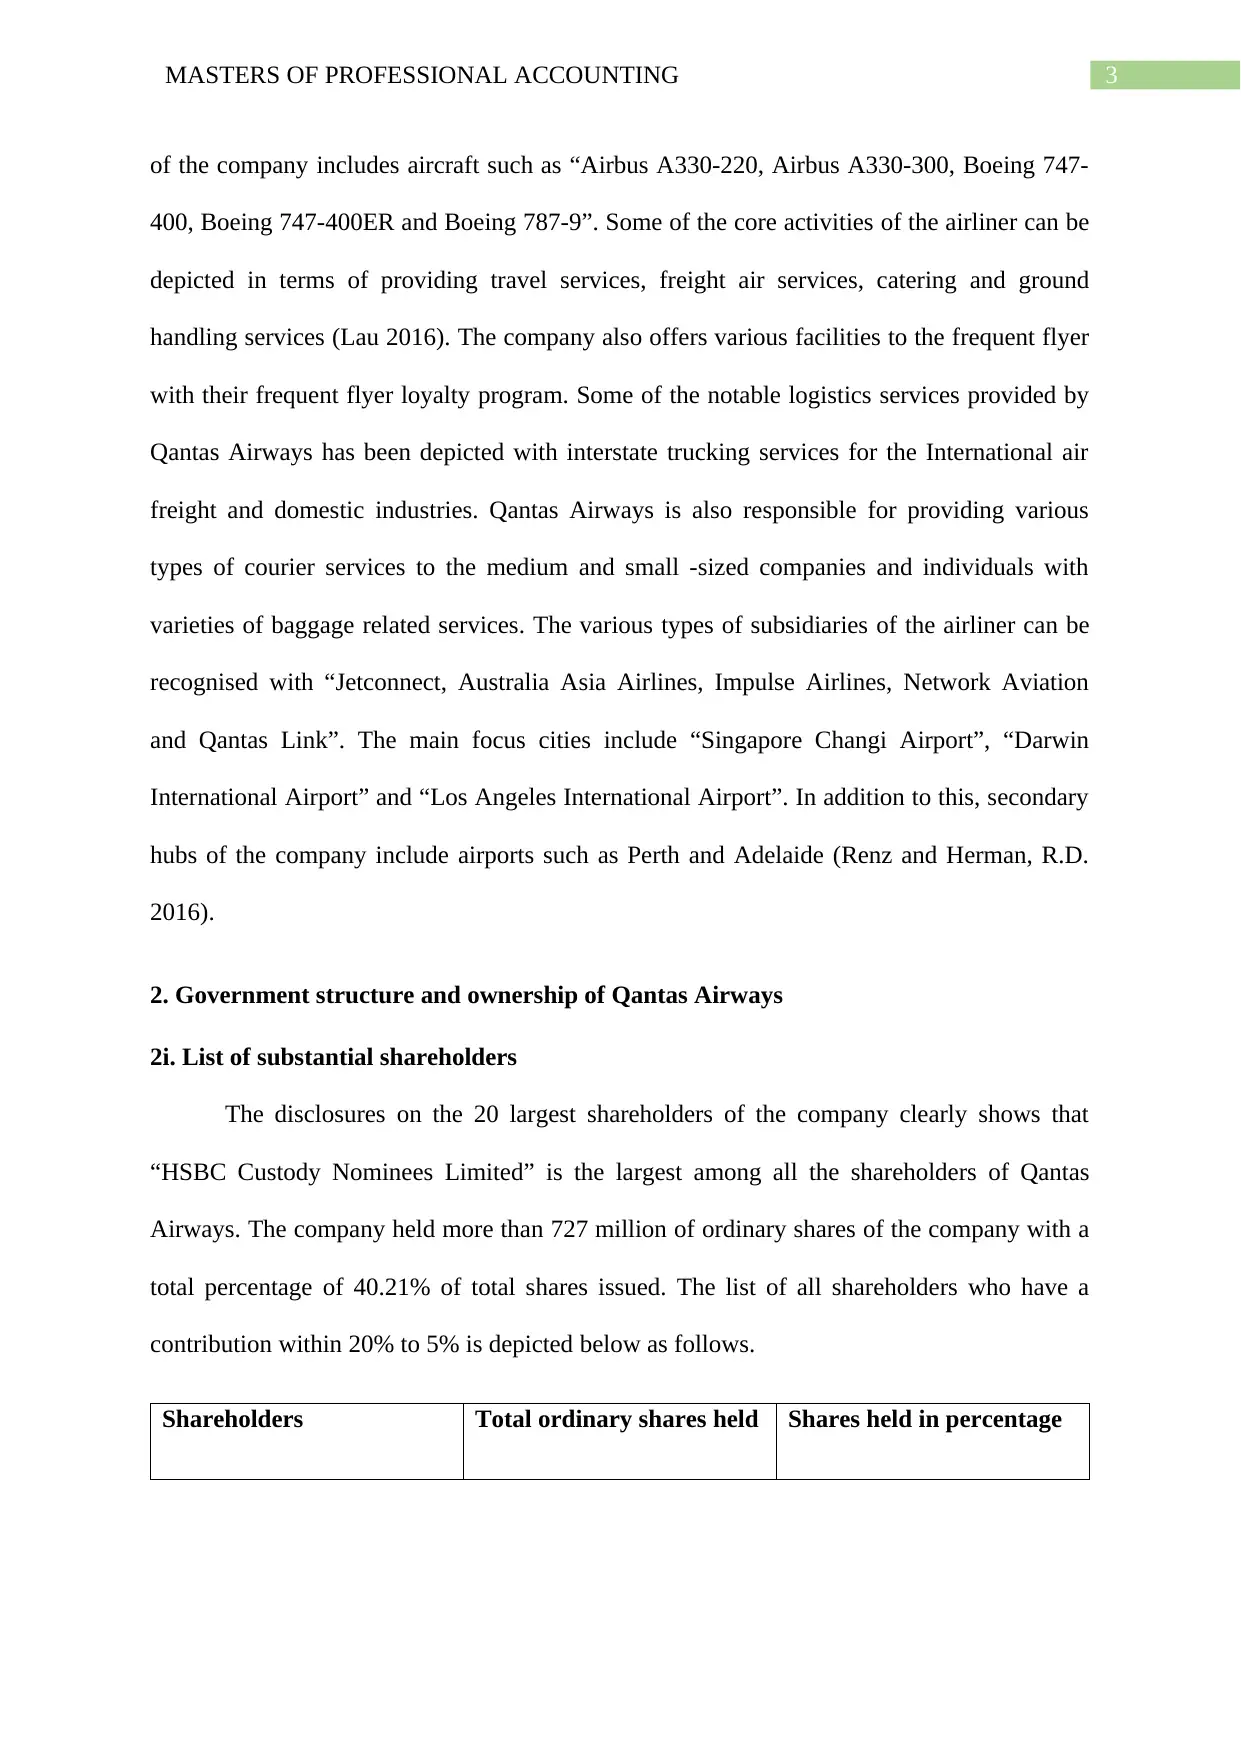
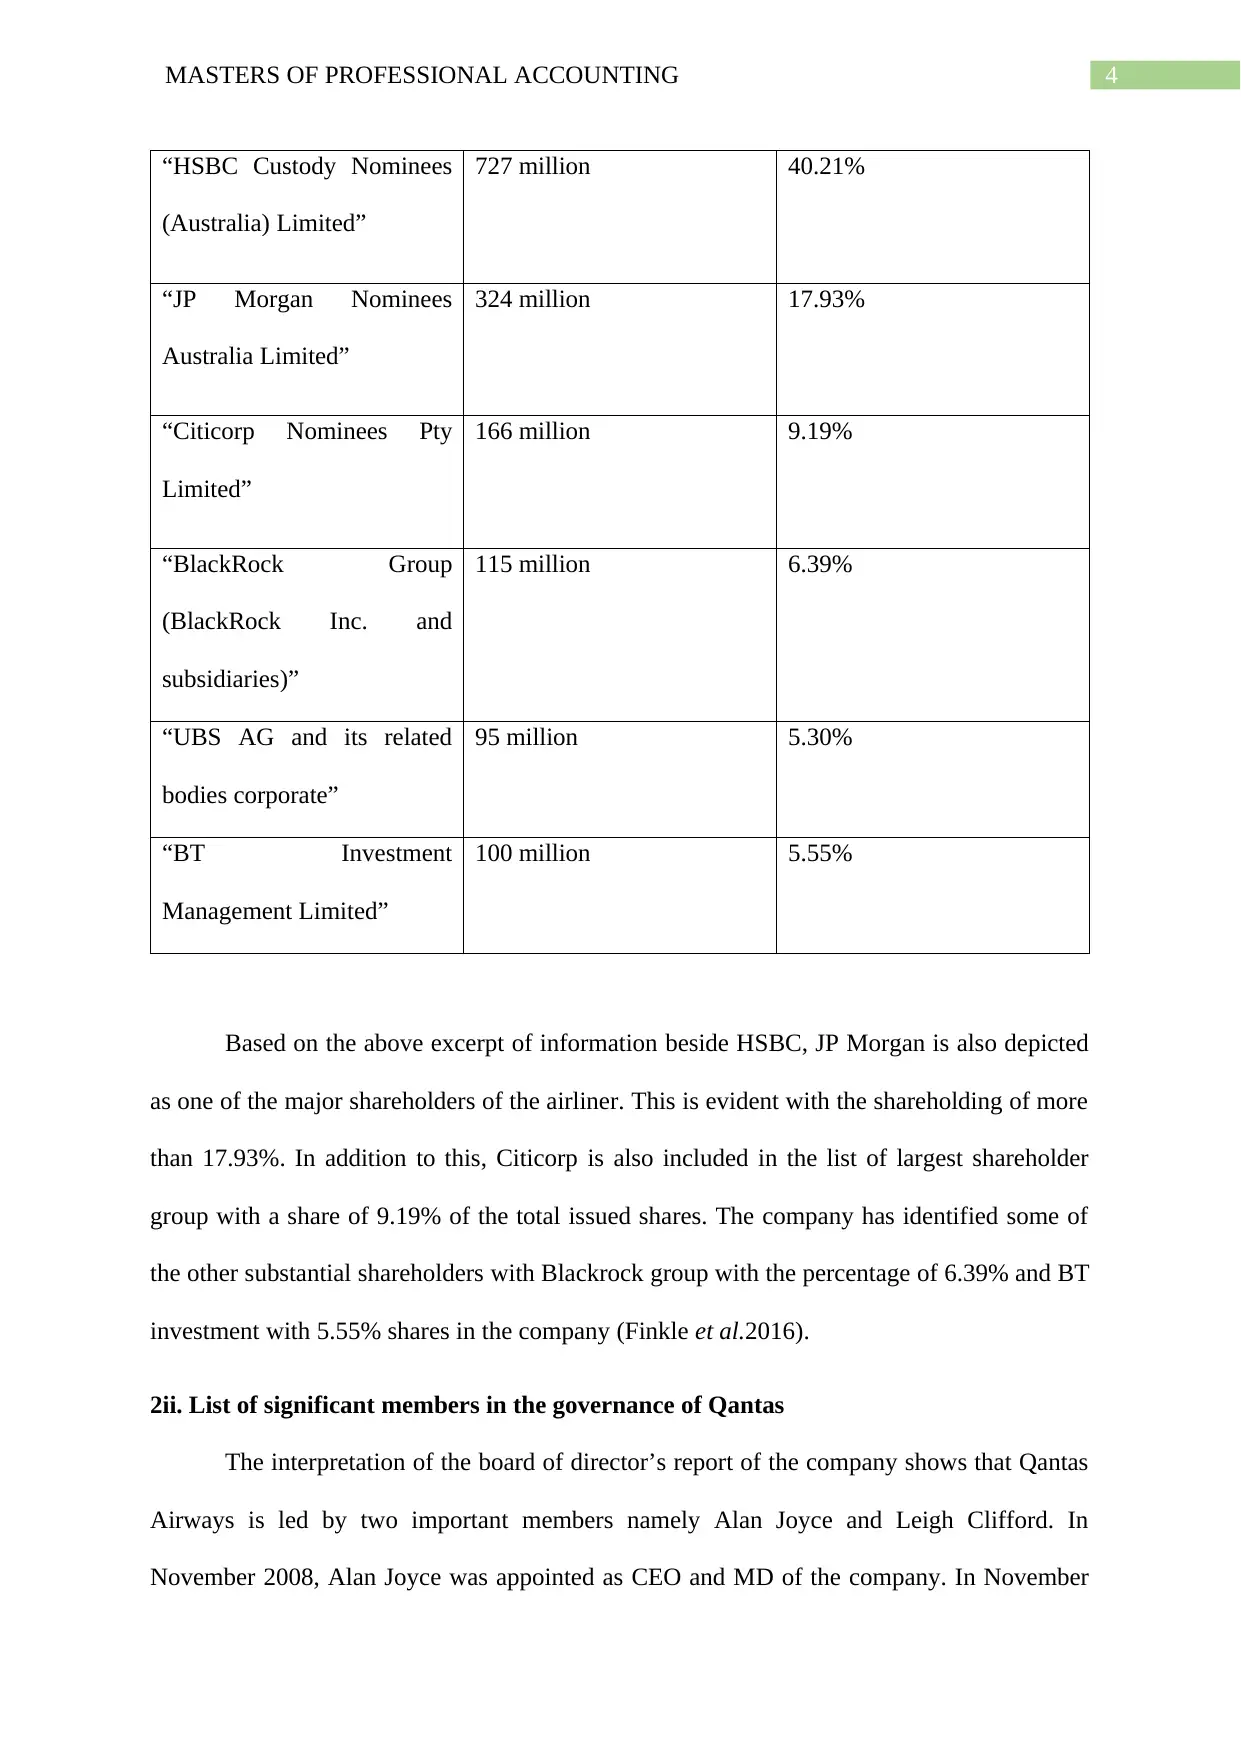
The disclosures on the 20 largest shareholders of the company clearly shows that
“HSBC Custody Nominees Limited” is the largest among all the shareholders of Qantas
Airways. The company held more than 727 million of ordinary shares of the company with a
total percentage of 40.21% of total shares issued. The list of all shareholders who have a
contribution within 20% to 5% is depicted below as follows.
Shareholders Total ordinary shares held Shares held in percentage
of the company includes aircraft such as “Airbus A330-220, Airbus A330-300, Boeing 747-
400, Boeing 747-400ER and Boeing 787-9”. Some of the core activities of the airliner can be
depicted in terms of providing travel services, freight air services, catering and ground
handling services (Lau 2016). The company also offers various facilities to the frequent flyer
with their frequent flyer loyalty program. Some of the notable logistics services provided by
Qantas Airways has been depicted with interstate trucking services for the International air
freight and domestic industries. Qantas Airways is also responsible for providing various
types of courier services to the medium and small -sized companies and individuals with
varieties of baggage related services. The various types of subsidiaries of the airliner can be
recognised with “Jetconnect, Australia Asia Airlines, Impulse Airlines, Network Aviation
and Qantas Link”. The main focus cities include “Singapore Changi Airport”, “Darwin
International Airport” and “Los Angeles International Airport”. In addition to this, secondary
hubs of the company include airports such as Perth and Adelaide (Renz and Herman, R.D.
2016).
2. Government structure and ownership of Qantas Airways
2i. List of substantial shareholders
The disclosures on the 20 largest shareholders of the company clearly shows that
“HSBC Custody Nominees Limited” is the largest among all the shareholders of Qantas
Airways. The company held more than 727 million of ordinary shares of the company with a
total percentage of 40.21% of total shares issued. The list of all shareholders who have a
contribution within 20% to 5% is depicted below as follows.
Shareholders Total ordinary shares held Shares held in percentage
Paraphrase This Document
Need a fresh take? Get an instant paraphrase of this document with our AI Paraphraser
4MASTERS OF PROFESSIONAL ACCOUNTING
“HSBC Custody Nominees
(Australia) Limited”
727 million 40.21%
“JP Morgan Nominees
Australia Limited”
324 million 17.93%
“Citicorp Nominees Pty
Limited”
166 million 9.19%
“BlackRock Group
(BlackRock Inc. and
subsidiaries)”
115 million 6.39%
“UBS AG and its related
bodies corporate”
95 million 5.30%
“BT Investment
Management Limited”
100 million 5.55%
Based on the above excerpt of information beside HSBC, JP Morgan is also depicted
as one of the major shareholders of the airliner. This is evident with the shareholding of more
than 17.93%. In addition to this, Citicorp is also included in the list of largest shareholder
group with a share of 9.19% of the total issued shares. The company has identified some of
the other substantial shareholders with Blackrock group with the percentage of 6.39% and BT
investment with 5.55% shares in the company (Finkle et al.2016).
2ii. List of significant members in the governance of Qantas
The interpretation of the board of director’s report of the company shows that Qantas
Airways is led by two important members namely Alan Joyce and Leigh Clifford. In
November 2008, Alan Joyce was appointed as CEO and MD of the company. In November
5MASTERS OF PROFESSIONAL ACCOUNTING
2007, Leigh Clifford was designated as the chairman and non-executive director
(Independent) of Qantas Airways. In addition to these members, some of the most notable
personalities can be further identified with the other “non-executive independent directors”
such as Maxine Brenner, Richard Goodmanson and Jacqueline Hey. It is further noted that
the other members of board of directors include Paul Rayner, William Meaney, Michael
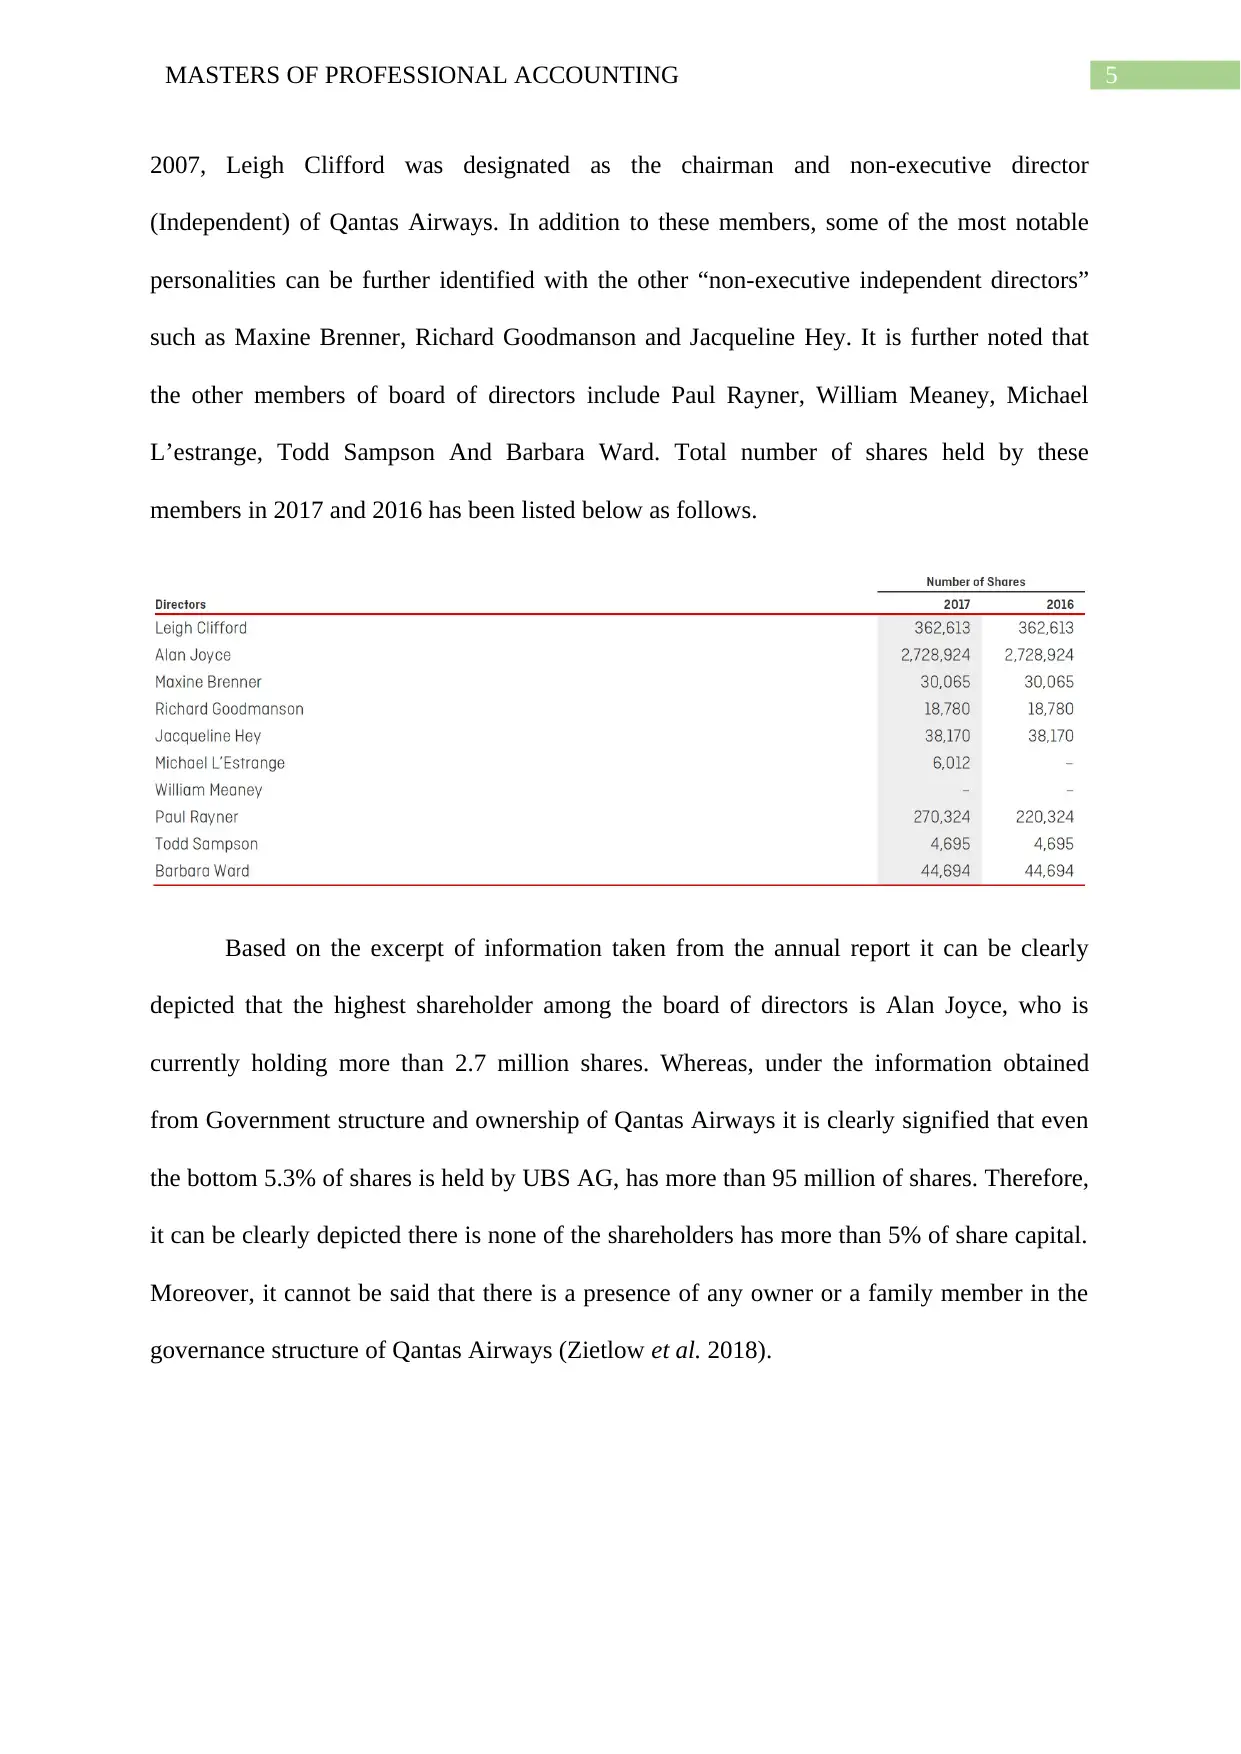
L’estrange, Todd Sampson And Barbara Ward. Total number of shares held by these
members in 2017 and 2016 has been listed below as follows.
Based on the excerpt of information taken from the annual report it can be clearly
depicted that the highest shareholder among the board of directors is Alan Joyce, who is
currently holding more than 2.7 million shares. Whereas, under the information obtained
from Government structure and ownership of Qantas Airways it is clearly signified that even
the bottom 5.3% of shares is held by UBS AG, has more than 95 million of shares. Therefore,
it can be clearly depicted there is none of the shareholders has more than 5% of share capital.
Moreover, it cannot be said that there is a presence of any owner or a family member in the
governance structure of Qantas Airways (Zietlow et al. 2018).
2007, Leigh Clifford was designated as the chairman and non-executive director
(Independent) of Qantas Airways. In addition to these members, some of the most notable
personalities can be further identified with the other “non-executive independent directors”
such as Maxine Brenner, Richard Goodmanson and Jacqueline Hey. It is further noted that
the other members of board of directors include Paul Rayner, William Meaney, Michael
L’estrange, Todd Sampson And Barbara Ward. Total number of shares held by these
members in 2017 and 2016 has been listed below as follows.
Based on the excerpt of information taken from the annual report it can be clearly
depicted that the highest shareholder among the board of directors is Alan Joyce, who is
currently holding more than 2.7 million shares. Whereas, under the information obtained
from Government structure and ownership of Qantas Airways it is clearly signified that even
the bottom 5.3% of shares is held by UBS AG, has more than 95 million of shares. Therefore,
it can be clearly depicted there is none of the shareholders has more than 5% of share capital.
Moreover, it cannot be said that there is a presence of any owner or a family member in the
governance structure of Qantas Airways (Zietlow et al. 2018).
⊘ This is a preview!⊘
Do you want full access?
Subscribe today to unlock all pages.
Trusted by 1+ million students worldwide
6MASTERS OF PROFESSIONAL ACCOUNTING
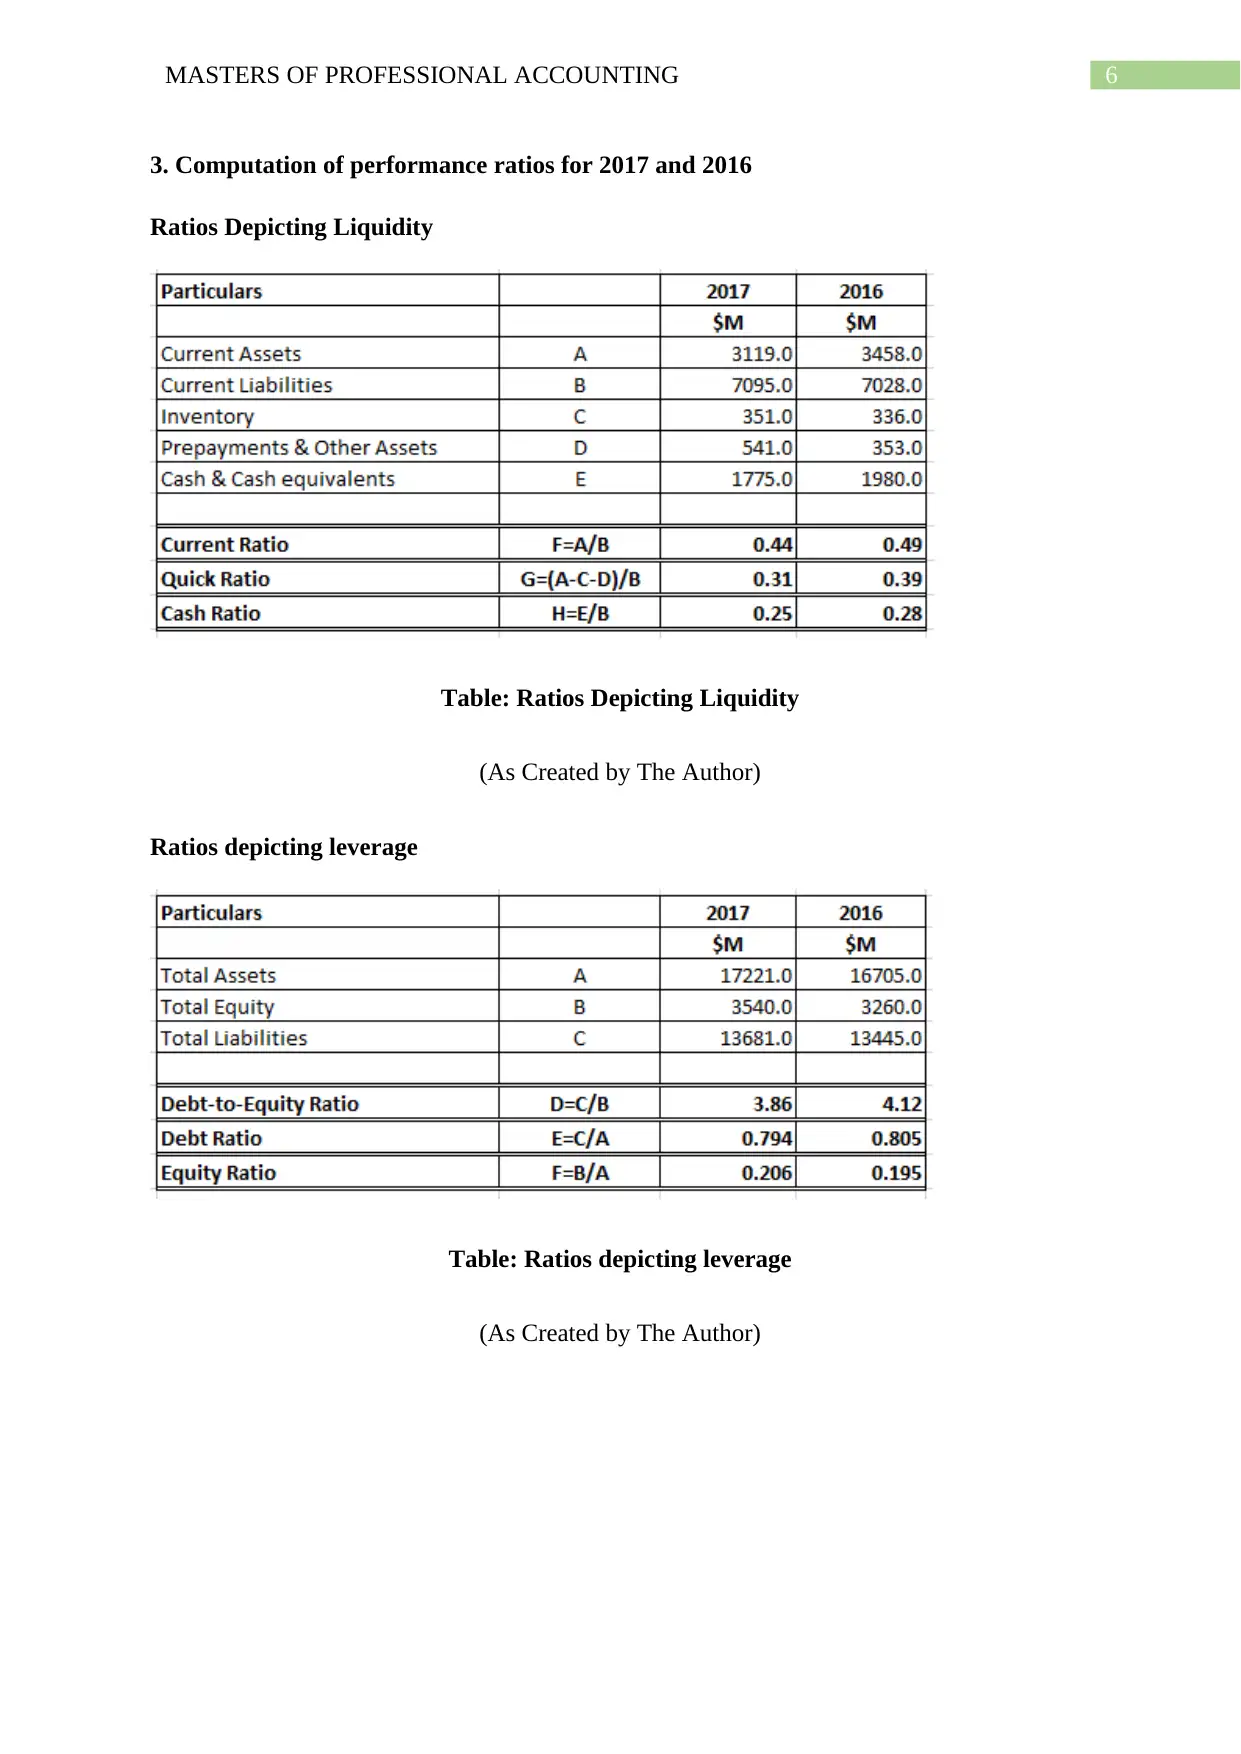
3. Computation of performance ratios for 2017 and 2016
Ratios Depicting Liquidity
Table: Ratios Depicting Liquidity
(As Created by The Author)
Ratios depicting leverage
Table: Ratios depicting leverage
(As Created by The Author)
3. Computation of performance ratios for 2017 and 2016
Ratios Depicting Liquidity
Table: Ratios Depicting Liquidity
(As Created by The Author)
Ratios depicting leverage
Table: Ratios depicting leverage
(As Created by The Author)
Paraphrase This Document
Need a fresh take? Get an instant paraphrase of this document with our AI Paraphraser
7MASTERS OF PROFESSIONAL ACCOUNTING
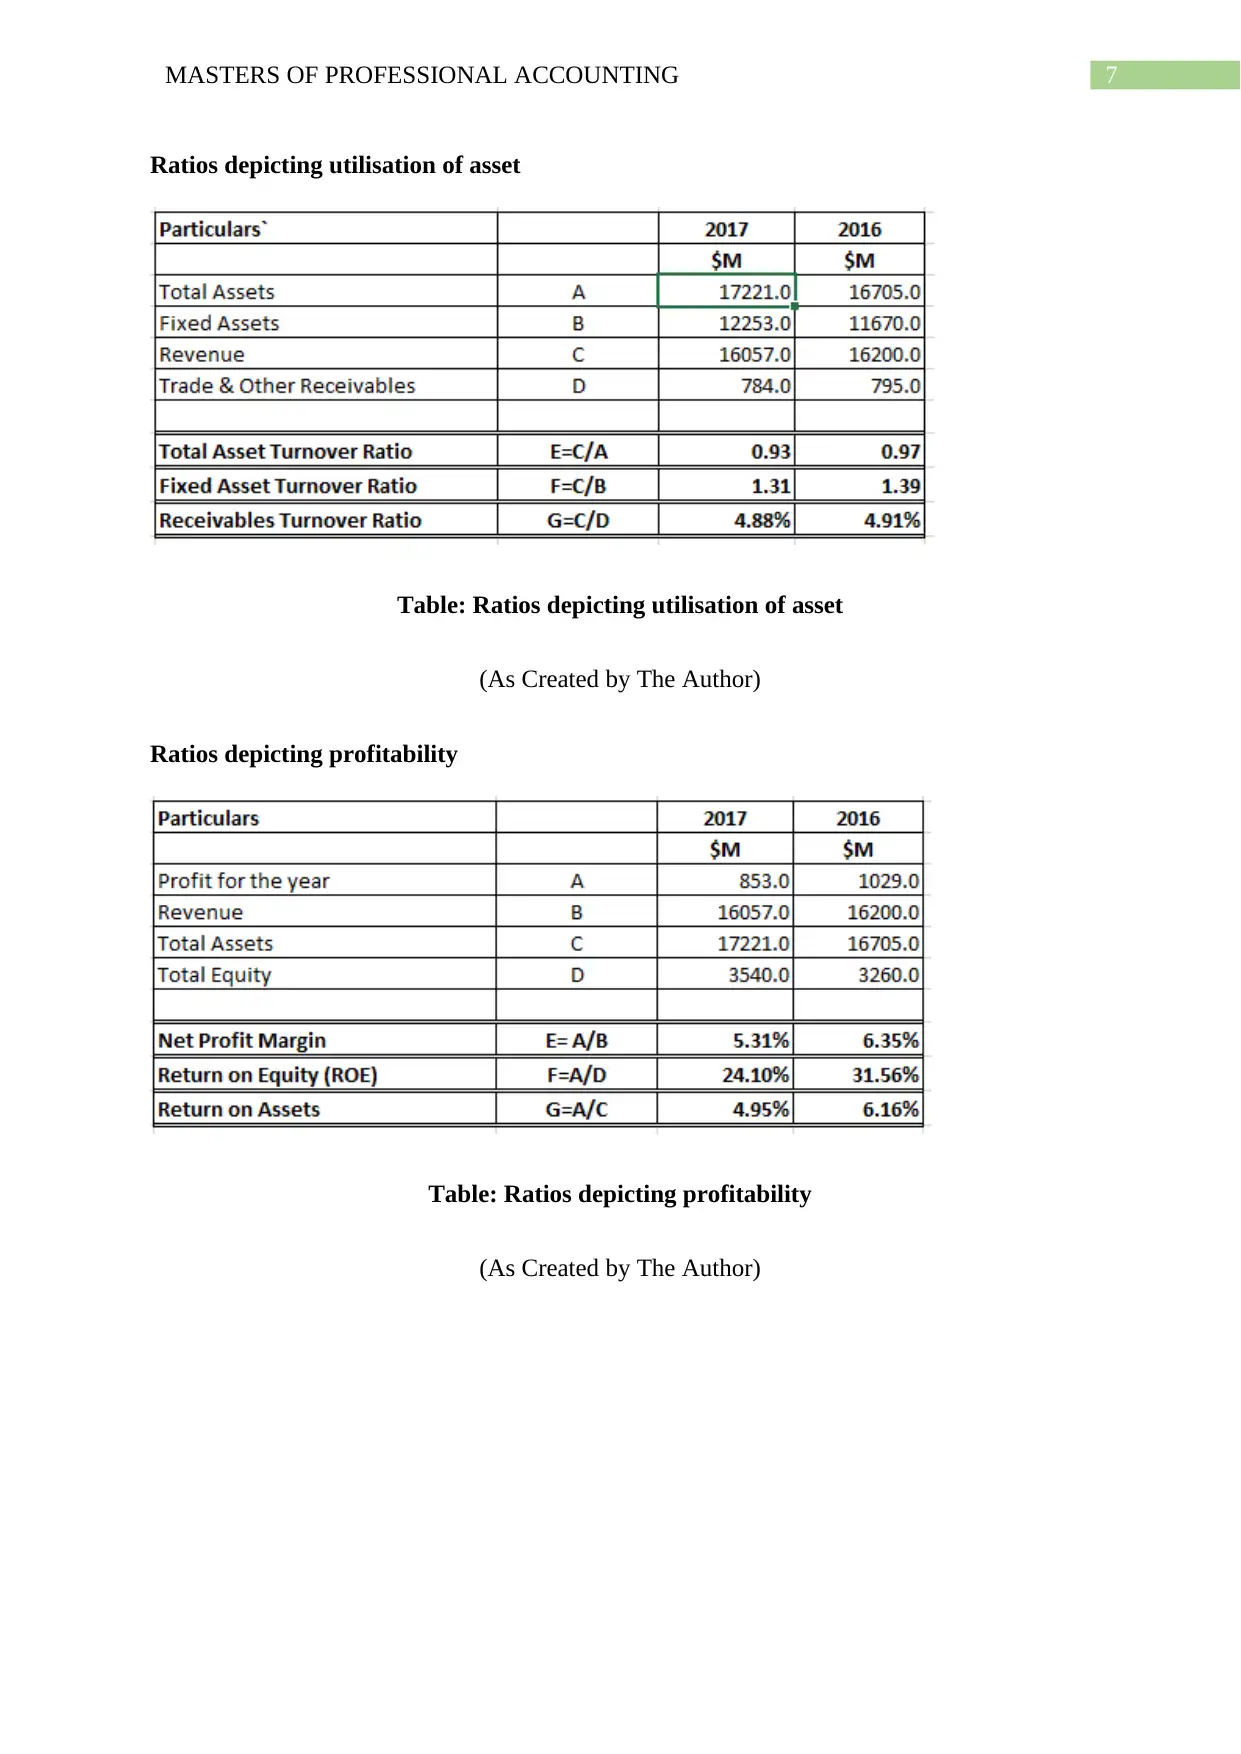
Ratios depicting utilisation of asset
Table: Ratios depicting utilisation of asset
(As Created by The Author)
Ratios depicting profitability
Table: Ratios depicting profitability
(As Created by The Author)
Ratios depicting utilisation of asset
Table: Ratios depicting utilisation of asset
(As Created by The Author)
Ratios depicting profitability
Table: Ratios depicting profitability
(As Created by The Author)
8MASTERS OF PROFESSIONAL ACCOUNTING
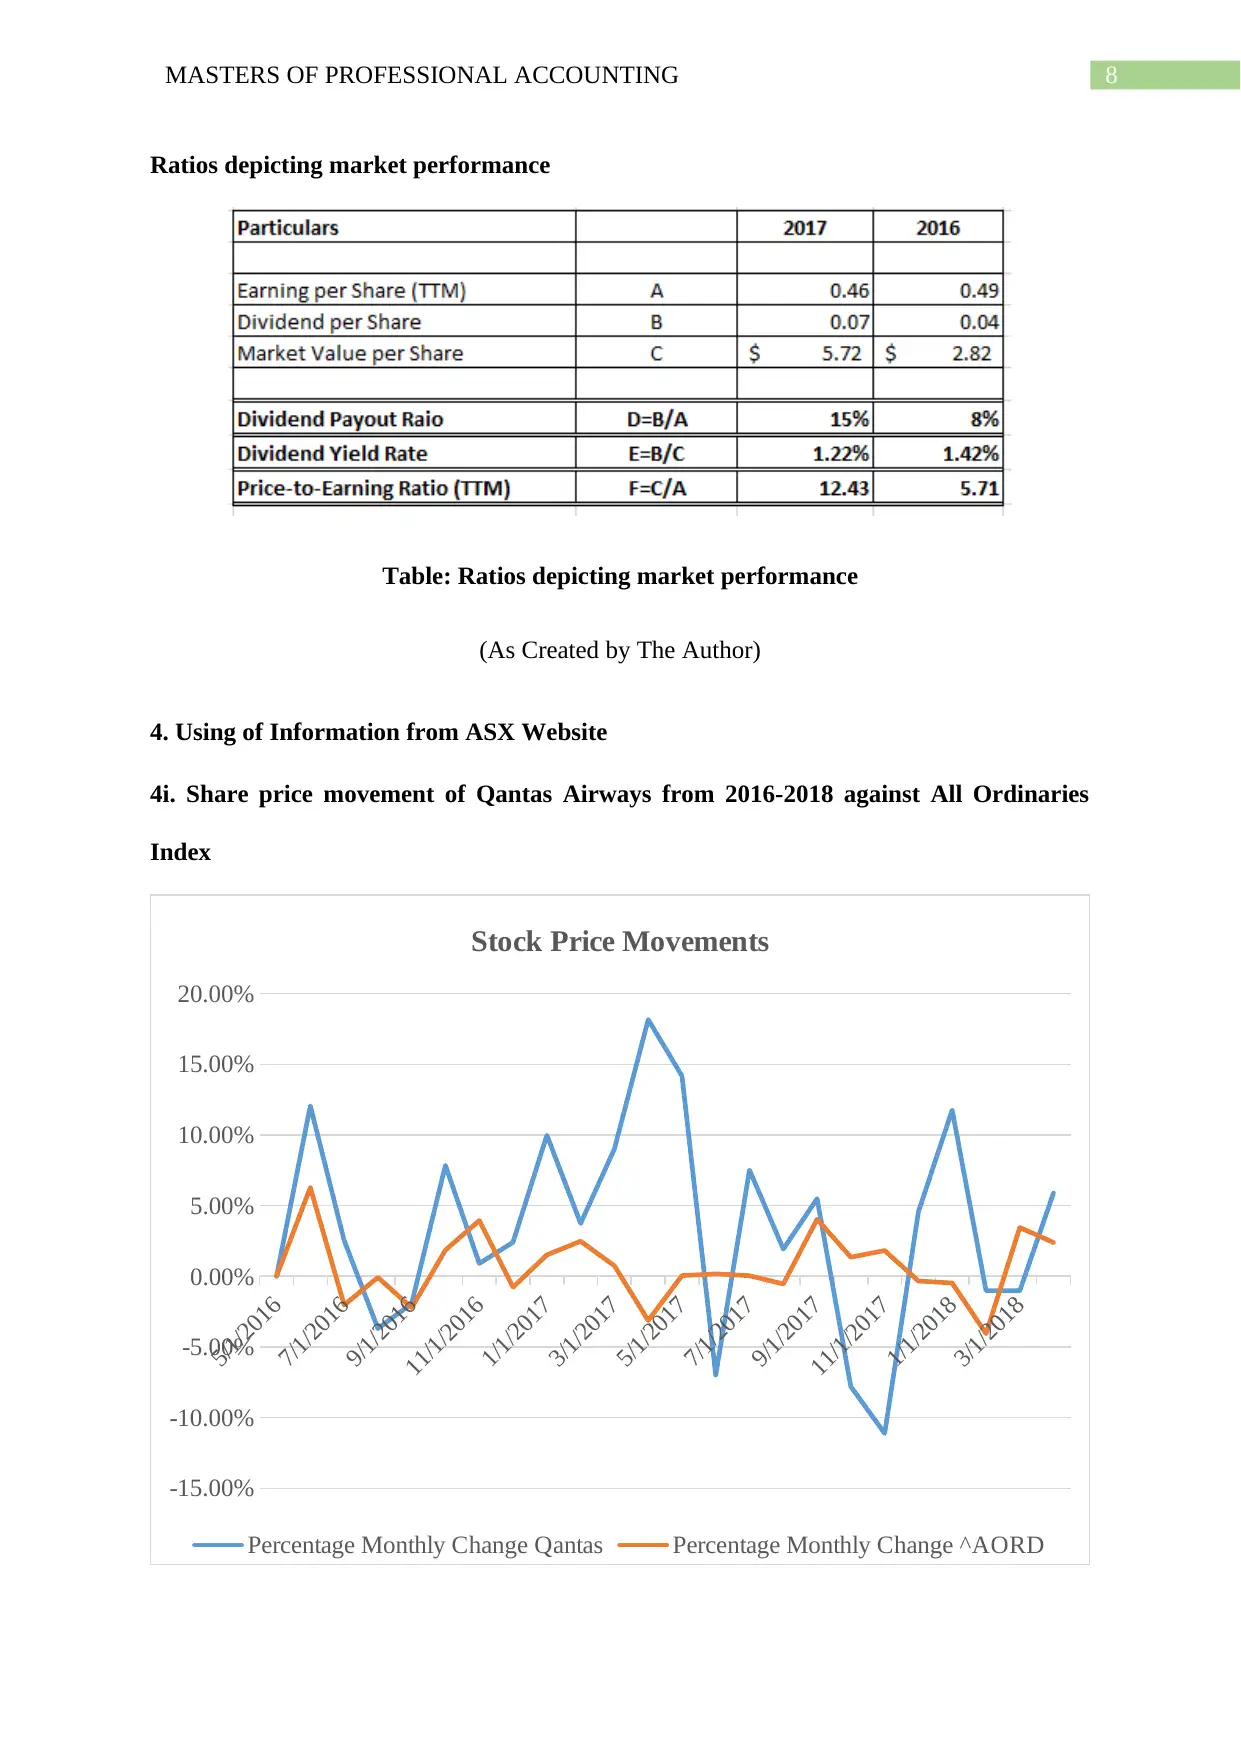
Ratios depicting market performance
Table: Ratios depicting market performance
(As Created by The Author)
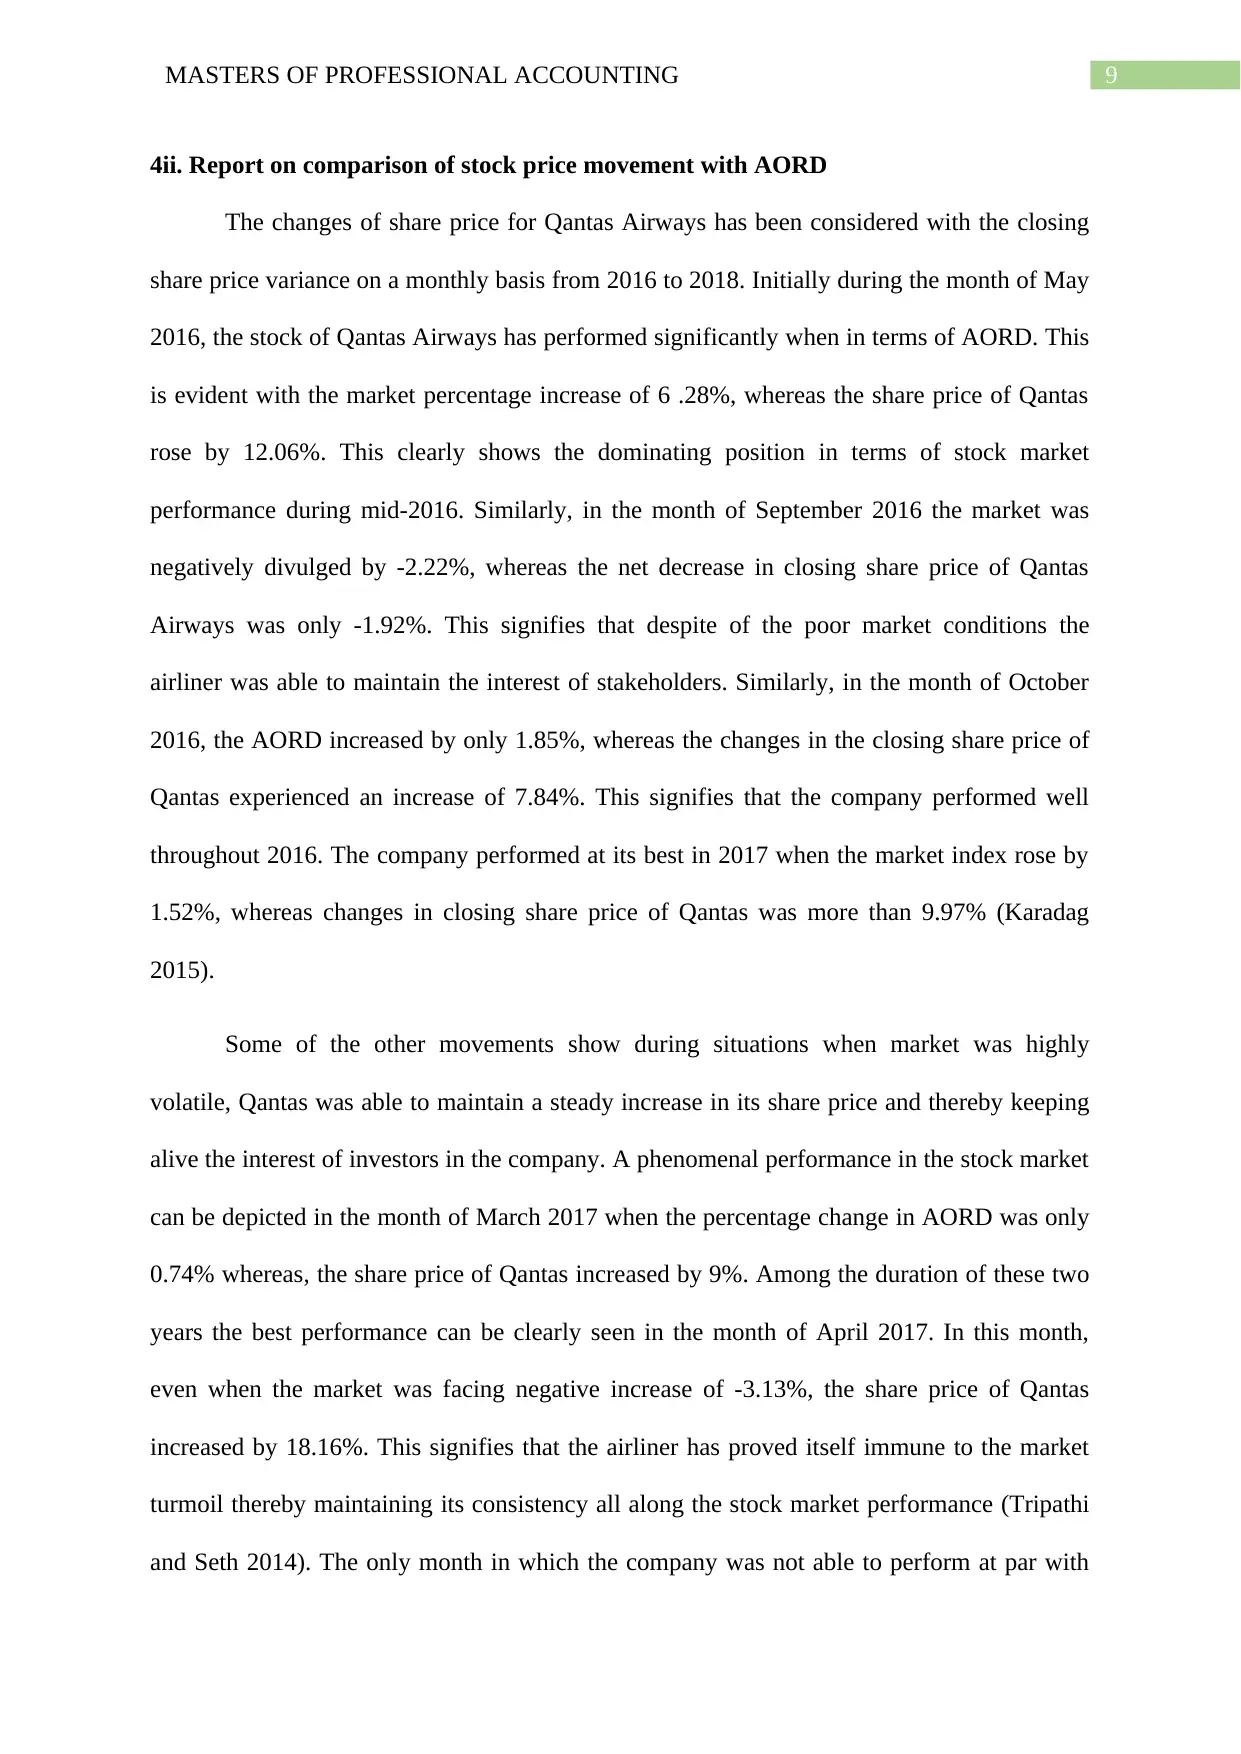
4. Using of Information from ASX Website
4i. Share price movement of Qantas Airways from 2016-2018 against All Ordinaries
Index
5/1/2016
7/1/2016
9/1/2016
11/1/2016
1/1/2017
3/1/2017
5/1/2017
7/1/2017
9/1/2017
11/1/2017
1/1/2018
3/1/2018
-15.00%
-10.00%
-5.00%
0.00%
5.00%
10.00%
15.00%
20.00%
Stock Price Movements
Percentage Monthly Change Qantas Percentage Monthly Change ^AORD
Ratios depicting market performance
Table: Ratios depicting market performance
(As Created by The Author)
4. Using of Information from ASX Website
4i. Share price movement of Qantas Airways from 2016-2018 against All Ordinaries
Index
5/1/2016
7/1/2016
9/1/2016
11/1/2016
1/1/2017
3/1/2017
5/1/2017
7/1/2017
9/1/2017
11/1/2017
1/1/2018
3/1/2018
-15.00%
-10.00%
-5.00%
0.00%
5.00%
10.00%
15.00%
20.00%
Stock Price Movements
Percentage Monthly Change Qantas Percentage Monthly Change ^AORD
⊘ This is a preview!⊘
Do you want full access?
Subscribe today to unlock all pages.
Trusted by 1+ million students worldwide
9MASTERS OF PROFESSIONAL ACCOUNTING
4ii. Report on comparison of stock price movement with AORD
The changes of share price for Qantas Airways has been considered with the closing
share price variance on a monthly basis from 2016 to 2018. Initially during the month of May
2016, the stock of Qantas Airways has performed significantly when in terms of AORD. This
is evident with the market percentage increase of 6 .28%, whereas the share price of Qantas
rose by 12.06%. This clearly shows the dominating position in terms of stock market
performance during mid-2016. Similarly, in the month of September 2016 the market was
negatively divulged by -2.22%, whereas the net decrease in closing share price of Qantas
Airways was only -1.92%. This signifies that despite of the poor market conditions the
airliner was able to maintain the interest of stakeholders. Similarly, in the month of October
2016, the AORD increased by only 1.85%, whereas the changes in the closing share price of
Qantas experienced an increase of 7.84%. This signifies that the company performed well
throughout 2016. The company performed at its best in 2017 when the market index rose by
1.52%, whereas changes in closing share price of Qantas was more than 9.97% (Karadag
2015).
Some of the other movements show during situations when market was highly
volatile, Qantas was able to maintain a steady increase in its share price and thereby keeping
alive the interest of investors in the company. A phenomenal performance in the stock market
can be depicted in the month of March 2017 when the percentage change in AORD was only
0.74% whereas, the share price of Qantas increased by 9%. Among the duration of these two
years the best performance can be clearly seen in the month of April 2017. In this month,
even when the market was facing negative increase of -3.13%, the share price of Qantas
increased by 18.16%. This signifies that the airliner has proved itself immune to the market
turmoil thereby maintaining its consistency all along the stock market performance (Tripathi
and Seth 2014). The only month in which the company was not able to perform at par with
Paraphrase This Document
Need a fresh take? Get an instant paraphrase of this document with our AI Paraphraser
10MASTERS OF PROFESSIONAL ACCOUNTING
AORD was in July 2017. In this month, despite of a sluggish performance of the market
index with 0.17%, there was a decrease of -6.99 in the share price of Qantas Airways. By the
end of 2017, the company showed less volatility with the market and steadiness with AORD
(Burger et al. 2015).
The main interpretation of stock market performance in the end of 2017 was not
impressive like the other months. In the month of October 2017, there was a positive change
in the market with an increase of 1.35%. Despite of this, the share price of Qantas dipped
down by -7.80. This shows that the company was not able to maintain a sufficient level of
interest among the shareholders in the end of 2017 (Mbulawa et al. 2015). In the month of
November 2017, the stock market performance condition of the company further degraded. In
this month, there was a positive change in AORD with 1.82%, whereas the company
experienced its lowest performance with -11.11%. This signifies that it was not able to cope
up with the market index and significantly lost interest of the investors. The performance of
the company again started improving from December 2017 (Le and Chang 2015).
Based on the depictions of stock market performance 2018, both Qantas and AORD
has lacked in various ways. Although, the company performed quite well in the initial month
of January 2018 with 11.76% increase, in the subsequent month the percentage change of
closing share price reduced down to -1.02% in February 2018 and -1.03% in March 2018.
However, in the month of April 2018, the market performance was 2.38, whereas the
company performed significantly well with 5.89% of positive increase in closing share price.
5. Financial/Business publications implying changes in share price of Qantas
Due to the fact that companies stock market performance was significantly well
during 2016 and 2017 there have been no major changes in the focus of the company.
However, some of the external factors affecting the share price of Qantas has been seen with
11MASTERS OF PROFESSIONAL ACCOUNTING
changes in oil price, competition, geopolitical risk and economic factors. It has been seen that
during the past couple of years due to decrease in the oil price has provided continued support
to the airliner for increased profit growth. This has led to such a good performance of the
company in the stock market. In addition to this, the airlines have experienced a significant
boom from the international tourism industry. This is particularly evident in the China where
the inbound tourism has grown to a considerable amount. It is considered as a major
economic factor which have positively influenced the share price of Qantas Airways (Motley
Fool Australia 2016).
It is important to note that some of the other factors implying changes in share price
and be clearly depicted with other economic conditions such as lower depreciation charges.
With lower depreciation charges in 2016, the airliner recorded a $2.6 billion write-down on
the amount of fleet. In addition to this, in 2016 that impairment changes as per the Qantas
Sale Act allowed the company to segregated international division into a new corporate
entity. This allowed the airliner to assign realistic values of expenses to the international
aircraft. This reduction of costs due to the depreciation assisted the company in maintaining a
steady growth in its share prices. Moreover, by the end of thousand 2009 the Australian
airline industry experienced a lower competition which allowed Qantas to maintain a steady
growth in terms of profit (Freed 2015).
6. Information collected from Reuters
6i. Beta of Qantas Airways
Based on the assessment of information of share price summary the beta value of
Qantas is 0.77.
6ii. Required Rate of Return of Qantas Airways
The required rate of return of the airliner has been computed as 5.54%
⊘ This is a preview!⊘
Do you want full access?
Subscribe today to unlock all pages.
Trusted by 1+ million students worldwide
1 out of 18
Related Documents


Your All-in-One AI-Powered Toolkit for Academic Success.
+13062052269
info@desklib.com
Available 24*7 on WhatsApp / Email
![[object Object]](/_next/static/media/star-bottom.7253800d.svg)
Unlock your academic potential
Copyright © 2020–2026 A2Z Services. All Rights Reserved. Developed and managed by ZUCOL.