Qantas Airways Financial Analysis Report - Business Finance HC2091
VerifiedAdded on 2023/03/23
|15
|3845
|30
Report
AI Summary
This report presents a comprehensive financial analysis of Qantas Airways, evaluating its financial performance through various metrics. It includes an examination of operating efficiency and profitability ratios, comparing share price movements with graphical representations, calculating the cost of equity, and identifying the capital structure. The analysis reveals insights into Qantas's asset return, equity return, and net profit margin, along with receivable days average and turnover of working capital and total assets. The report also delves into the volatility of Qantas's share prices and the factors influencing these movements. Furthermore, it calculates the cost of equity and the weighted average cost of capital (WACC) to assess the company's financial health and attractiveness to investors, ultimately providing a consulting report with recommendations based on the findings.
BUSINESS FINANCE
1
1
Paraphrase This Document
Need a fresh take? Get an instant paraphrase of this document with our AI Paraphraser
Executive Summary
This report highlights the factor and importance of business furnace. The report aims to evaluate
all of the financial categories available to analyze the flow of resources along with income of a
business enterprise. The company has its shares listed under Australian Stock Exchange, which
indicates that the market value of the company is quite strong and impressive. The resultant
values of the various financial ratio calculations prove the potentiality of the company for
growth. Various financial ratios such as profitability ratio, operating efficiency ratio, debt-equity
ratio, has been calculated to determine the worth of the company for the investors. The various
financial evaluations are performed to create a detailed report in order to guide an aspiring
investor to invest in Qantas and earn profit from it in the near future.
2
Table of Contents
I Introduction...................................................................................................................................4
II Financial Analysis of the Company.............................................................................................4
2.1. Company’s Description.........................................................................................................4
2.2 Calculation and evaluation of Operating efficiency ratios and profitability ratios of Qantas
Airways........................................................................................................................................4
2.3 Comparison and analysis of share price movements with graphical representations............7
2.4 Calculating cost of equity......................................................................................................9
2.5 Identifying capital structure.................................................................................................10
2.6. Consulting Report...............................................................................................................11
1. Title....................................................................................................................................11
2. Introduction........................................................................................................................11
3. Financial position and performance...................................................................................12
4. Conclusion..........................................................................................................................12
5. Recommendation................................................................................................................13
IV. Conclusion...............................................................................................................................13
Reference list.................................................................................................................................14
3
⊘ This is a preview!⊘
Do you want full access?
Subscribe today to unlock all pages.
Trusted by 1+ million students worldwide
I Introduction
Every business irrespective of its size and stature needs a credible access to a source of capital in
order to keep the business running. Multiple obligations, mostly short term in nature are met by
infusions of capital from various sources. There are various forms of financing and a diverse
quantifiable amount of options available when peeking at the types of financing. Debt and equity
financing are a couple of the most commonly used financing types. Mezzanine capital is another
form of financing that combines the best possible features of debt as well as equity financing.
This report would perform the financial analysis of Qantas airways one of the most commonly
used airway travel option in Australia. Qantas is the largest airline in Australia in when evaluated
in terms of the size of the fleet. Various financial factors such as movement of the share price
along with the ratios of operating efficiency and the capital structure of the organization would
be critically evaluated throughout the report.
II Financial Analysis of the Company
2.1. Company’s Description
Qantas airways have the largest fleet size compared to any other Australian airlines, with a total
fleet size of 131. There are 8 subsidiaries of the organization, and the airways travel to 85
destinations both domestically and internationally. Its headquarters are in Sydney Australia and it
employees 26,150 employees. The fiscal year of 2018 for Qantas was financially blessed as the
company made a net profit of $1.6 billion from the previous year, before calculation of tax. This
profit margin is the highest in the history of the airlines. It reported a $1.39 billion before tax
statutory profit with a statutory earning of 56 cents per share. The operating cash flow was
estimated at a staggering worth of $3.41 billion. $1 billion was paid back to various shareholders
in the form of buy backs that were on market share and in the form of dividends. The total free
flow of cash was estimated at $1.44 billion, that is $1.1 billion greater than 2017. The total
expenditure on capital had increased from $1.5 billion in 2017 to $1.9 billion in 2018. The total
passengers that they had carried in 2018 was estimated at 55,273, in 2017 it was 53,659. The
overall business performance of Qantas was positively deviating from 2017 performance by a
wide margin.
2.2 Calculation and evaluation of Operating efficiency ratios and profitability ratios of
Qantas Airways
Financial ratios of Qantas Airlines
4
Paraphrase This Document
Need a fresh take? Get an instant paraphrase of this document with our AI Paraphraser
Profitability ratios 2018 ($M) 2017 ($M)
Asset return (ROA)
Net income / Total assets
Net income 1,465 1,033
Total assets 18,647 17,221
Asset return (ROA) 0.08 0.06
Equity return (ROE)
Net income / Total equity
Net income 1,465 1,033
Total equity 3,959 3,540
Equity return (ROE) 0.37004294 0.29180791
Margin of net profit
Net profit/Sales revenue
Sales revenue 17,060 16,057
Net profit 1,465 1,033
Ratio of margin of net profit 0.09 0.06
Percentage 8.587338804 6.433331257
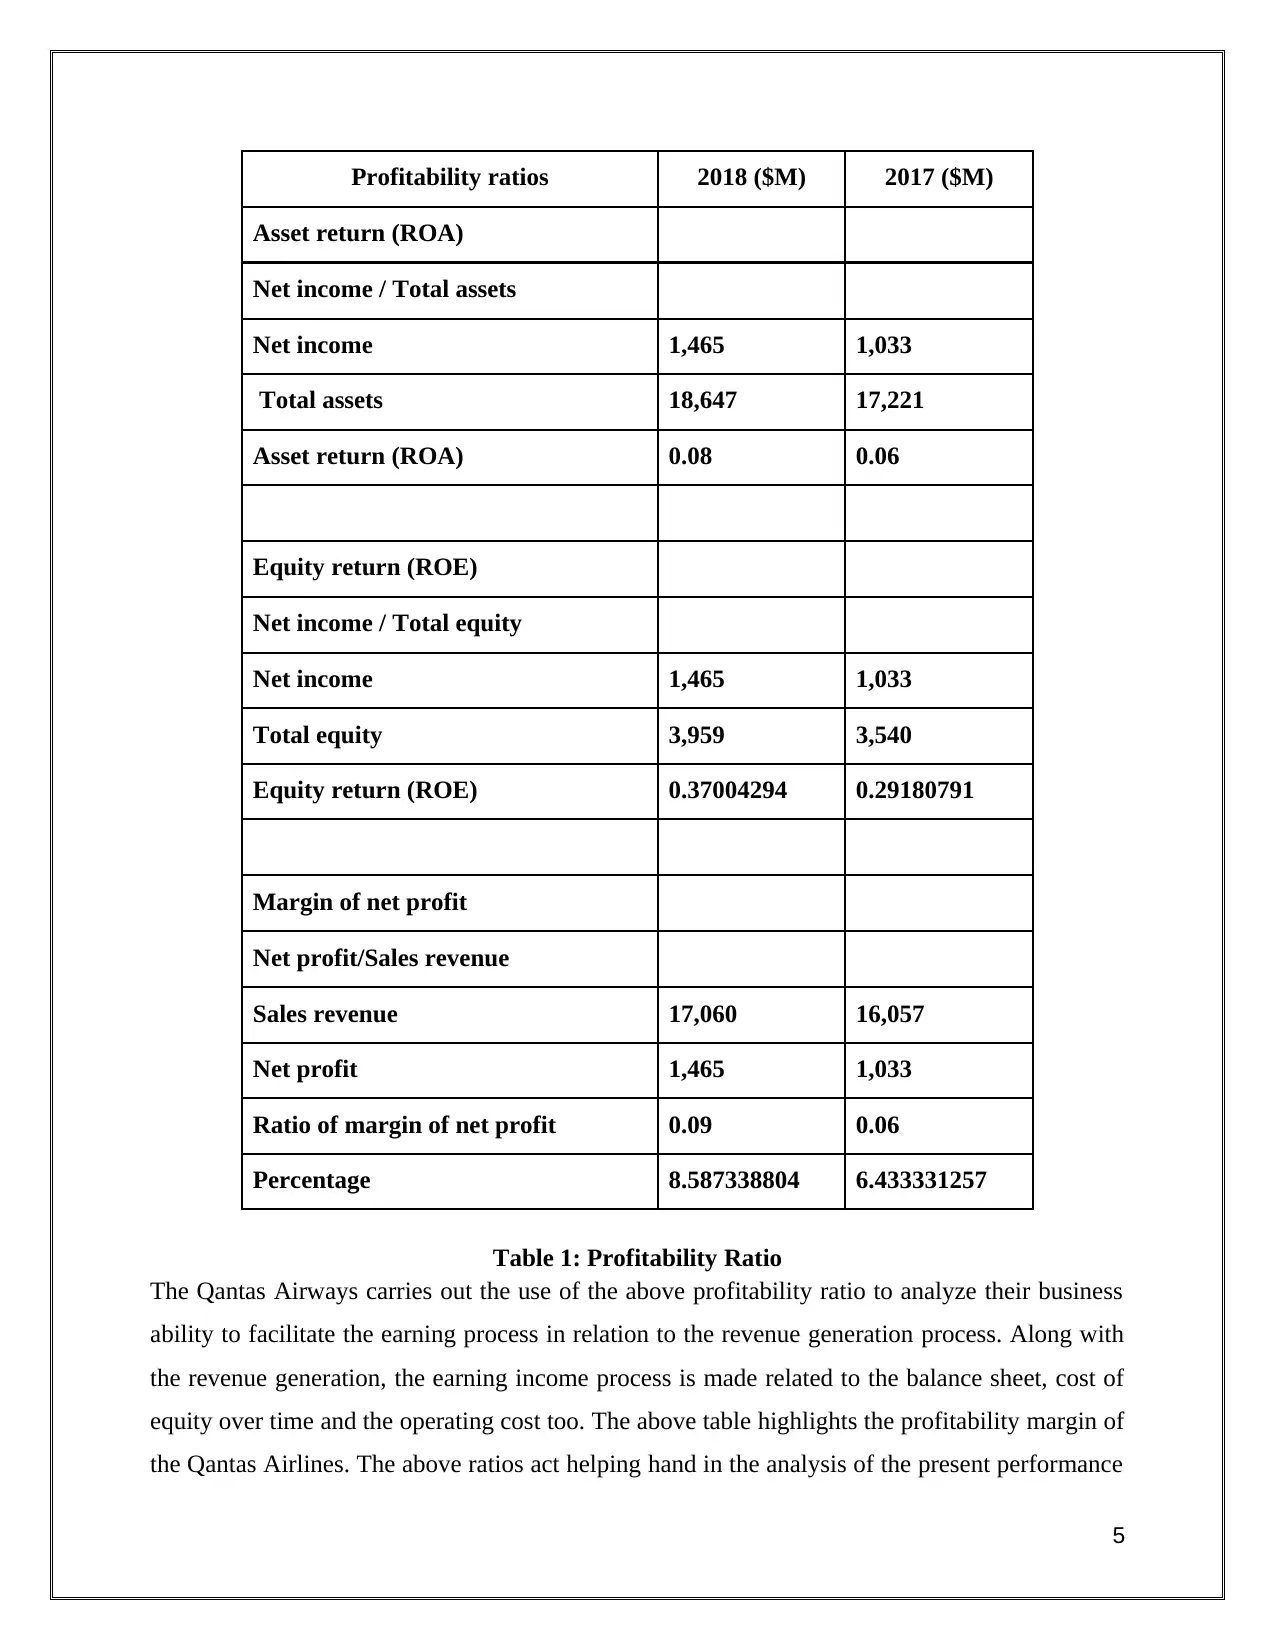
Table 1: Profitability Ratio
The Qantas Airways carries out the use of the above profitability ratio to analyze their business
ability to facilitate the earning process in relation to the revenue generation process. Along with
the revenue generation, the earning income process is made related to the balance sheet, cost of
equity over time and the operating cost too. The above table highlights the profitability margin of
the Qantas Airlines. The above ratios act helping hand in the analysis of the present performance
5
Asset return (ROA)
Net income / Total assets
Net income 1,465 1,033
Total assets 18,647 17,221
Asset return (ROA) 0.08 0.06
Equity return (ROE)
Net income / Total equity
Net income 1,465 1,033
Total equity 3,959 3,540
Equity return (ROE) 0.37004294 0.29180791
Margin of net profit
Net profit/Sales revenue
Sales revenue 17,060 16,057
Net profit 1,465 1,033
Ratio of margin of net profit 0.09 0.06
Percentage 8.587338804 6.433331257
Table 1: Profitability Ratio
The Qantas Airways carries out the use of the above profitability ratio to analyze their business
ability to facilitate the earning process in relation to the revenue generation process. Along with
the revenue generation, the earning income process is made related to the balance sheet, cost of
equity over time and the operating cost too. The above table highlights the profitability margin of
the Qantas Airlines. The above ratios act helping hand in the analysis of the present performance
5
of the airline giants using numeric values. The asset return ratio of both the years has seen
marginal growth performance. The asset return ratio of the year 2018 has seen reasonable growth
from that of the year 2017. This implies to the fact that the company has been moving in the right
direction in the investment of assets process. This would in turn provide them with effective
form of return rates.
Operating efficiency ratios
Receivable days average 2018 ($M) 2017 ($M)
(Debtors*365)/Total sales revenue
Sales revenue 17,060 16,057
Debtors 908 784
Receivable days average 19 17.82151087
Turnover of working capital
Sales / Working capital average
Sales 17,060 16,057
Working capital (Current assets -
Current liabilities)
-3884 -3976
Turnover of working capital -4.392378991 -4.038480885
Turnover of total assets
Sales / Total assets average
Sales 17,060 16,057
Total assets average 18,647 17,221
Turnover of total assets 0.914892476 0.932408106
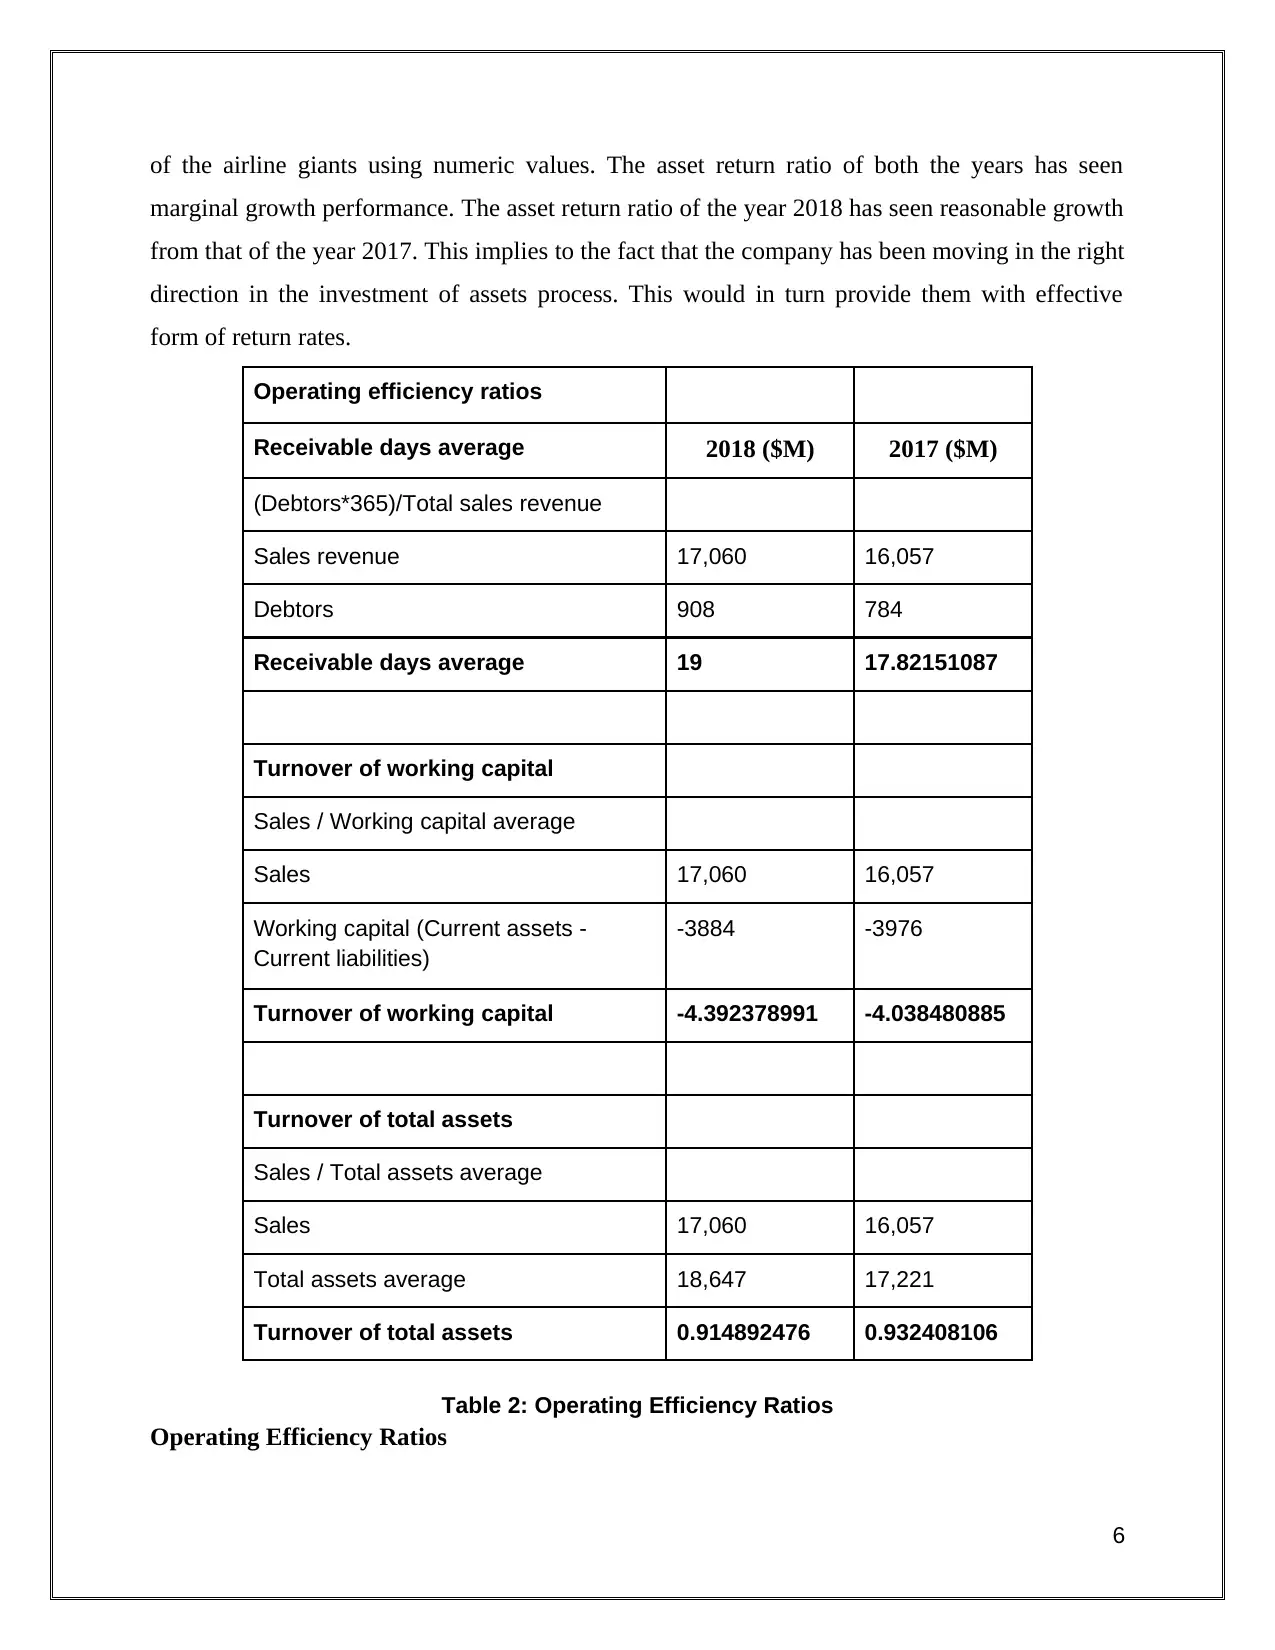
Table 2: Operating Efficiency Ratios
Operating Efficiency Ratios
6
marginal growth performance. The asset return ratio of the year 2018 has seen reasonable growth
from that of the year 2017. This implies to the fact that the company has been moving in the right
direction in the investment of assets process. This would in turn provide them with effective
form of return rates.
Operating efficiency ratios
Receivable days average 2018 ($M) 2017 ($M)
(Debtors*365)/Total sales revenue
Sales revenue 17,060 16,057
Debtors 908 784
Receivable days average 19 17.82151087
Turnover of working capital
Sales / Working capital average
Sales 17,060 16,057
Working capital (Current assets -
Current liabilities)
-3884 -3976
Turnover of working capital -4.392378991 -4.038480885
Turnover of total assets
Sales / Total assets average
Sales 17,060 16,057
Total assets average 18,647 17,221
Turnover of total assets 0.914892476 0.932408106
Table 2: Operating Efficiency Ratios
Operating Efficiency Ratios
6
⊘ This is a preview!⊘
Do you want full access?
Subscribe today to unlock all pages.
Trusted by 1+ million students worldwide
This measures the ability of the Qantas Airways and the implementation of their business process
to carry out income generation for their organization. The turnover of the working capital has
deteriorated from the year 2017 for the concerned company. This means that the company has
not been able to efficiently carry out the use of their resources against the sales levels. The
Process of raising the sales percentage in comparison to the total assets has remained quite
similar in form for both the years. This has been efficiently displayed in the above operation
efficiency ratio table.
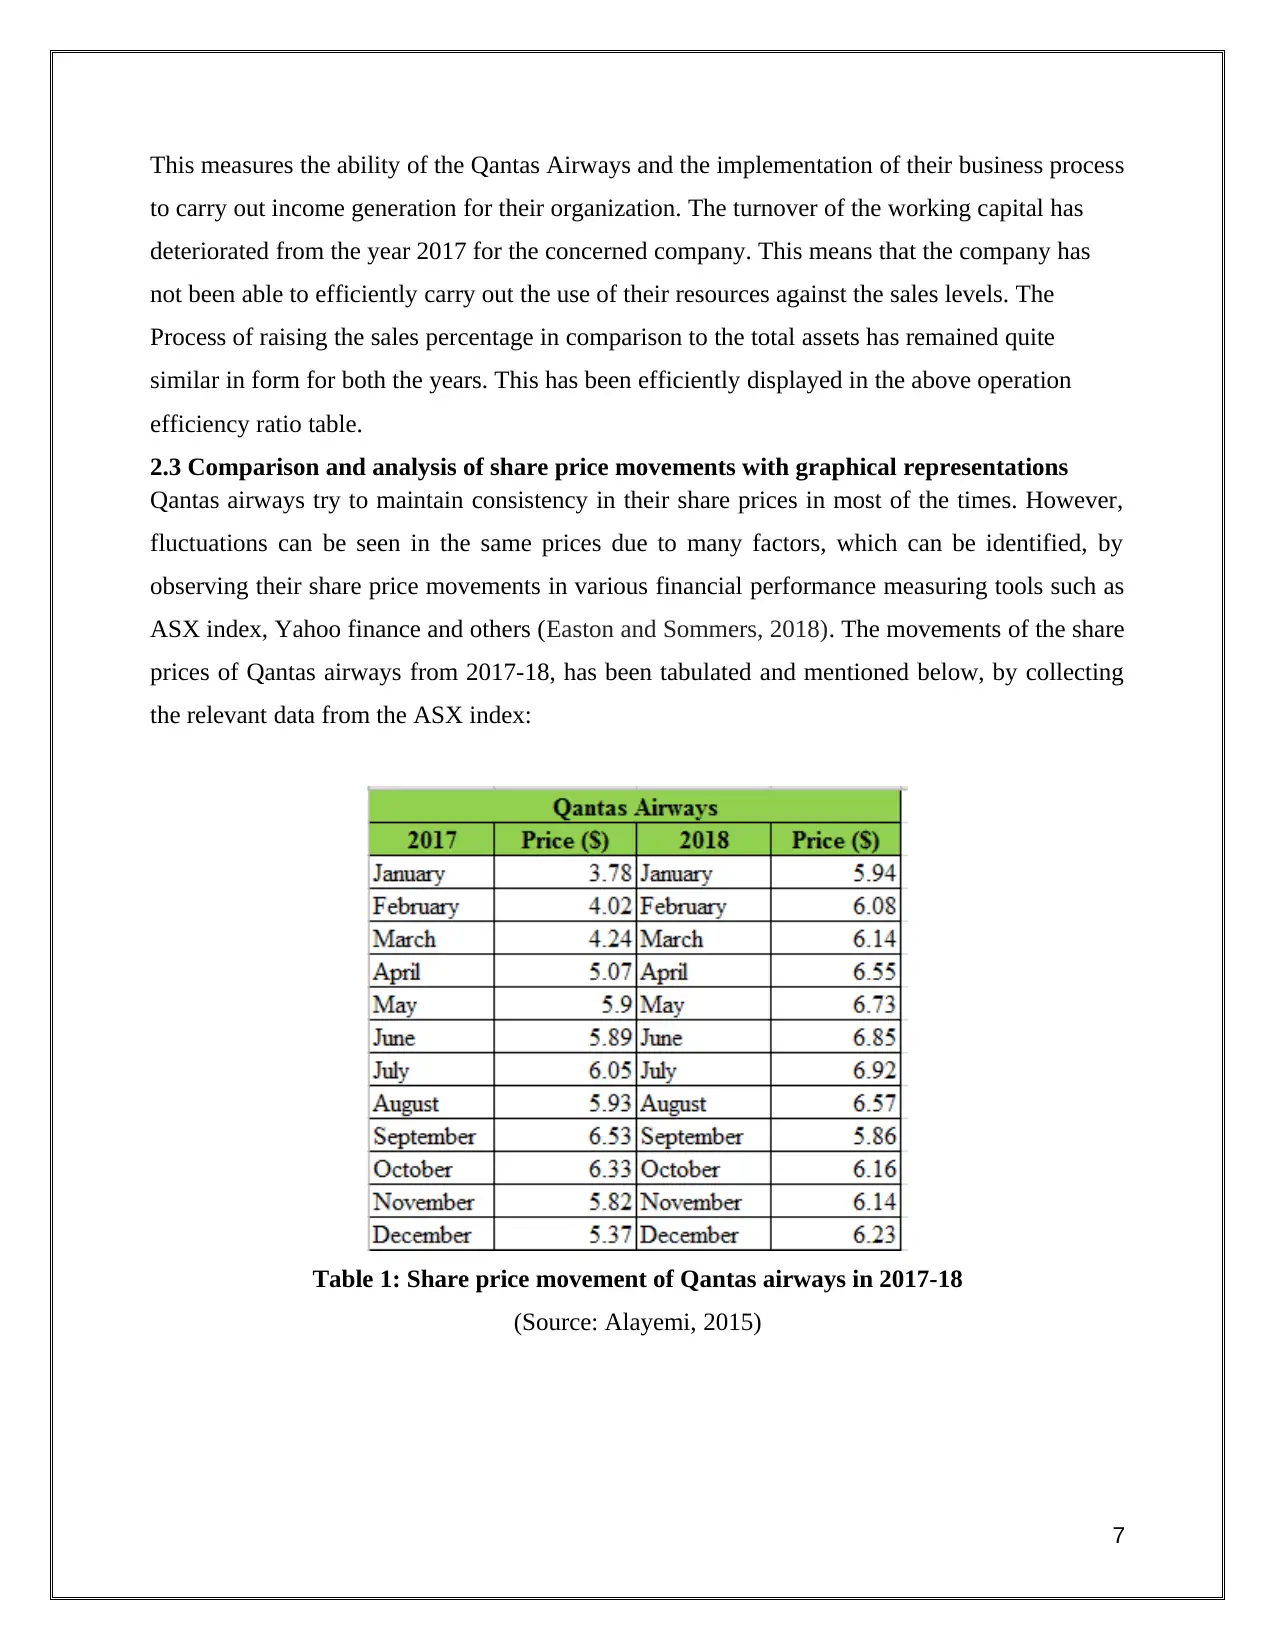
2.3 Comparison and analysis of share price movements with graphical representations
Qantas airways try to maintain consistency in their share prices in most of the times. However,
fluctuations can be seen in the same prices due to many factors, which can be identified, by
observing their share price movements in various financial performance measuring tools such as
ASX index, Yahoo finance and others (Easton and Sommers, 2018). The movements of the share
prices of Qantas airways from 2017-18, has been tabulated and mentioned below, by collecting
the relevant data from the ASX index:
Table 1: Share price movement of Qantas airways in 2017-18
(Source: Alayemi, 2015)
7
to carry out income generation for their organization. The turnover of the working capital has
deteriorated from the year 2017 for the concerned company. This means that the company has
not been able to efficiently carry out the use of their resources against the sales levels. The
Process of raising the sales percentage in comparison to the total assets has remained quite
similar in form for both the years. This has been efficiently displayed in the above operation
efficiency ratio table.
2.3 Comparison and analysis of share price movements with graphical representations
Qantas airways try to maintain consistency in their share prices in most of the times. However,
fluctuations can be seen in the same prices due to many factors, which can be identified, by
observing their share price movements in various financial performance measuring tools such as
ASX index, Yahoo finance and others (Easton and Sommers, 2018). The movements of the share
prices of Qantas airways from 2017-18, has been tabulated and mentioned below, by collecting
the relevant data from the ASX index:
Table 1: Share price movement of Qantas airways in 2017-18
(Source: Alayemi, 2015)
7
Paraphrase This Document
Need a fresh take? Get an instant paraphrase of this document with our AI Paraphraser
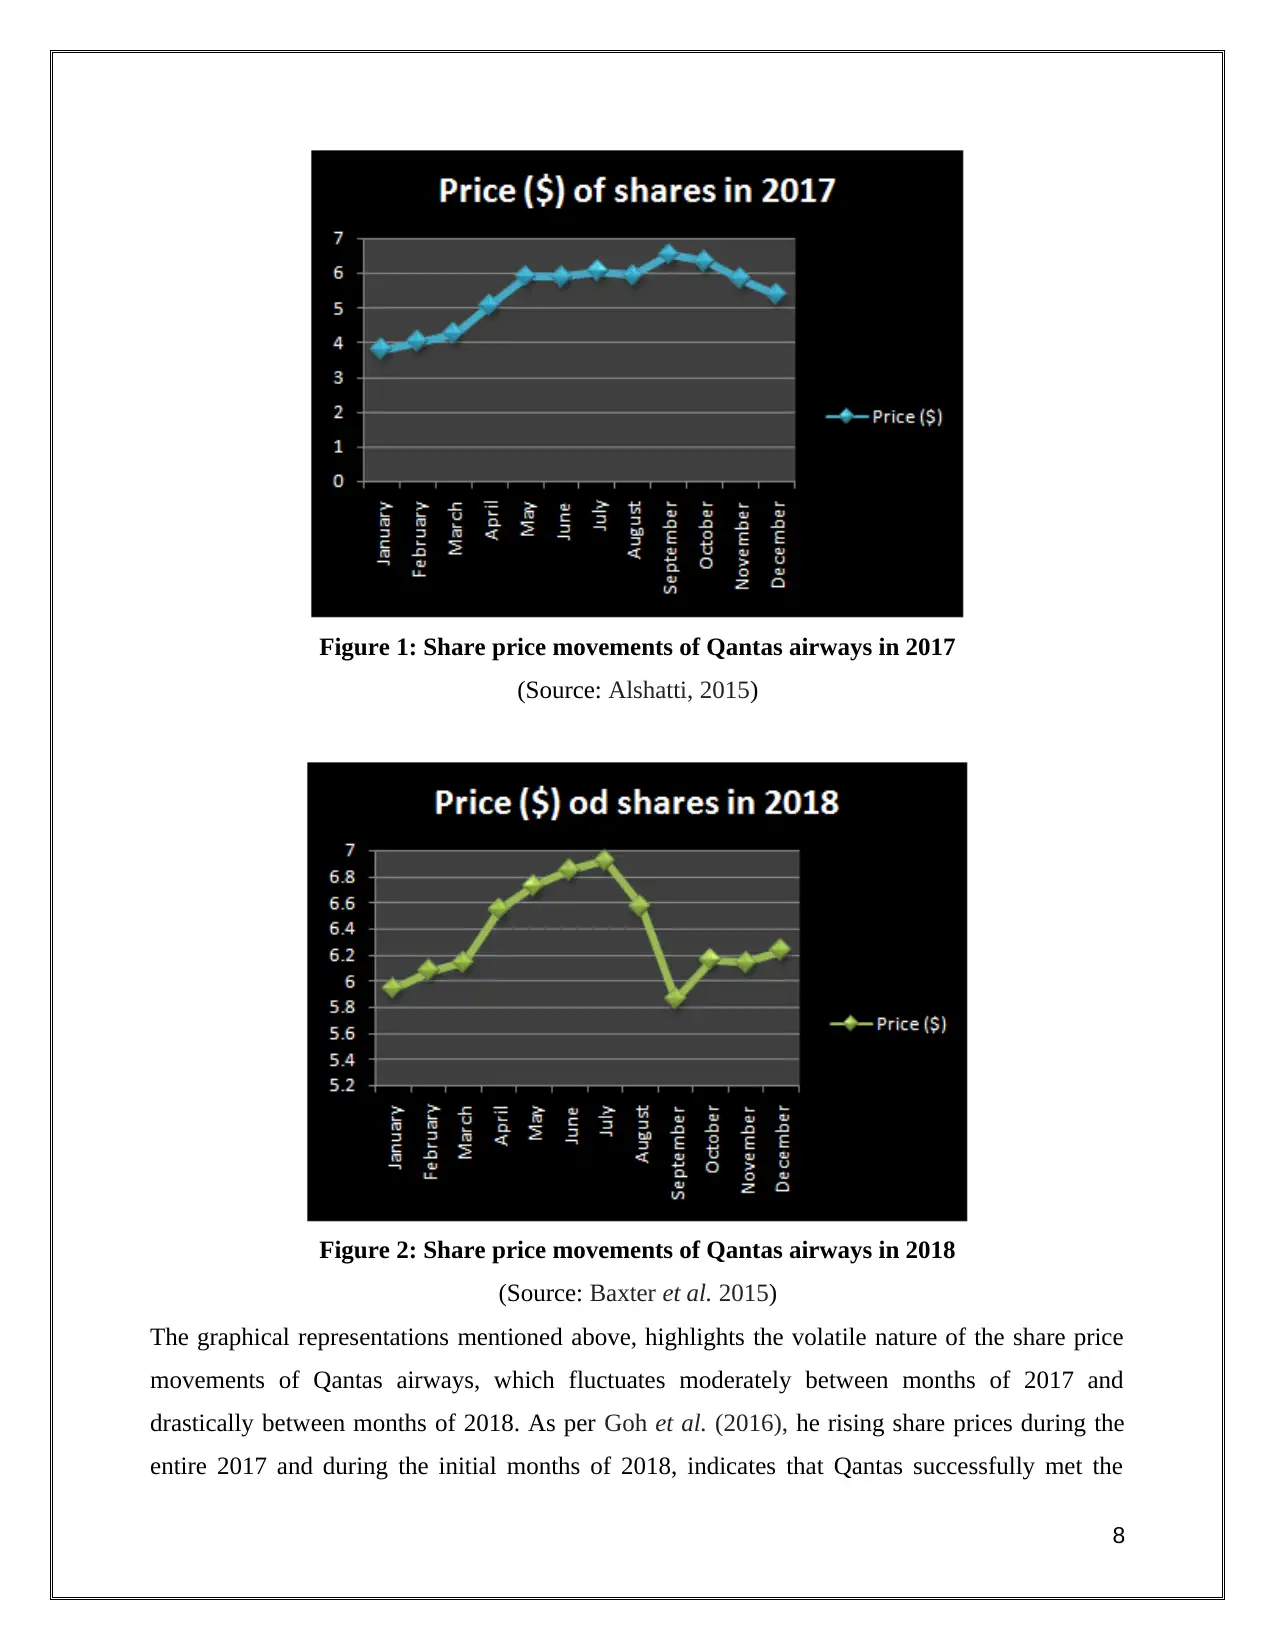
Figure 1: Share price movements of Qantas airways in 2017
(Source: Alshatti, 2015)
Figure 2: Share price movements of Qantas airways in 2018
(Source: Baxter et al. 2015)
The graphical representations mentioned above, highlights the volatile nature of the share price
movements of Qantas airways, which fluctuates moderately between months of 2017 and
drastically between months of 2018. As per Goh et al. (2016), he rising share prices during the
entire 2017 and during the initial months of 2018, indicates that Qantas successfully met the
8
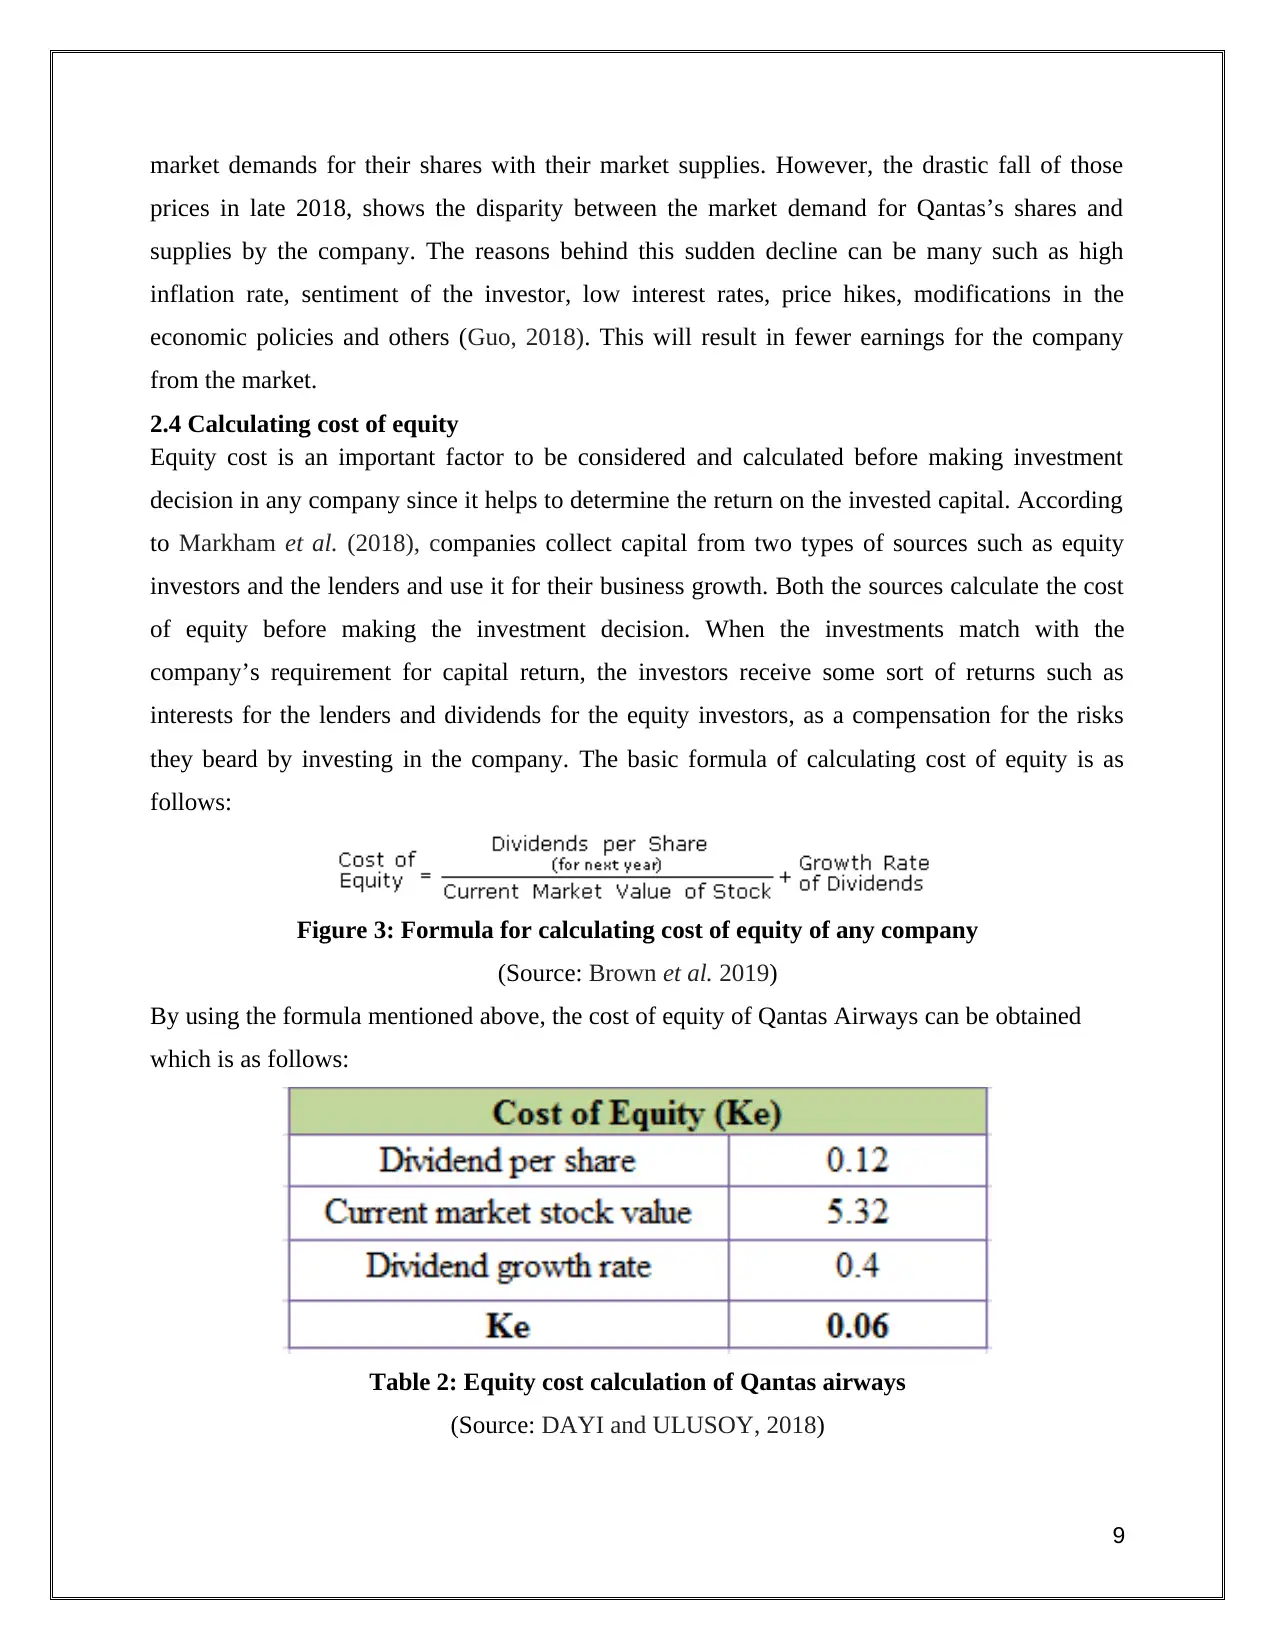
market demands for their shares with their market supplies. However, the drastic fall of those
prices in late 2018, shows the disparity between the market demand for Qantas’s shares and
supplies by the company. The reasons behind this sudden decline can be many such as high
inflation rate, sentiment of the investor, low interest rates, price hikes, modifications in the
economic policies and others (Guo, 2018). This will result in fewer earnings for the company
from the market.
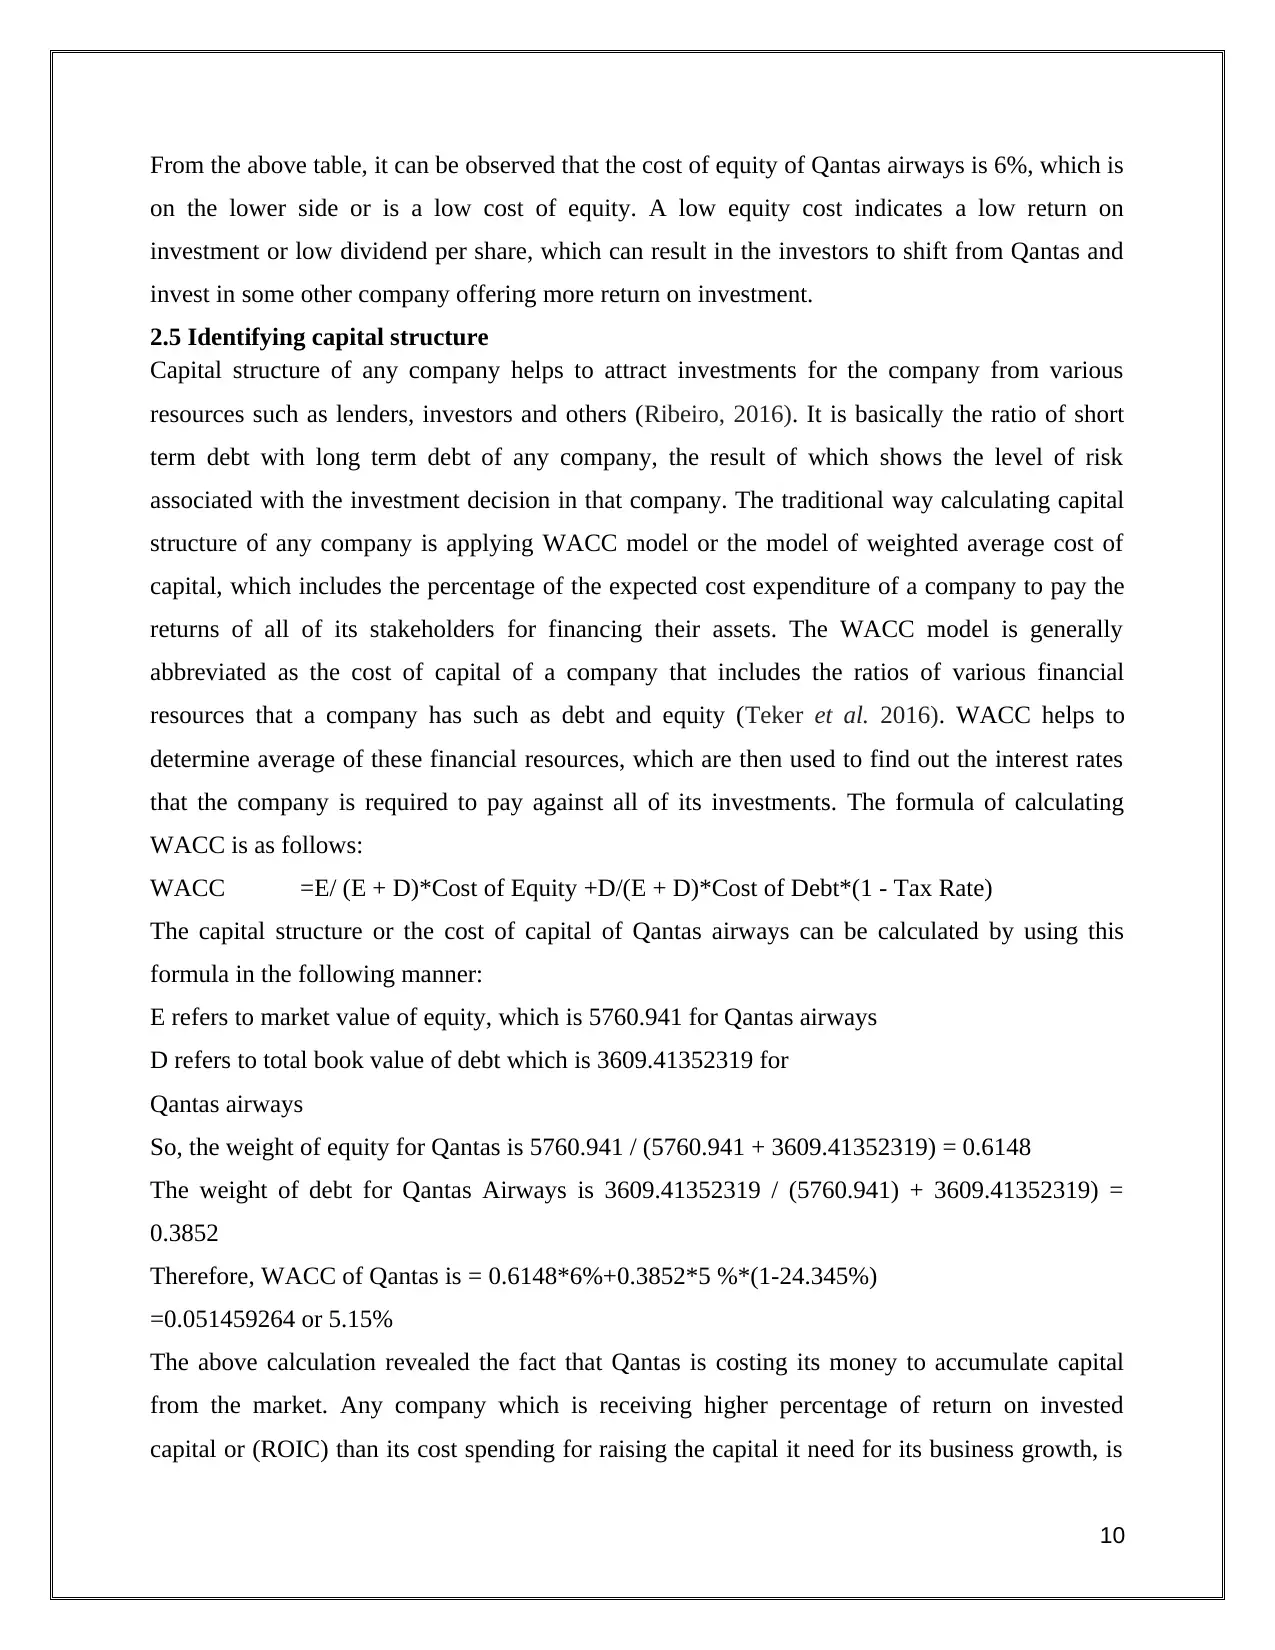
2.4 Calculating cost of equity
Equity cost is an important factor to be considered and calculated before making investment
decision in any company since it helps to determine the return on the invested capital. According
to Markham et al. (2018), companies collect capital from two types of sources such as equity
investors and the lenders and use it for their business growth. Both the sources calculate the cost
of equity before making the investment decision. When the investments match with the
company’s requirement for capital return, the investors receive some sort of returns such as
interests for the lenders and dividends for the equity investors, as a compensation for the risks
they beard by investing in the company. The basic formula of calculating cost of equity is as
follows:
Figure 3: Formula for calculating cost of equity of any company
(Source: Brown et al. 2019)
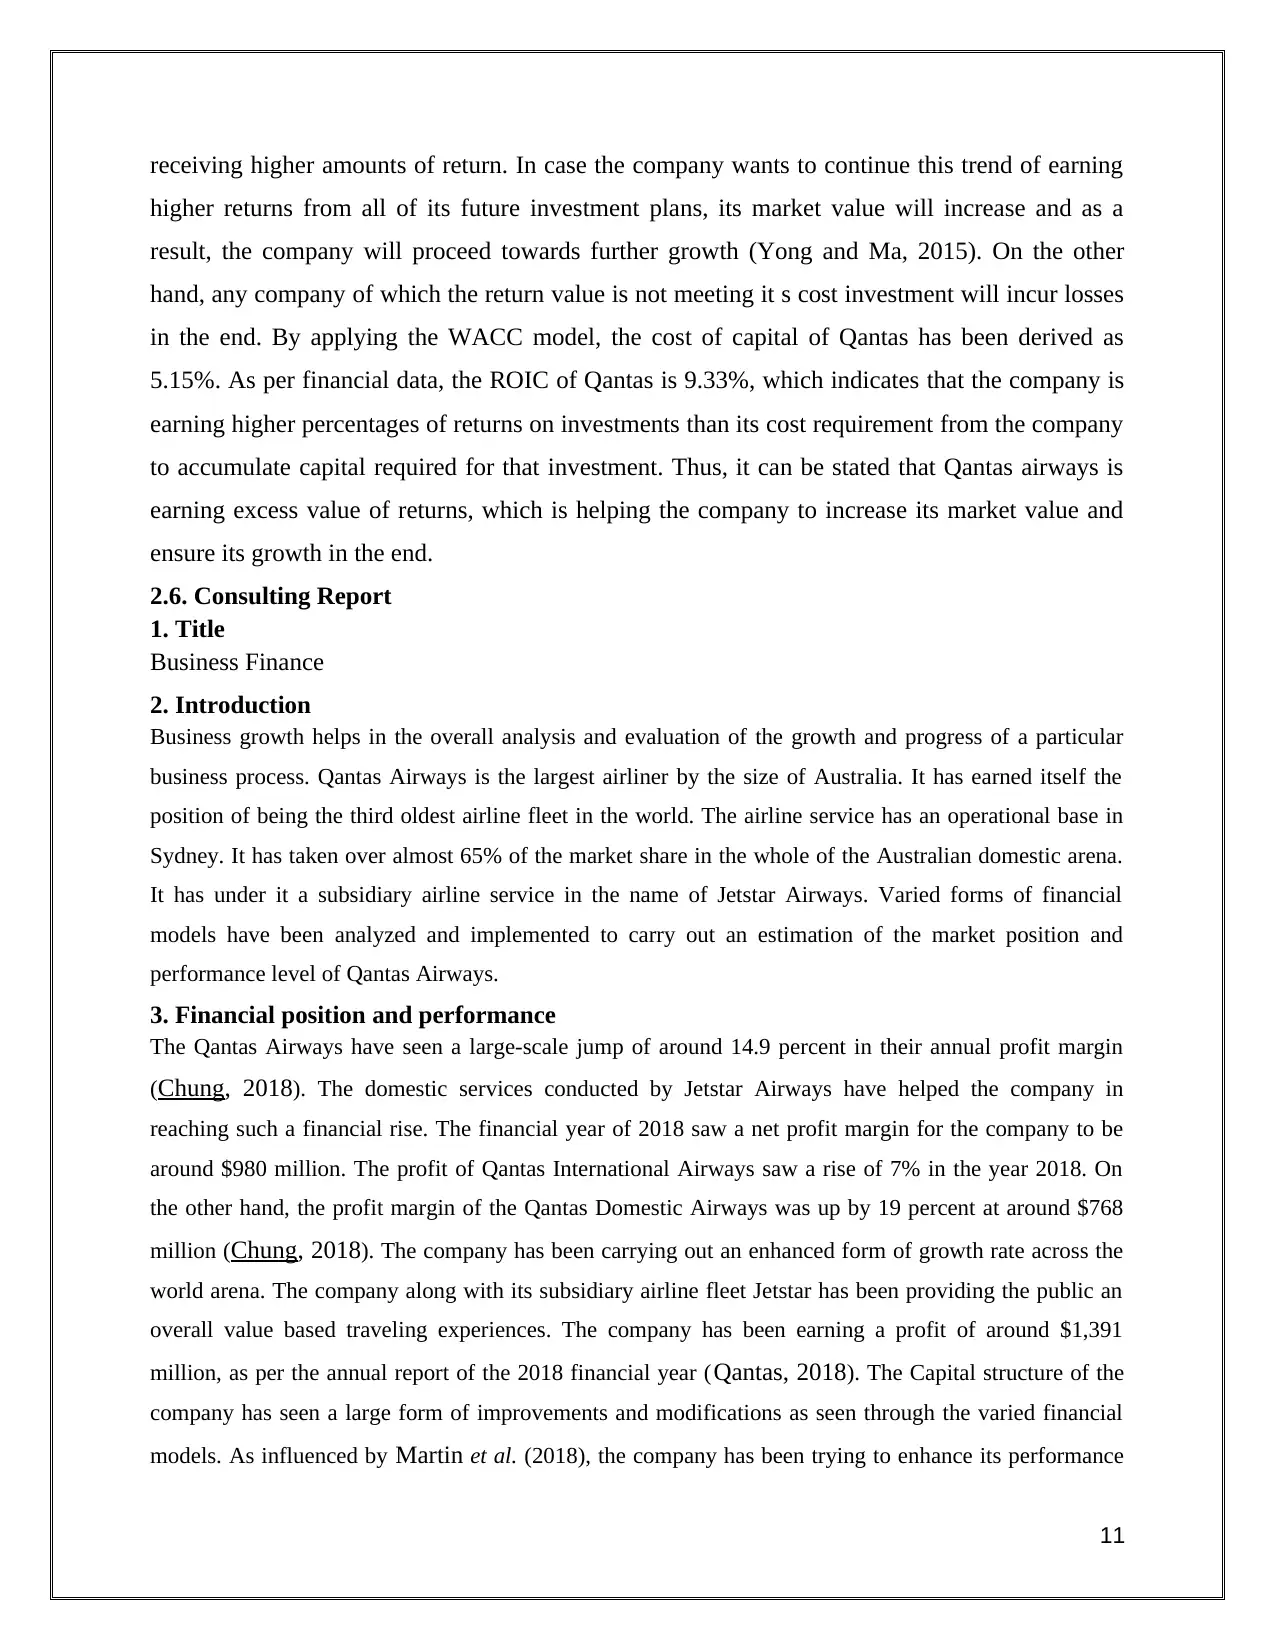
By using the formula mentioned above, the cost of equity of Qantas Airways can be obtained
which is as follows:
Table 2: Equity cost calculation of Qantas airways
(Source: DAYI and ULUSOY, 2018)
9
prices in late 2018, shows the disparity between the market demand for Qantas’s shares and
supplies by the company. The reasons behind this sudden decline can be many such as high
inflation rate, sentiment of the investor, low interest rates, price hikes, modifications in the
economic policies and others (Guo, 2018). This will result in fewer earnings for the company
from the market.
2.4 Calculating cost of equity
Equity cost is an important factor to be considered and calculated before making investment
decision in any company since it helps to determine the return on the invested capital. According
to Markham et al. (2018), companies collect capital from two types of sources such as equity
investors and the lenders and use it for their business growth. Both the sources calculate the cost
of equity before making the investment decision. When the investments match with the
company’s requirement for capital return, the investors receive some sort of returns such as
interests for the lenders and dividends for the equity investors, as a compensation for the risks
they beard by investing in the company. The basic formula of calculating cost of equity is as
follows:
Figure 3: Formula for calculating cost of equity of any company
(Source: Brown et al. 2019)
By using the formula mentioned above, the cost of equity of Qantas Airways can be obtained
which is as follows:
Table 2: Equity cost calculation of Qantas airways
(Source: DAYI and ULUSOY, 2018)
9
⊘ This is a preview!⊘
Do you want full access?
Subscribe today to unlock all pages.
Trusted by 1+ million students worldwide
From the above table, it can be observed that the cost of equity of Qantas airways is 6%, which is
on the lower side or is a low cost of equity. A low equity cost indicates a low return on
investment or low dividend per share, which can result in the investors to shift from Qantas and
invest in some other company offering more return on investment.
2.5 Identifying capital structure
Capital structure of any company helps to attract investments for the company from various
resources such as lenders, investors and others (Ribeiro, 2016). It is basically the ratio of short
term debt with long term debt of any company, the result of which shows the level of risk
associated with the investment decision in that company. The traditional way calculating capital
structure of any company is applying WACC model or the model of weighted average cost of
capital, which includes the percentage of the expected cost expenditure of a company to pay the
returns of all of its stakeholders for financing their assets. The WACC model is generally
abbreviated as the cost of capital of a company that includes the ratios of various financial
resources that a company has such as debt and equity (Teker et al. 2016). WACC helps to
determine average of these financial resources, which are then used to find out the interest rates
that the company is required to pay against all of its investments. The formula of calculating
WACC is as follows:
WACC =E/ (E + D)*Cost of Equity +D/(E + D)*Cost of Debt*(1 - Tax Rate)
The capital structure or the cost of capital of Qantas airways can be calculated by using this
formula in the following manner:
E refers to market value of equity, which is 5760.941 for Qantas airways
D refers to total book value of debt which is 3609.41352319 for
Qantas airways
So, the weight of equity for Qantas is 5760.941 / (5760.941 + 3609.41352319) = 0.6148
The weight of debt for Qantas Airways is 3609.41352319 / (5760.941) + 3609.41352319) =
0.3852
Therefore, WACC of Qantas is = 0.6148*6%+0.3852*5 %*(1-24.345%)
=0.051459264 or 5.15%
The above calculation revealed the fact that Qantas is costing its money to accumulate capital
from the market. Any company which is receiving higher percentage of return on invested
capital or (ROIC) than its cost spending for raising the capital it need for its business growth, is
10
Paraphrase This Document
Need a fresh take? Get an instant paraphrase of this document with our AI Paraphraser
receiving higher amounts of return. In case the company wants to continue this trend of earning
higher returns from all of its future investment plans, its market value will increase and as a
result, the company will proceed towards further growth (Yong and Ma, 2015). On the other
hand, any company of which the return value is not meeting it s cost investment will incur losses
in the end. By applying the WACC model, the cost of capital of Qantas has been derived as
5.15%. As per financial data, the ROIC of Qantas is 9.33%, which indicates that the company is
earning higher percentages of returns on investments than its cost requirement from the company
to accumulate capital required for that investment. Thus, it can be stated that Qantas airways is
earning excess value of returns, which is helping the company to increase its market value and
ensure its growth in the end.
2.6. Consulting Report
1. Title
Business Finance
2. Introduction
Business growth helps in the overall analysis and evaluation of the growth and progress of a particular
business process. Qantas Airways is the largest airliner by the size of Australia. It has earned itself the
position of being the third oldest airline fleet in the world. The airline service has an operational base in
Sydney. It has taken over almost 65% of the market share in the whole of the Australian domestic arena.
It has under it a subsidiary airline service in the name of Jetstar Airways. Varied forms of financial
models have been analyzed and implemented to carry out an estimation of the market position and
performance level of Qantas Airways.
3. Financial position and performance
The Qantas Airways have seen a large-scale jump of around 14.9 percent in their annual profit margin
(Chung, 2018). The domestic services conducted by Jetstar Airways have helped the company in
reaching such a financial rise. The financial year of 2018 saw a net profit margin for the company to be
around $980 million. The profit of Qantas International Airways saw a rise of 7% in the year 2018. On
the other hand, the profit margin of the Qantas Domestic Airways was up by 19 percent at around $768
million (Chung, 2018). The company has been carrying out an enhanced form of growth rate across the
world arena. The company along with its subsidiary airline fleet Jetstar has been providing the public an
overall value based traveling experiences. The company has been earning a profit of around $1,391
million, as per the annual report of the 2018 financial year (Qantas, 2018). The Capital structure of the
company has seen a large form of improvements and modifications as seen through the varied financial
models. As influenced by Martin et al. (2018), the company has been trying to enhance its performance
11
level through free Wi-Fi, cabin modifications and high-quality deliverance of services through a large
scale investment process in these fields. The performance enhancement process that the leading airline
fleet has been trying to achieve could lead it to attract a large base of shareholders(Corbet et al. 2019).
This, in turn, could increase its capital control. The debt and equity costs of the airline company have
been seen to be analyzed in a large manner. This has however brought positive impacts for the airline
giants by helping to keep the interest level of the investors intact in form.
4. Conclusion
The analyses that have been carried out in the above sections highlight the good performance
increasing the profit level of the Qantas Airlines. The performance level has seen a large-scale
growth in the financial year of 2018. Along with the International earning of the Airline fleet, the
domestic sector also demonstrated enhanced profit growth. The subsidiary airline company
within its arena, Jetstar has also provided a large good form of performance levels in the
financial year 0f 2018. The financial positional analysis thus provides a good form of
comparative understanding of the company along with other competitors in the arena.
5. Recommendation
Qantas Airlines to maintain the high-performance margin has to carry out the formation of good strategic
decisions and plans. These strategic plans would help the company to carry out the attraction process for
new shareholders. Strategic decision planning would also help the company to carry out new and
innovative cost-effective processes for its functioning. The company must carry out a more flexible
financial service process. The Value process of the company has increased. However, a more flexible
base for financial services would help it to aid a new form of customers. Lastly, the company must carry
out the implementation of new financial models. A detailed analyzing and monitoring process of the
growth of the company will help the airline fleet in implementing the necessary form of financial models
in a more effective manner.
IV. Conclusion
Qantas Airways is a famous airlines company in Australia, which runs its operations in various
parts of the world such as Australia, New Zealand, South pacific and others. Apart from offering
air transport, it offers several others services also such as hotel and cab booking facilities,
conference booking facilities, managing activities, membership benefits for frequent flyers and
many more. The company’s worth refers to the expected returns the investors can enjoy or
expected risks the investors might face by investing in this company. Calculation of capital
structure of Qantas has also helped to understand the worth of investment plans in this company.
All the ratios highlighted the fact that the company performed well in 2018 by posting a 15%
12
⊘ This is a preview!⊘
Do you want full access?
Subscribe today to unlock all pages.
Trusted by 1+ million students worldwide
1 out of 15
Related Documents


Your All-in-One AI-Powered Toolkit for Academic Success.
+13062052269
info@desklib.com
Available 24*7 on WhatsApp / Email
![[object Object]](/_next/static/media/star-bottom.7253800d.svg)
Unlock your academic potential
Copyright © 2020–2026 A2Z Services. All Rights Reserved. Developed and managed by ZUCOL.