Analyzing Qantas Airways: Financial Ratios, CAPM, and Recommendations
VerifiedAdded on 2023/04/21
|17
|4125
|152
Report
AI Summary
This report provides a comprehensive financial analysis of Qantas Airways, focusing on key financial ratios related to profitability, liquidity, financial leverage, efficiency, and market value. The analysis covers a two-year period, utilizing data from the company's annual reports to assess its financial performance. Profitability ratios such as net profit margin, return on equity, and return on assets are evaluated, indicating improvements in the company's profit-generating capacity. Liquidity ratios, including current ratio, quick ratio, and cash ratio, are examined to determine the company's ability to manage its current obligations. Financial leverage ratios, such as debt-to-equity ratio, debt ratio, and equity ratio, are analyzed to understand the company's capital structure. Efficiency ratios, including total asset turnover ratio, fixed asset turnover ratio, and receivables turnover ratio, are computed to assess the overall efficiency of the business. Market value ratios, including dividend payout ratio, dividend yield ratio, and price-to-earnings ratio, are evaluated to reflect the market valuation of the company's shares. Additionally, the report includes a graphical presentation of stock price movements, calculation of beta and required rate of return under CAPM, and an analysis of the capital structure of the business, culminating in recommendations for further improving the company's performance.
Running head: BUSINESS FINANCE
Business Finance
Name of the Student:
Name of the University
Author’s Note:
Business Finance
Name of the Student:
Name of the University
Author’s Note:
Paraphrase This Document
Need a fresh take? Get an instant paraphrase of this document with our AI Paraphraser
1
BUSINESS FINANCE
Table of Contents
Introduction......................................................................................................................................2
Analysis of Key Financial Ratios....................................................................................................2
Profitability Ratios.......................................................................................................................3
Liquidity Ratios...........................................................................................................................4
Financial Leverage Ratio.............................................................................................................5
Efficiency Ratios.........................................................................................................................5
Market Value Ratios....................................................................................................................6
Graphical Presentation Showing Price Movements........................................................................7
Calculation of Beta and Required Rate of Return under CAPM.....................................................9
Capital structure of the Business...................................................................................................10
Recommendations..........................................................................................................................10
Conclusion.....................................................................................................................................11
Reference.......................................................................................................................................12
Appendix........................................................................................................................................14
2
BUSINESS FINANCE
Introduction
The main purpose of this assessment is to analyze the business of Quantas Airways which
is engaged in providing air travel services to all the customers of the business. The analysis is
undertaken so that effective decisions can be taken regarding the financial performance of the
business. The report will also be including calculations of key financial ratios which are related
to profitability, solvency and efficiency of the company so as to have a basic understanding of
the viability of the business.
Qantas Airways is regarded as the largest airline in terms of fleet size of the business and
is also considered to be one of the important airlines which operates in Australia. In addition to
this, the company goes back and is regarded to be one of the oldest airlines after
KLM and Avianca. The airline was setup in 1920 and since the business has effectively served
large number of customers. The name of the company Qantas is derived from
"Queensland and Northern Territory Aerial Services" and Qantas is just a short form which is
used for this name. The company major operations are situated in Sydney and it is estimated that
the airlines provide for 65% of all the domestic travels in the country and around 14.9% of all
passenger travels in the world (Investor.qantas.com. 2018). The company is known for its
policies for providing the best quality of services at the lowest possible costs of the business.
The assessment would be evaluating the changes which takes place in the stock prices of
the business during the two years period for which appropriate graphical presentation is also
provided in the analysis (Obradovich and Gill 2013). The assessment also evaluates the volatility
in the stock prices of the business by considering the all ordinary index and making comparison
with the same. The assessment would also be analyzing the capital structure of the business and
make discussion relating to the same (Mwangi, Muathe and Kosimbei 2014). The report also
includes a recommendation part which provides as to how the company a further improve the
performance of the business.
Analysis of Key Financial Ratios
The key financial ratios are computed in order to assess the financial performance of the
business for the two years period which is considered. The ratios relating to profitability,
efficiency, market values and liquidity is computed for the business for the purpose of analysis of
⊘ This is a preview!⊘
Do you want full access?
Subscribe today to unlock all pages.
Trusted by 1+ million students worldwide
3
BUSINESS FINANCE
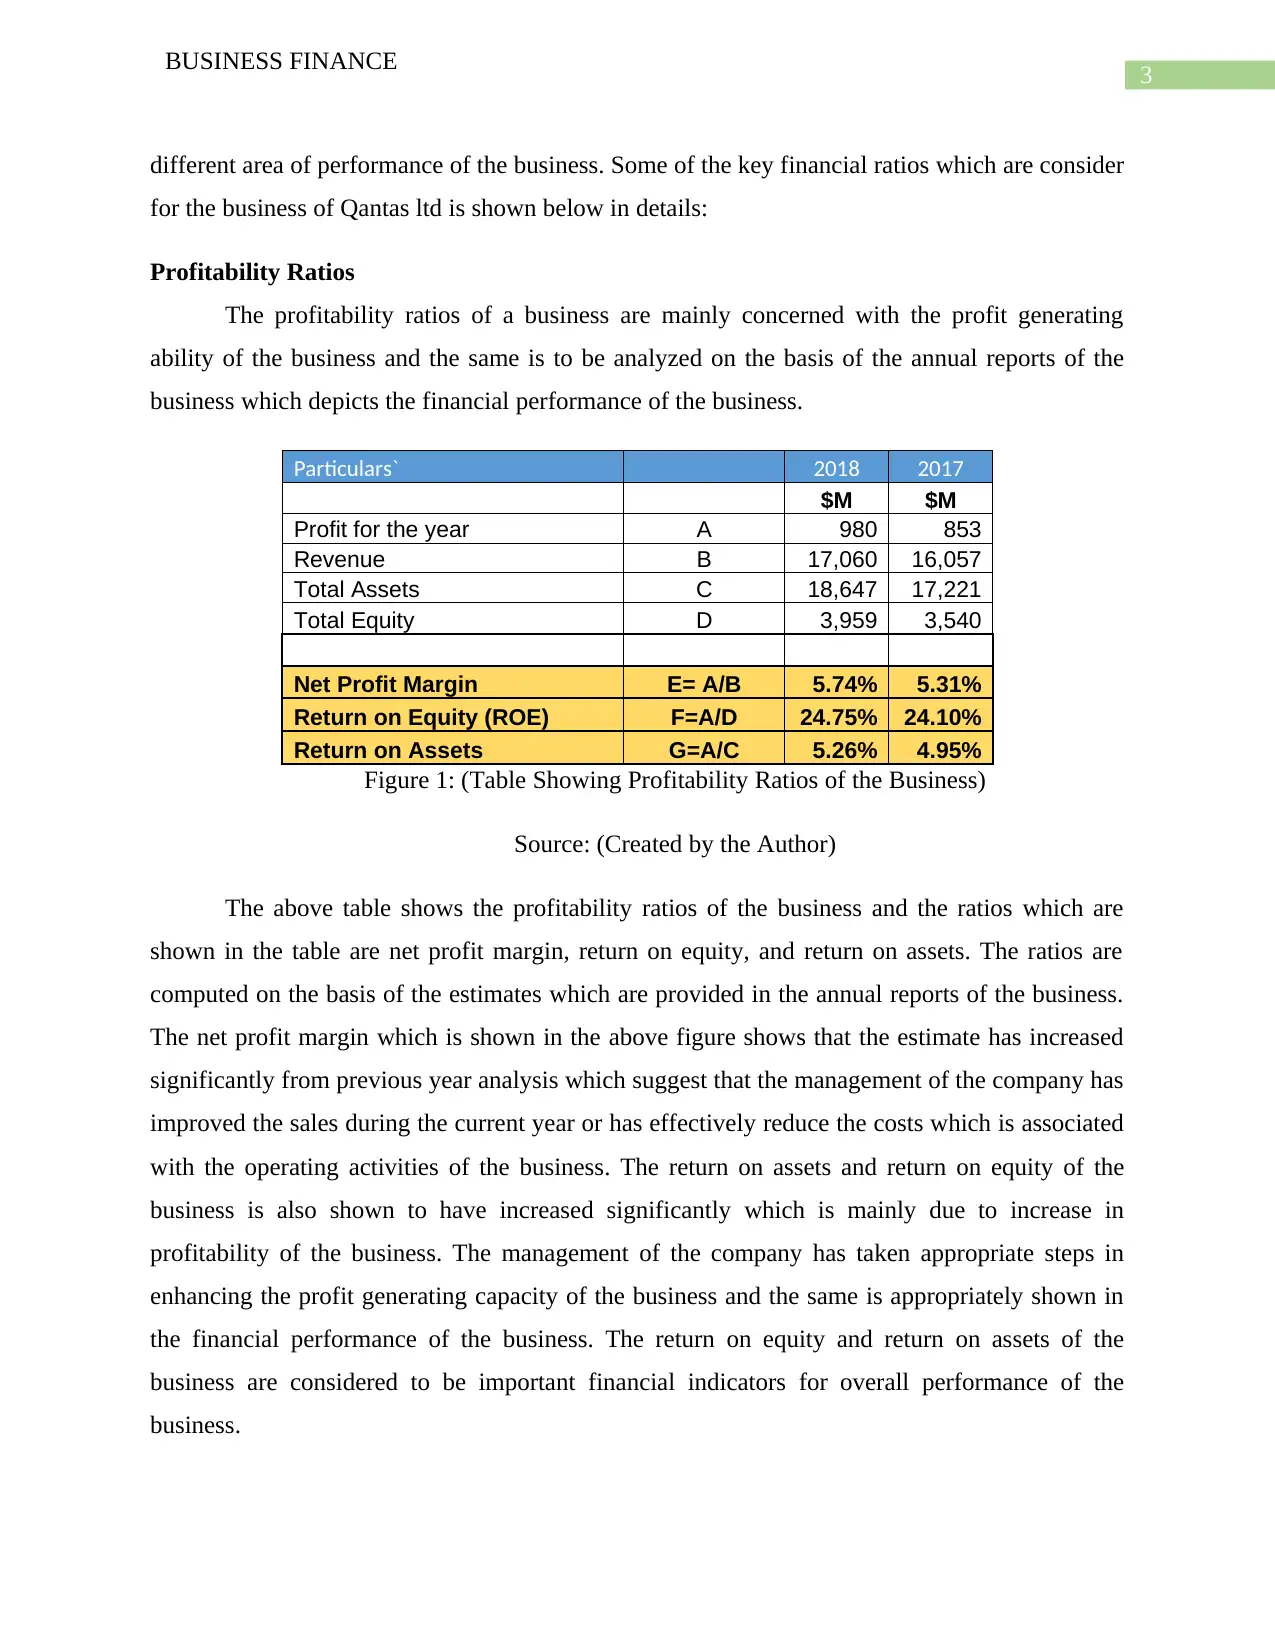
different area of performance of the business. Some of the key financial ratios which are consider
for the business of Qantas ltd is shown below in details:
Profitability Ratios
The profitability ratios of a business are mainly concerned with the profit generating
ability of the business and the same is to be analyzed on the basis of the annual reports of the
business which depicts the financial performance of the business.
Particulars` 2018 2017
$M $M
Profit for the year A 980 853
Revenue B 17,060 16,057
Total Assets C 18,647 17,221
Total Equity D 3,959 3,540
Net Profit Margin E= A/B 5.74% 5.31%
Return on Equity (ROE) F=A/D 24.75% 24.10%
Return on Assets G=A/C 5.26% 4.95%
Figure 1: (Table Showing Profitability Ratios of the Business)
Source: (Created by the Author)
The above table shows the profitability ratios of the business and the ratios which are
shown in the table are net profit margin, return on equity, and return on assets. The ratios are
computed on the basis of the estimates which are provided in the annual reports of the business.
The net profit margin which is shown in the above figure shows that the estimate has increased
significantly from previous year analysis which suggest that the management of the company has
improved the sales during the current year or has effectively reduce the costs which is associated
with the operating activities of the business. The return on assets and return on equity of the
business is also shown to have increased significantly which is mainly due to increase in
profitability of the business. The management of the company has taken appropriate steps in
enhancing the profit generating capacity of the business and the same is appropriately shown in
the financial performance of the business. The return on equity and return on assets of the
business are considered to be important financial indicators for overall performance of the
business.
BUSINESS FINANCE
different area of performance of the business. Some of the key financial ratios which are consider
for the business of Qantas ltd is shown below in details:
Profitability Ratios
The profitability ratios of a business are mainly concerned with the profit generating
ability of the business and the same is to be analyzed on the basis of the annual reports of the
business which depicts the financial performance of the business.
Particulars` 2018 2017
$M $M
Profit for the year A 980 853
Revenue B 17,060 16,057
Total Assets C 18,647 17,221
Total Equity D 3,959 3,540
Net Profit Margin E= A/B 5.74% 5.31%
Return on Equity (ROE) F=A/D 24.75% 24.10%
Return on Assets G=A/C 5.26% 4.95%
Figure 1: (Table Showing Profitability Ratios of the Business)
Source: (Created by the Author)
The above table shows the profitability ratios of the business and the ratios which are
shown in the table are net profit margin, return on equity, and return on assets. The ratios are
computed on the basis of the estimates which are provided in the annual reports of the business.
The net profit margin which is shown in the above figure shows that the estimate has increased
significantly from previous year analysis which suggest that the management of the company has
improved the sales during the current year or has effectively reduce the costs which is associated
with the operating activities of the business. The return on assets and return on equity of the
business is also shown to have increased significantly which is mainly due to increase in
profitability of the business. The management of the company has taken appropriate steps in
enhancing the profit generating capacity of the business and the same is appropriately shown in
the financial performance of the business. The return on equity and return on assets of the
business are considered to be important financial indicators for overall performance of the
business.
Paraphrase This Document
Need a fresh take? Get an instant paraphrase of this document with our AI Paraphraser
4
BUSINESS FINANCE
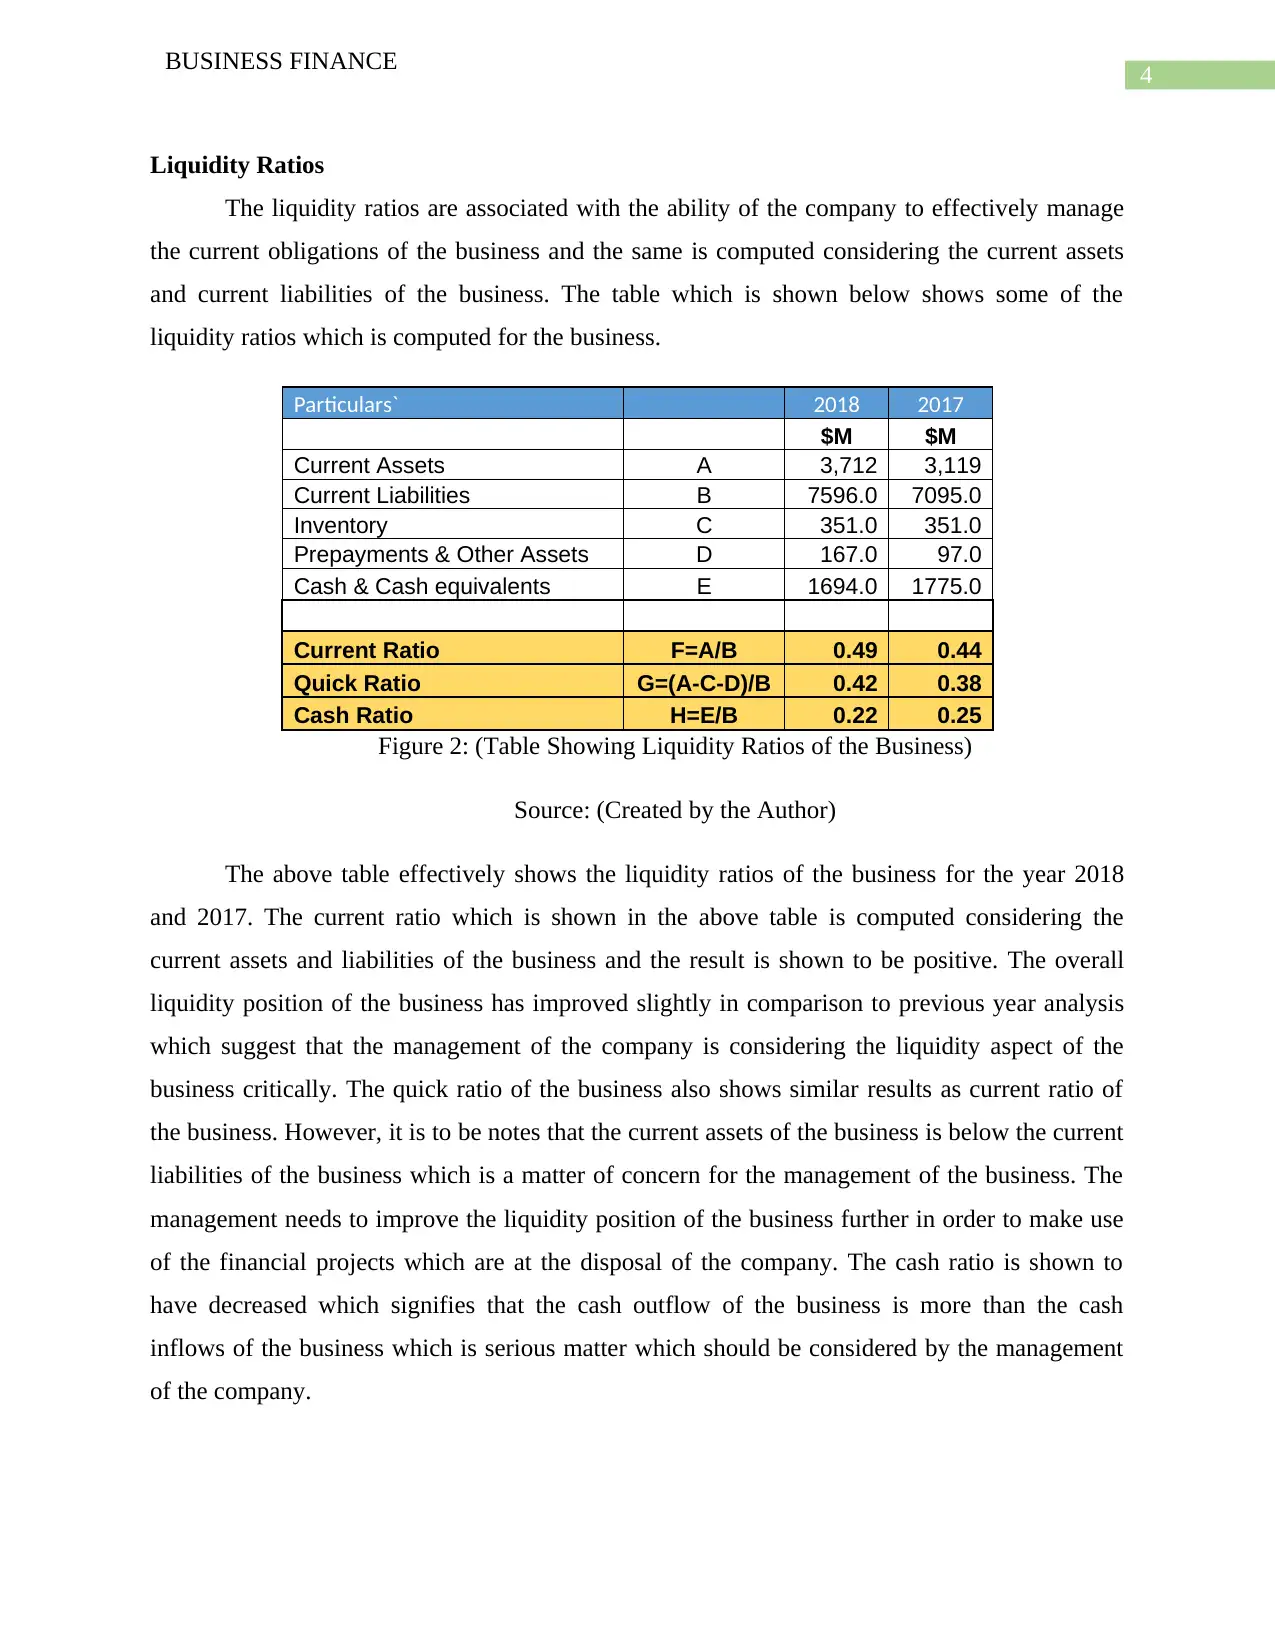
Liquidity Ratios
The liquidity ratios are associated with the ability of the company to effectively manage
the current obligations of the business and the same is computed considering the current assets
and current liabilities of the business. The table which is shown below shows some of the
liquidity ratios which is computed for the business.
Particulars` 2018 2017
$M $M
Current Assets A 3,712 3,119
Current Liabilities B 7596.0 7095.0
Inventory C 351.0 351.0
Prepayments & Other Assets D 167.0 97.0
Cash & Cash equivalents E 1694.0 1775.0
Current Ratio F=A/B 0.49 0.44
Quick Ratio G=(A-C-D)/B 0.42 0.38
Cash Ratio H=E/B 0.22 0.25
Figure 2: (Table Showing Liquidity Ratios of the Business)
Source: (Created by the Author)
The above table effectively shows the liquidity ratios of the business for the year 2018
and 2017. The current ratio which is shown in the above table is computed considering the
current assets and liabilities of the business and the result is shown to be positive. The overall
liquidity position of the business has improved slightly in comparison to previous year analysis
which suggest that the management of the company is considering the liquidity aspect of the
business critically. The quick ratio of the business also shows similar results as current ratio of
the business. However, it is to be notes that the current assets of the business is below the current
liabilities of the business which is a matter of concern for the management of the business. The
management needs to improve the liquidity position of the business further in order to make use
of the financial projects which are at the disposal of the company. The cash ratio is shown to
have decreased which signifies that the cash outflow of the business is more than the cash
inflows of the business which is serious matter which should be considered by the management
of the company.
BUSINESS FINANCE
Liquidity Ratios
The liquidity ratios are associated with the ability of the company to effectively manage
the current obligations of the business and the same is computed considering the current assets
and current liabilities of the business. The table which is shown below shows some of the
liquidity ratios which is computed for the business.
Particulars` 2018 2017
$M $M
Current Assets A 3,712 3,119
Current Liabilities B 7596.0 7095.0
Inventory C 351.0 351.0
Prepayments & Other Assets D 167.0 97.0
Cash & Cash equivalents E 1694.0 1775.0
Current Ratio F=A/B 0.49 0.44
Quick Ratio G=(A-C-D)/B 0.42 0.38
Cash Ratio H=E/B 0.22 0.25
Figure 2: (Table Showing Liquidity Ratios of the Business)
Source: (Created by the Author)
The above table effectively shows the liquidity ratios of the business for the year 2018
and 2017. The current ratio which is shown in the above table is computed considering the
current assets and liabilities of the business and the result is shown to be positive. The overall
liquidity position of the business has improved slightly in comparison to previous year analysis
which suggest that the management of the company is considering the liquidity aspect of the
business critically. The quick ratio of the business also shows similar results as current ratio of
the business. However, it is to be notes that the current assets of the business is below the current
liabilities of the business which is a matter of concern for the management of the business. The
management needs to improve the liquidity position of the business further in order to make use
of the financial projects which are at the disposal of the company. The cash ratio is shown to
have decreased which signifies that the cash outflow of the business is more than the cash
inflows of the business which is serious matter which should be considered by the management
of the company.
5
BUSINESS FINANCE
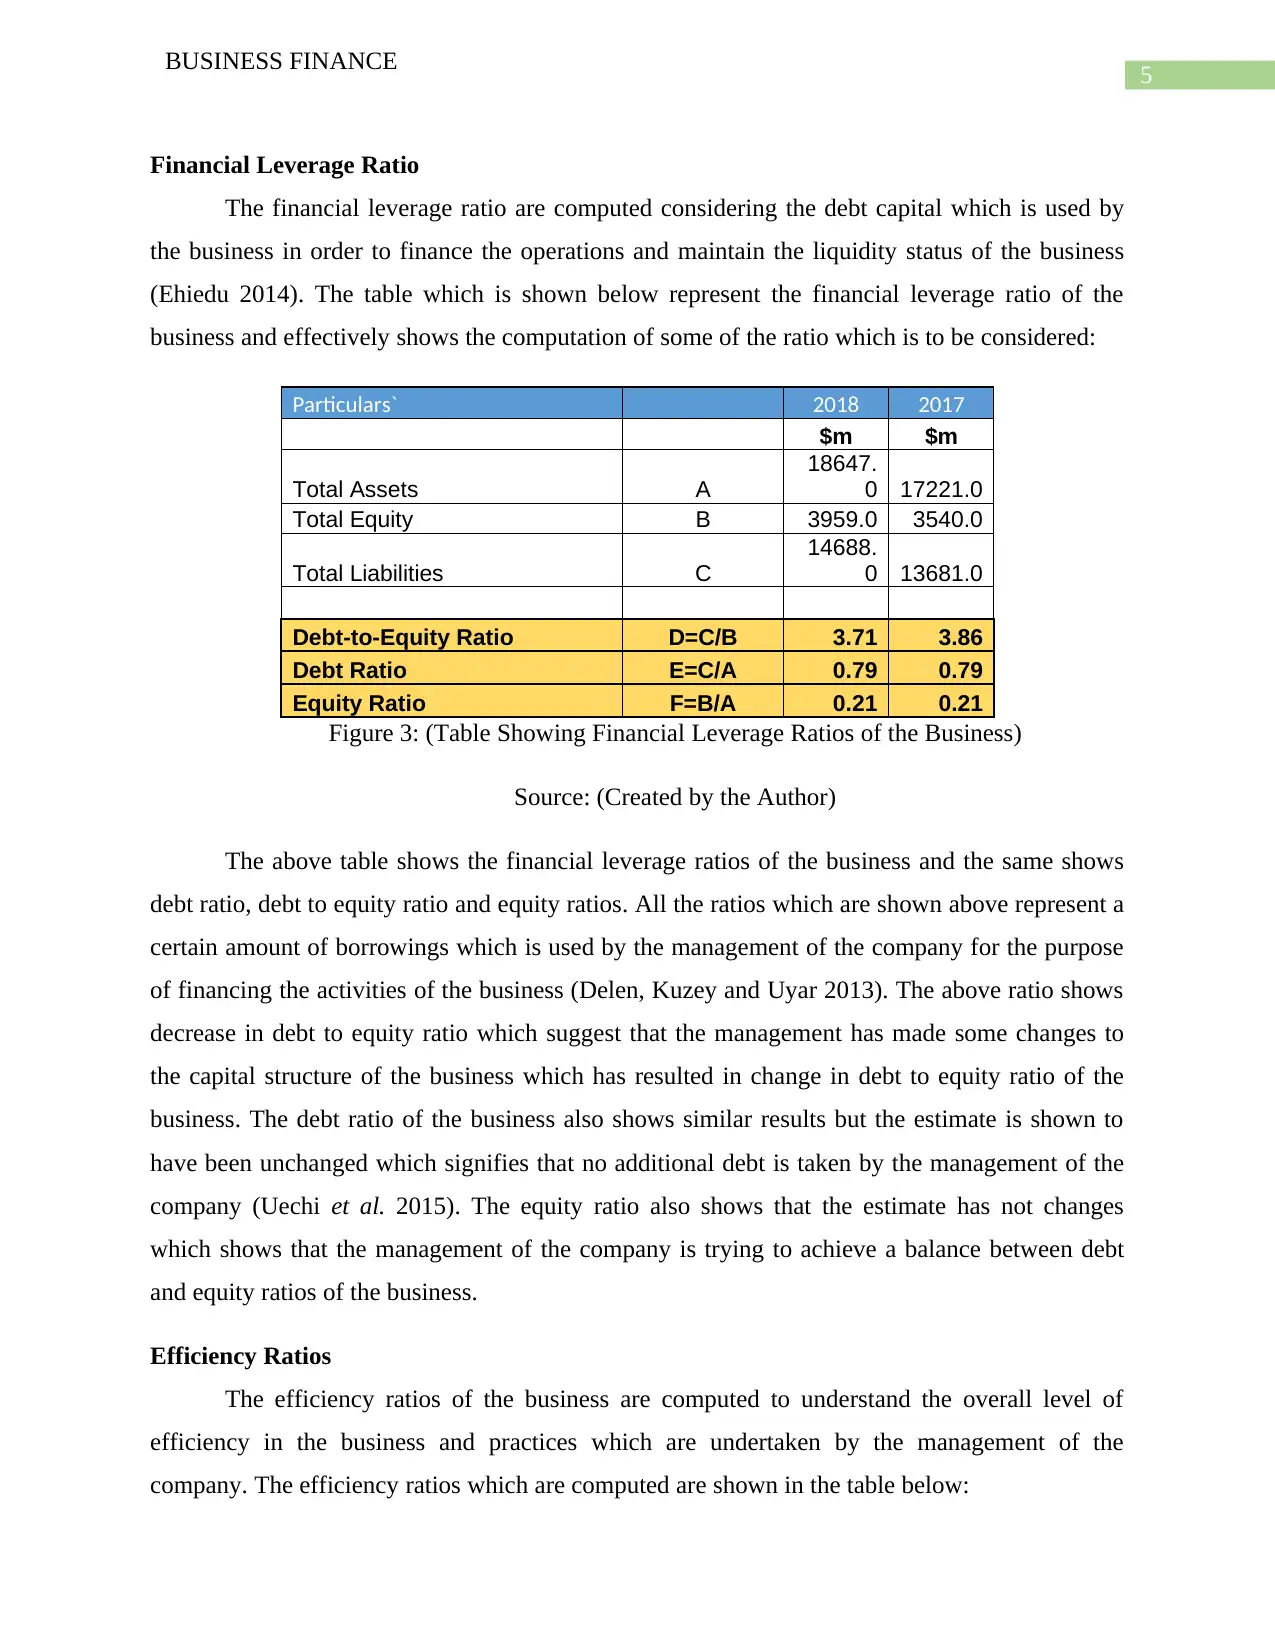
Financial Leverage Ratio
The financial leverage ratio are computed considering the debt capital which is used by
the business in order to finance the operations and maintain the liquidity status of the business
(Ehiedu 2014). The table which is shown below represent the financial leverage ratio of the
business and effectively shows the computation of some of the ratio which is to be considered:
Particulars` 2018 2017
$m $m
Total Assets A
18647.
0 17221.0
Total Equity B 3959.0 3540.0
Total Liabilities C
14688.
0 13681.0
Debt-to-Equity Ratio D=C/B 3.71 3.86
Debt Ratio E=C/A 0.79 0.79
Equity Ratio F=B/A 0.21 0.21
Figure 3: (Table Showing Financial Leverage Ratios of the Business)
Source: (Created by the Author)
The above table shows the financial leverage ratios of the business and the same shows
debt ratio, debt to equity ratio and equity ratios. All the ratios which are shown above represent a
certain amount of borrowings which is used by the management of the company for the purpose
of financing the activities of the business (Delen, Kuzey and Uyar 2013). The above ratio shows
decrease in debt to equity ratio which suggest that the management has made some changes to
the capital structure of the business which has resulted in change in debt to equity ratio of the
business. The debt ratio of the business also shows similar results but the estimate is shown to
have been unchanged which signifies that no additional debt is taken by the management of the
company (Uechi et al. 2015). The equity ratio also shows that the estimate has not changes
which shows that the management of the company is trying to achieve a balance between debt
and equity ratios of the business.
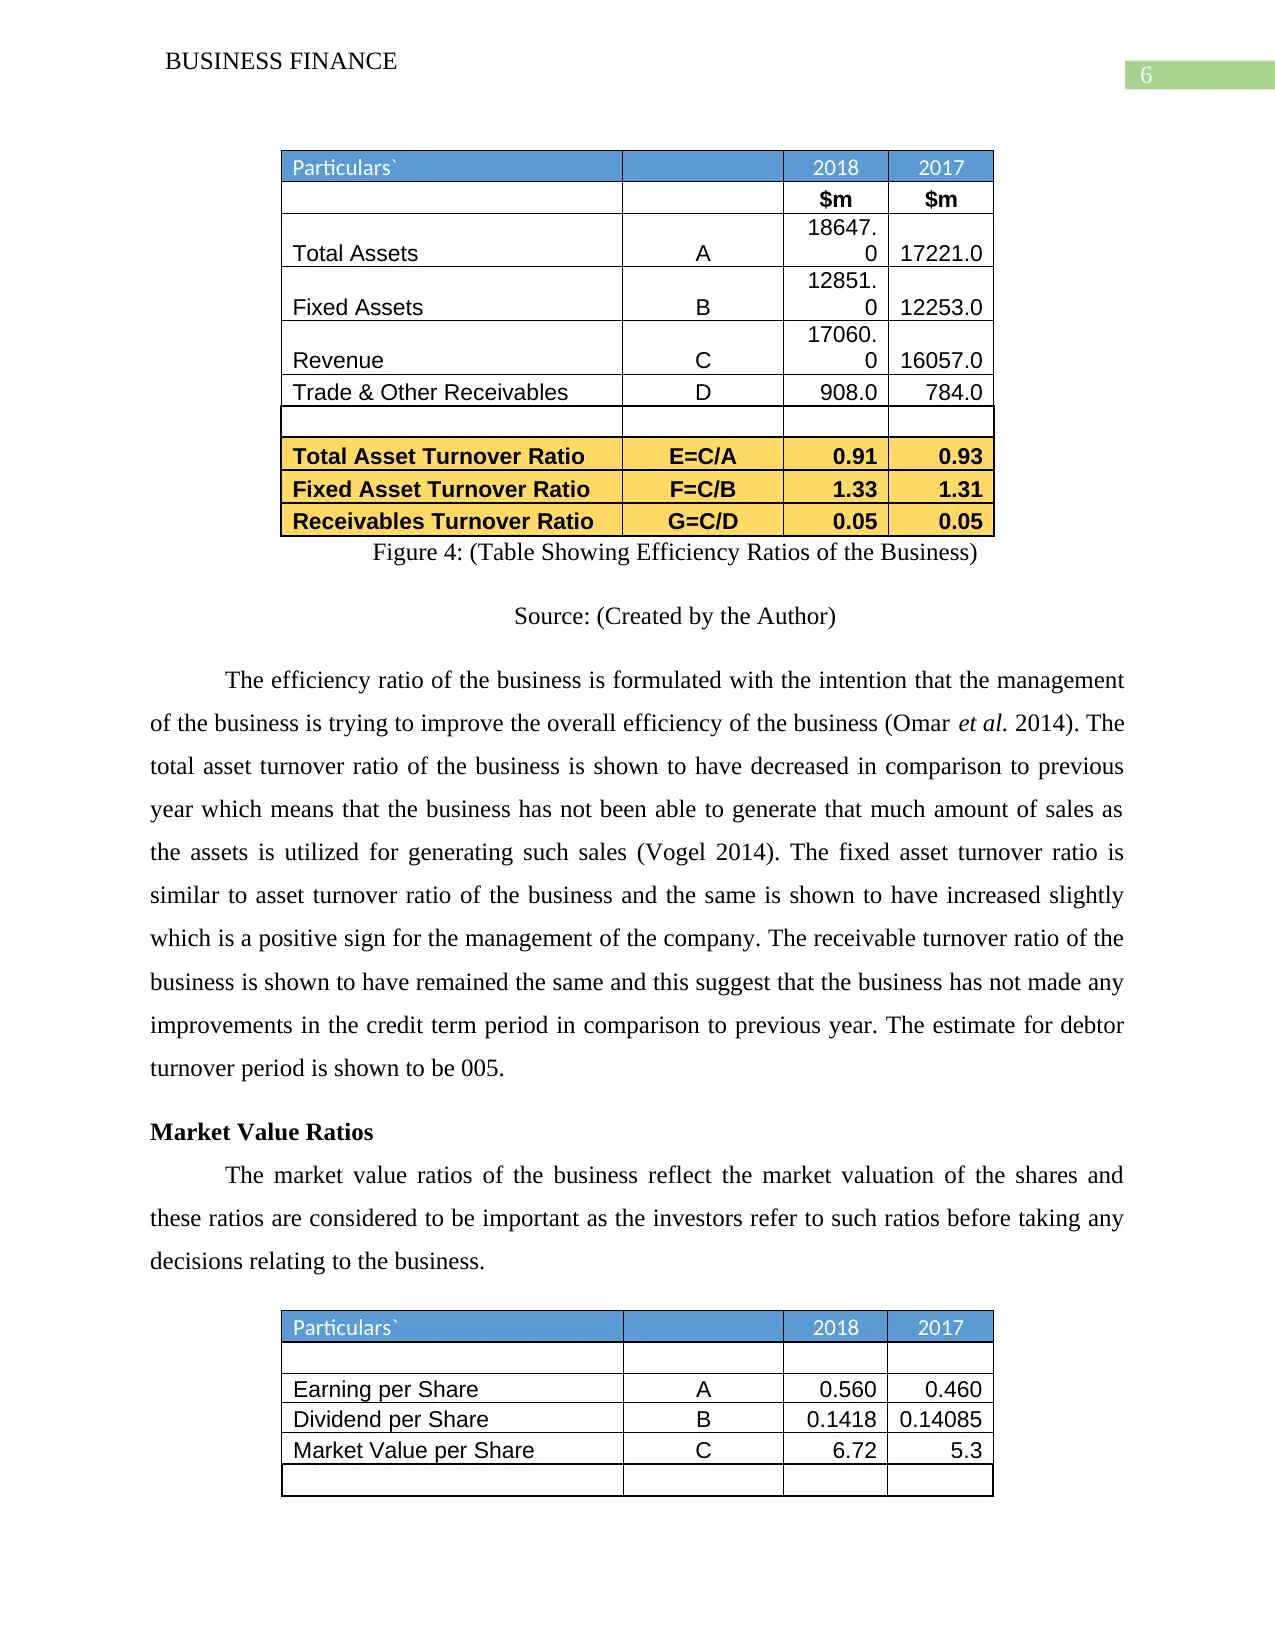
Efficiency Ratios
The efficiency ratios of the business are computed to understand the overall level of
efficiency in the business and practices which are undertaken by the management of the
company. The efficiency ratios which are computed are shown in the table below:
BUSINESS FINANCE
Financial Leverage Ratio
The financial leverage ratio are computed considering the debt capital which is used by
the business in order to finance the operations and maintain the liquidity status of the business
(Ehiedu 2014). The table which is shown below represent the financial leverage ratio of the
business and effectively shows the computation of some of the ratio which is to be considered:
Particulars` 2018 2017
$m $m
Total Assets A
18647.
0 17221.0
Total Equity B 3959.0 3540.0
Total Liabilities C
14688.
0 13681.0
Debt-to-Equity Ratio D=C/B 3.71 3.86
Debt Ratio E=C/A 0.79 0.79
Equity Ratio F=B/A 0.21 0.21
Figure 3: (Table Showing Financial Leverage Ratios of the Business)
Source: (Created by the Author)
The above table shows the financial leverage ratios of the business and the same shows
debt ratio, debt to equity ratio and equity ratios. All the ratios which are shown above represent a
certain amount of borrowings which is used by the management of the company for the purpose
of financing the activities of the business (Delen, Kuzey and Uyar 2013). The above ratio shows
decrease in debt to equity ratio which suggest that the management has made some changes to
the capital structure of the business which has resulted in change in debt to equity ratio of the
business. The debt ratio of the business also shows similar results but the estimate is shown to
have been unchanged which signifies that no additional debt is taken by the management of the
company (Uechi et al. 2015). The equity ratio also shows that the estimate has not changes
which shows that the management of the company is trying to achieve a balance between debt
and equity ratios of the business.
Efficiency Ratios
The efficiency ratios of the business are computed to understand the overall level of
efficiency in the business and practices which are undertaken by the management of the
company. The efficiency ratios which are computed are shown in the table below:
⊘ This is a preview!⊘
Do you want full access?
Subscribe today to unlock all pages.
Trusted by 1+ million students worldwide
6
BUSINESS FINANCE
Particulars` 2018 2017
$m $m
Total Assets A
18647.
0 17221.0
Fixed Assets B
12851.
0 12253.0
Revenue C
17060.
0 16057.0
Trade & Other Receivables D 908.0 784.0
Total Asset Turnover Ratio E=C/A 0.91 0.93
Fixed Asset Turnover Ratio F=C/B 1.33 1.31
Receivables Turnover Ratio G=C/D 0.05 0.05
Figure 4: (Table Showing Efficiency Ratios of the Business)
Source: (Created by the Author)
The efficiency ratio of the business is formulated with the intention that the management
of the business is trying to improve the overall efficiency of the business (Omar et al. 2014). The
total asset turnover ratio of the business is shown to have decreased in comparison to previous
year which means that the business has not been able to generate that much amount of sales as
the assets is utilized for generating such sales (Vogel 2014). The fixed asset turnover ratio is
similar to asset turnover ratio of the business and the same is shown to have increased slightly
which is a positive sign for the management of the company. The receivable turnover ratio of the
business is shown to have remained the same and this suggest that the business has not made any
improvements in the credit term period in comparison to previous year. The estimate for debtor
turnover period is shown to be 005.
Market Value Ratios
The market value ratios of the business reflect the market valuation of the shares and
these ratios are considered to be important as the investors refer to such ratios before taking any
decisions relating to the business.
Particulars` 2018 2017
Earning per Share A 0.560 0.460
Dividend per Share B 0.1418 0.14085
Market Value per Share C 6.72 5.3
Paraphrase This Document
Need a fresh take? Get an instant paraphrase of this document with our AI Paraphraser
7
BUSINESS FINANCE
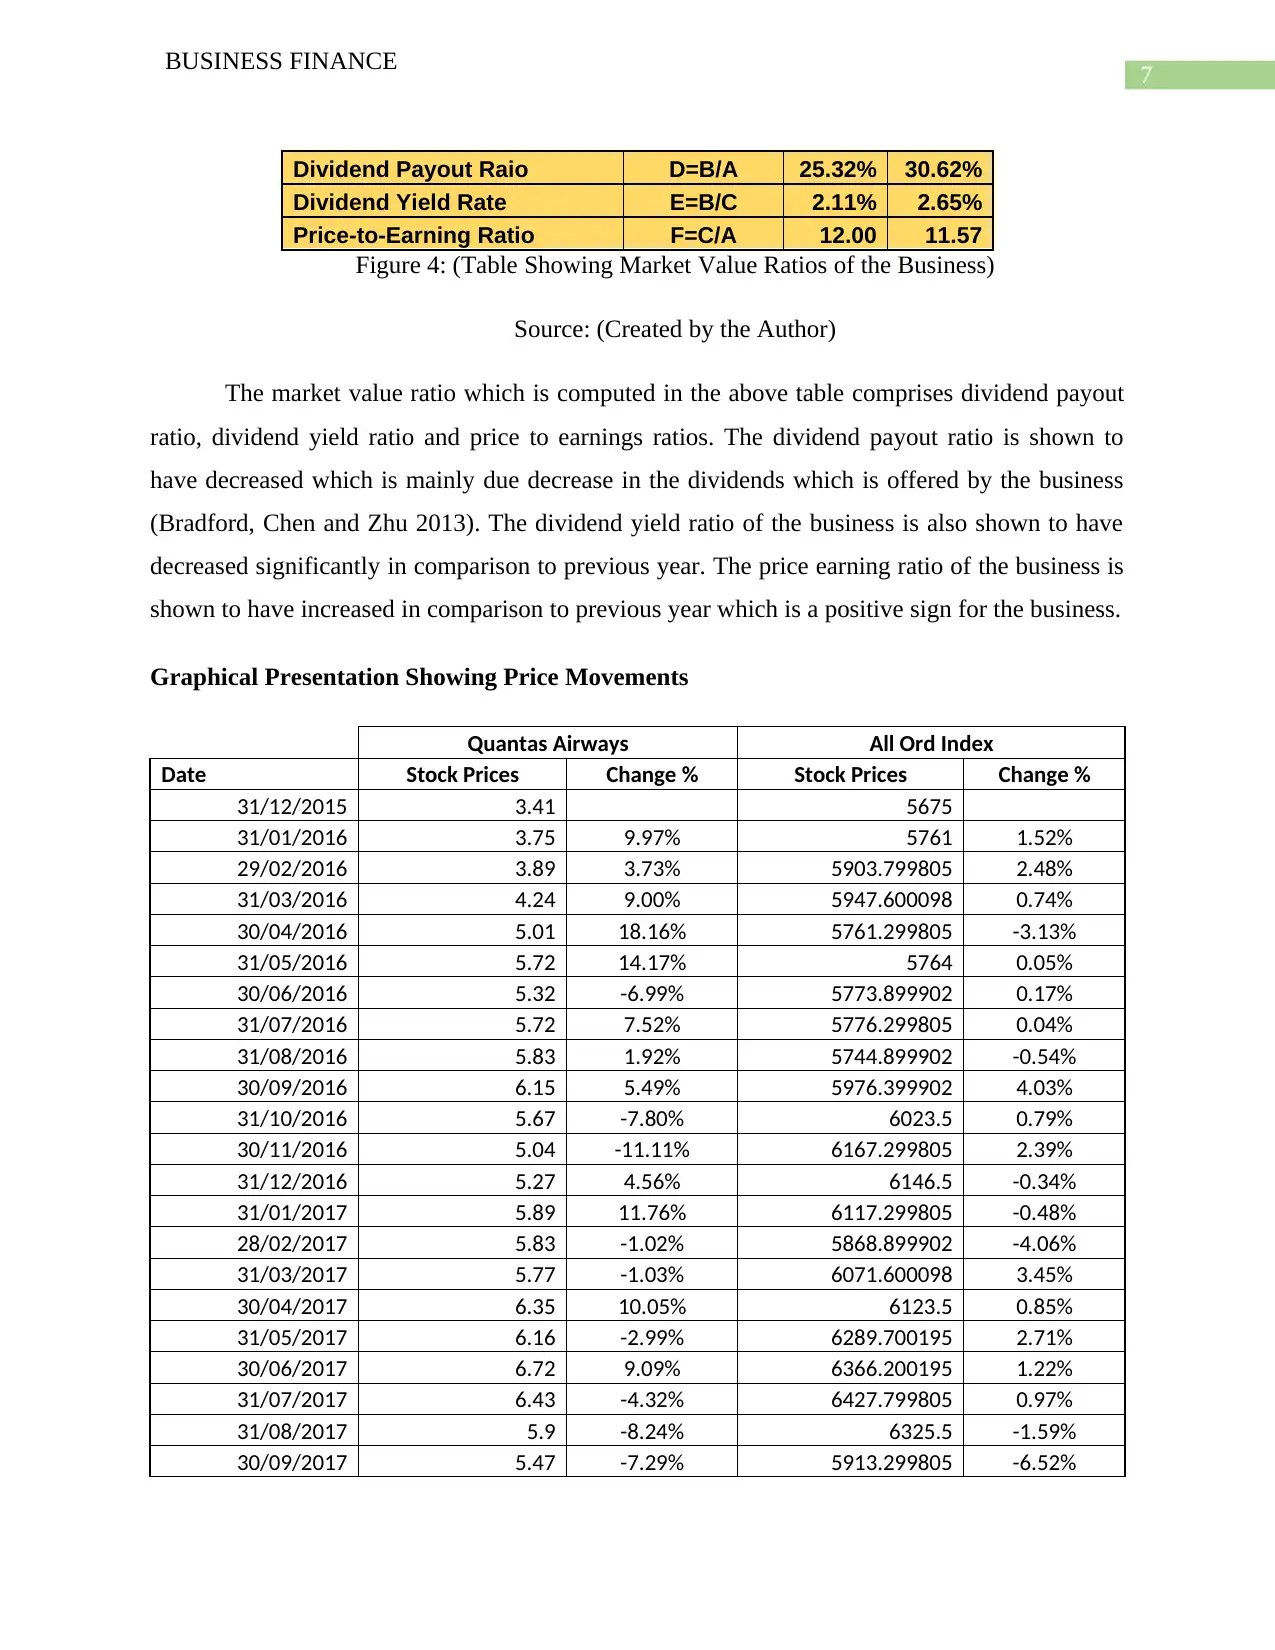
Dividend Payout Raio D=B/A 25.32% 30.62%
Dividend Yield Rate E=B/C 2.11% 2.65%
Price-to-Earning Ratio F=C/A 12.00 11.57
Figure 4: (Table Showing Market Value Ratios of the Business)
Source: (Created by the Author)
The market value ratio which is computed in the above table comprises dividend payout
ratio, dividend yield ratio and price to earnings ratios. The dividend payout ratio is shown to
have decreased which is mainly due decrease in the dividends which is offered by the business
(Bradford, Chen and Zhu 2013). The dividend yield ratio of the business is also shown to have
decreased significantly in comparison to previous year. The price earning ratio of the business is
shown to have increased in comparison to previous year which is a positive sign for the business.
Graphical Presentation Showing Price Movements
Quantas Airways All Ord Index
Date Stock Prices Change % Stock Prices Change %
31/12/2015 3.41 5675
31/01/2016 3.75 9.97% 5761 1.52%
29/02/2016 3.89 3.73% 5903.799805 2.48%
31/03/2016 4.24 9.00% 5947.600098 0.74%
30/04/2016 5.01 18.16% 5761.299805 -3.13%
31/05/2016 5.72 14.17% 5764 0.05%
30/06/2016 5.32 -6.99% 5773.899902 0.17%
31/07/2016 5.72 7.52% 5776.299805 0.04%
31/08/2016 5.83 1.92% 5744.899902 -0.54%
30/09/2016 6.15 5.49% 5976.399902 4.03%
31/10/2016 5.67 -7.80% 6023.5 0.79%
30/11/2016 5.04 -11.11% 6167.299805 2.39%
31/12/2016 5.27 4.56% 6146.5 -0.34%
31/01/2017 5.89 11.76% 6117.299805 -0.48%
28/02/2017 5.83 -1.02% 5868.899902 -4.06%
31/03/2017 5.77 -1.03% 6071.600098 3.45%
30/04/2017 6.35 10.05% 6123.5 0.85%
31/05/2017 6.16 -2.99% 6289.700195 2.71%
30/06/2017 6.72 9.09% 6366.200195 1.22%
31/07/2017 6.43 -4.32% 6427.799805 0.97%
31/08/2017 5.9 -8.24% 6325.5 -1.59%
30/09/2017 5.47 -7.29% 5913.299805 -6.52%
BUSINESS FINANCE
Dividend Payout Raio D=B/A 25.32% 30.62%
Dividend Yield Rate E=B/C 2.11% 2.65%
Price-to-Earning Ratio F=C/A 12.00 11.57
Figure 4: (Table Showing Market Value Ratios of the Business)
Source: (Created by the Author)
The market value ratio which is computed in the above table comprises dividend payout
ratio, dividend yield ratio and price to earnings ratios. The dividend payout ratio is shown to
have decreased which is mainly due decrease in the dividends which is offered by the business
(Bradford, Chen and Zhu 2013). The dividend yield ratio of the business is also shown to have
decreased significantly in comparison to previous year. The price earning ratio of the business is
shown to have increased in comparison to previous year which is a positive sign for the business.
Graphical Presentation Showing Price Movements
Quantas Airways All Ord Index
Date Stock Prices Change % Stock Prices Change %
31/12/2015 3.41 5675
31/01/2016 3.75 9.97% 5761 1.52%
29/02/2016 3.89 3.73% 5903.799805 2.48%
31/03/2016 4.24 9.00% 5947.600098 0.74%
30/04/2016 5.01 18.16% 5761.299805 -3.13%
31/05/2016 5.72 14.17% 5764 0.05%
30/06/2016 5.32 -6.99% 5773.899902 0.17%
31/07/2016 5.72 7.52% 5776.299805 0.04%
31/08/2016 5.83 1.92% 5744.899902 -0.54%
30/09/2016 6.15 5.49% 5976.399902 4.03%
31/10/2016 5.67 -7.80% 6023.5 0.79%
30/11/2016 5.04 -11.11% 6167.299805 2.39%
31/12/2016 5.27 4.56% 6146.5 -0.34%
31/01/2017 5.89 11.76% 6117.299805 -0.48%
28/02/2017 5.83 -1.02% 5868.899902 -4.06%
31/03/2017 5.77 -1.03% 6071.600098 3.45%
30/04/2017 6.35 10.05% 6123.5 0.85%
31/05/2017 6.16 -2.99% 6289.700195 2.71%
30/06/2017 6.72 9.09% 6366.200195 1.22%
31/07/2017 6.43 -4.32% 6427.799805 0.97%
31/08/2017 5.9 -8.24% 6325.5 -1.59%
30/09/2017 5.47 -7.29% 5913.299805 -6.52%
8
BUSINESS FINANCE
31/10/2017 5.96 8.96% 5749.299805 -2.77%
30/11/2017 5.82 -2.35% 5716 -0.58%
31/12/2017 5.82 0.00% 5716 0.00%
5.82
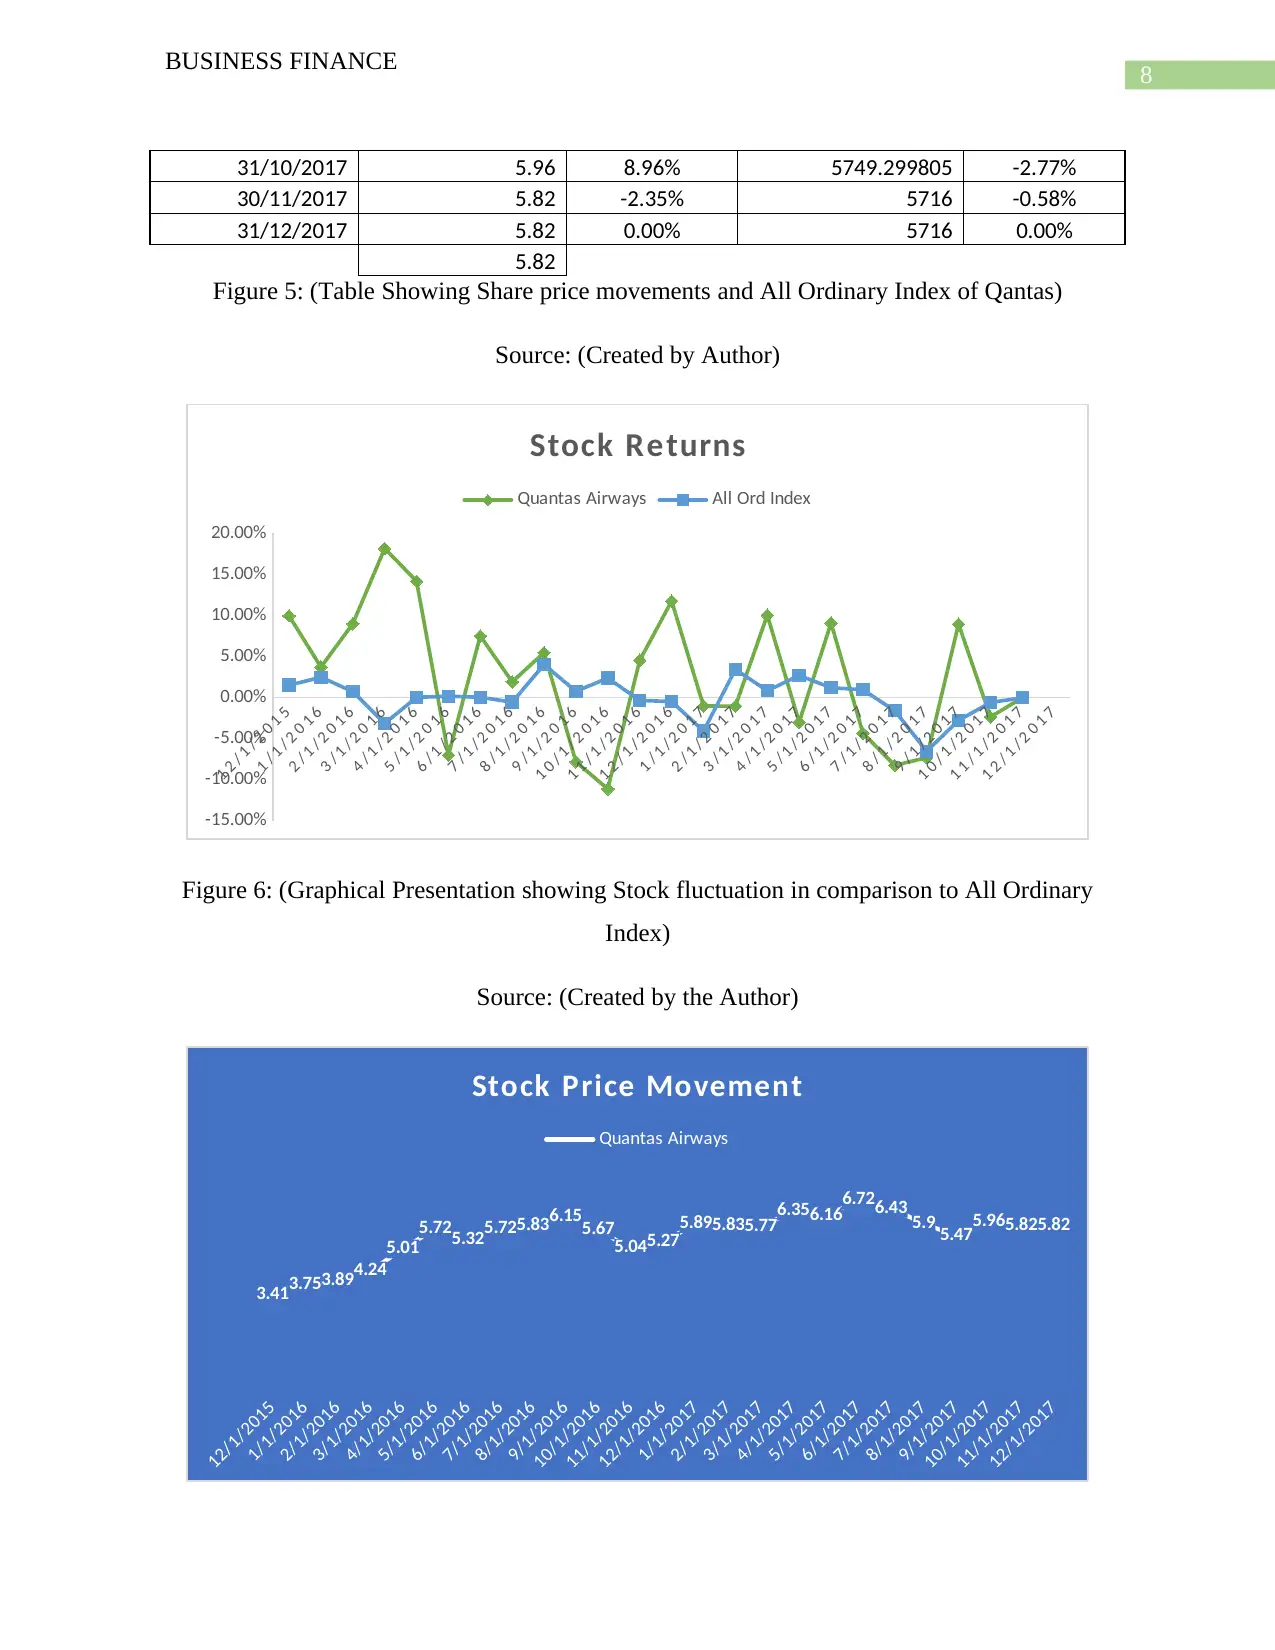
Figure 5: (Table Showing Share price movements and All Ordinary Index of Qantas)
Source: (Created by Author)
1 2 / 1 / 2 0 1 5
1 / 1 / 2 0 1 6
2 / 1 / 2 0 1 6
3 / 1 / 2 0 1 6
4 / 1 / 2 0 1 6
5 / 1 / 2 0 1 6
6 / 1 / 2 0 1 6
7 / 1 / 2 0 1 6
8 / 1 / 2 0 1 6
9 / 1 / 2 0 1 6
1 0 / 1 / 2 0 1 6
1 1 / 1 / 2 0 1 6
1 2 / 1 / 2 0 1 6
1 / 1 / 2 0 1 7
2 / 1 / 2 0 1 7
3 / 1 / 2 0 1 7
4 / 1 / 2 0 1 7
5 / 1 / 2 0 1 7
6 / 1 / 2 0 1 7
7 / 1 / 2 0 1 7
8 / 1 / 2 0 1 7
9 / 1 / 2 0 1 7
1 0 / 1 / 2 0 1 7
1 1 / 1 / 2 0 1 7
1 2 / 1 / 2 0 1 7
-15.00%
-10.00%
-5.00%
0.00%
5.00%
10.00%
15.00%
20.00%
Stock Returns
Quantas Airways All Ord Index
Figure 6: (Graphical Presentation showing Stock fluctuation in comparison to All Ordinary
Index)
Source: (Created by the Author)
12/1/2015
1/1/2016
2/1/2016
3/1/2016
4/1/2016
5/1/2016
6/1/2016
7/1/2016
8/1/2016
9/1/2016
10/1/2016
11/1/2016
12/1/2016
1/1/2017
2/1/2017
3/1/2017
4/1/2017
5/1/2017
6/1/2017
7/1/2017
8/1/2017
9/1/2017
10/1/2017
11/1/2017
12/1/2017
3.413.753.894.24
5.01
5.725.325.725.836.155.675.045.275.895.835.776.356.166.726.43 5.9 5.475.965.825.82
Stock Price Movement
Quantas Airways
BUSINESS FINANCE
31/10/2017 5.96 8.96% 5749.299805 -2.77%
30/11/2017 5.82 -2.35% 5716 -0.58%
31/12/2017 5.82 0.00% 5716 0.00%
5.82
Figure 5: (Table Showing Share price movements and All Ordinary Index of Qantas)
Source: (Created by Author)
1 2 / 1 / 2 0 1 5
1 / 1 / 2 0 1 6
2 / 1 / 2 0 1 6
3 / 1 / 2 0 1 6
4 / 1 / 2 0 1 6
5 / 1 / 2 0 1 6
6 / 1 / 2 0 1 6
7 / 1 / 2 0 1 6
8 / 1 / 2 0 1 6
9 / 1 / 2 0 1 6
1 0 / 1 / 2 0 1 6
1 1 / 1 / 2 0 1 6
1 2 / 1 / 2 0 1 6
1 / 1 / 2 0 1 7
2 / 1 / 2 0 1 7
3 / 1 / 2 0 1 7
4 / 1 / 2 0 1 7
5 / 1 / 2 0 1 7
6 / 1 / 2 0 1 7
7 / 1 / 2 0 1 7
8 / 1 / 2 0 1 7
9 / 1 / 2 0 1 7
1 0 / 1 / 2 0 1 7
1 1 / 1 / 2 0 1 7
1 2 / 1 / 2 0 1 7
-15.00%
-10.00%
-5.00%
0.00%
5.00%
10.00%
15.00%
20.00%
Stock Returns
Quantas Airways All Ord Index
Figure 6: (Graphical Presentation showing Stock fluctuation in comparison to All Ordinary
Index)
Source: (Created by the Author)
12/1/2015
1/1/2016
2/1/2016
3/1/2016
4/1/2016
5/1/2016
6/1/2016
7/1/2016
8/1/2016
9/1/2016
10/1/2016
11/1/2016
12/1/2016
1/1/2017
2/1/2017
3/1/2017
4/1/2017
5/1/2017
6/1/2017
7/1/2017
8/1/2017
9/1/2017
10/1/2017
11/1/2017
12/1/2017
3.413.753.894.24
5.01
5.725.325.725.836.155.675.045.275.895.835.776.356.166.726.43 5.9 5.475.965.825.82
Stock Price Movement
Quantas Airways
⊘ This is a preview!⊘
Do you want full access?
Subscribe today to unlock all pages.
Trusted by 1+ million students worldwide
9
BUSINESS FINANCE
The above figures show the fluctuation in the stock prices of the business and the same is
to be compared with the All Ordinary Indexes. The table above shows that the fluctuations in the
shares prices of Qantas ltd for the year 2018 (Finance.yahoo.com. 2018). The movement in the
share price of the business is plotted in the graph above in order to show changes in the shares
prices due with respect to changes in the all ordinary index (Au.finance.yahoo.com.2018). The
graph portrays that the share price of the company has fluctuated in the two years period which is
shown in the graph above.
The graphical movement of stock prices which is depicted in the graph above of Qantas
ltd shows that the fluctuation in prices are on a random basis which suggest that the stock is
volatile in nature. The line of stock for the business of Qantas ltd is shown to be fluctuation and
is sometimes above the all ordinary indexes and sometimes the same is shown to be below the all
ordinary indexes.
The share prices of Qantas ltd is affected by the hike in the prices of fuel which has
further increased the costs of airline fares of the business and thereby the same has affected the
share prices of the business. The business of Qantas airways is also affected by the regulations
which are applicable on such companies operating in Australia. The shares prices of the business
is also affected by the intense competition which is faced by the business with other companies.
Calculation of Beta and Required Rate of Return under CAPM
Computation of Required Rate of Return for Qantas ltd
Particulars Amount
Beta of the company A 1
Risk Free Rate B 6%
Market Risk Premium C 7%
Required Rate of
Return D=B+[AxC] 13.00%
Figure 7: (Table Showing Beta of the Business)
Source: (Created by the Author)
Paraphrase This Document
Need a fresh take? Get an instant paraphrase of this document with our AI Paraphraser
10
BUSINESS FINANCE
The above table shows the computation of required rate of return on the business and for
this purpose the beta which represent the level of risks which is associated with the business is
shown to be 1 while the risk-free rate of return and market risk premium is shown to be 6% and
7% respectively. The required rate of return for the business is shown to be 13% and the same is
computed considering the shares of the business (Brotherson et al. 2015).
Capital structure of the Business
The WACC of the business is considered to be an important tool for estimating the
expected cost which is involved in financing the overall resources of the business
(Mohammadzadeh et al. 2013). In other words, the WACC of the business represent the overall
cost of capital and can be stated as a measure of the expenditure which the business needs to
incur for the purpose of raising one added dollar of money.
Particulars Amount Weightage Cost
Return
Rate
Tax
Rate WACC
Total Long Term Debt 4,344 52.32% 3.4 0.08% 30.00% 0.03%
Total Equity 3959 47.68% 13.00% 6.20%
TOTAL 8303 100% 6.23%
Figure 8: (Table Showing Computation of WACC of the Business)
Source: (Created by the Author)
The overall cost of the business is computed considering the total debt capital and total
equity of the business (Cheynel 2013). The WACC of the business is shown to be 6.23% and the
same is computed considering the debt and equity capital of the business (Danis, Rettl and
Whited 2014). The Rate of return which is considered in the above table is shown to be 13%.
Recommendations
The following recommendation can be suggested to the management of Qantas ltd for the
purpose of improving the financial performance of the business. The recommendation which can
be suggested to the management are listed below:
11
BUSINESS FINANCE
The management needs to control the costs of the business in order to enhance the
profitability of the business. The costs of the business, if appropriately control can
enhance the productivity and profitability of the business.
The management of the business needs to improve the liquidity of the business which is a
serious matter of concern for the business. The management needs to take up finances for
the purpose of financing different projects of the business.
The management needs to improve the internal control of the business so that the
business can enhance the efficiency of the business.
Conclusion
The above discussion effectively shows the analysis of financial performance of Qantas
ltd and the same is shown with the help of key financial ratios of the business. The key ratios are
computed considering the financial statements of the business. The assessment also evaluates the
volatility in the stock prices of the business by considering the all ordinary index and making
comparison with the same. The capital structure of the business is formed in such a way that the
maximum portion is covered by equity capital rather than debt capital. The liquidity ratios of the
business need to be improved by the management of the company in order to ensure that the
management of the company is able to finance any project. In addition to this, the market
valuation of the business needs to be improved which can be done by effectively managing the
risks of the business.
Reference
Au.finance.yahoo.com. (2018). Yahoo is now a part of Oath. [online] Available at:
https://au.finance.yahoo.com/quote/%5EAORD/history?
⊘ This is a preview!⊘
Do you want full access?
Subscribe today to unlock all pages.
Trusted by 1+ million students worldwide
1 out of 17
Related Documents


Your All-in-One AI-Powered Toolkit for Academic Success.
+13062052269
info@desklib.com
Available 24*7 on WhatsApp / Email
![[object Object]](/_next/static/media/star-bottom.7253800d.svg)
Unlock your academic potential
Copyright © 2020–2026 A2Z Services. All Rights Reserved. Developed and managed by ZUCOL.