Financial Analysis: Qantas Airways and Alliance Aviation Services
VerifiedAdded on 2020/12/29
|18
|5018
|115
Report
AI Summary
This report provides a comprehensive analysis of the corporate accounting practices of Qantas Airways Limited and Alliance Aviation Services Limited, both listed on the Australian Securities Exchange. It examines changes in owner's equity, providing a comparative analysis of debt and equity positions. The report delves into the cash flow statements, analyzing changes in cash flow items over the past years and comparing the broad categories of cash flow. It also explores the other comprehensive income statement, detailing its items and reasons for not including them in the profit and loss statement, along with a comparative analysis. Furthermore, the report investigates accounting for corporate income tax, including tax expenses, effective tax rates, deferred tax assets and liabilities, and cash tax calculations. The analysis includes detailed tables and interpretations, offering insights into the financial performance and capital structure of both companies. The report concludes by summarizing key findings and comparing book and cash tax rates.
CORPORATE ACCOUNTING
Paraphrase This Document
Need a fresh take? Get an instant paraphrase of this document with our AI Paraphraser
EXECUTIVE SUMMARY
Corporate accounting can be termed as the major branch which directly deals with
organization's system, preparation of financial statements with its appropriate analysis and
interpretation of fiscal outcomes. The present report will discuss about two public limited
companies which are listed on Australian Securities Exchange as Qantas Airways Limited and
Alliance Aviation Services Limited. Further, it had been stated that, cash flow statement is
classified in three broad categories in which operating section plays major role for generating
cash. It could be elaborated that, actual profit could be attained through adjusting other
comprehensive income statement. Further, it could be summed by reflecting corporate income
tax which plays very efficient role for absorbing effective tax rate, cash tax rate and cash tax
amount.
TABLE OF CONTENTS
INTRODUCTION...........................................................................................................................1
OWNER'S EQUITY........................................................................................................................1
1. Discussing changes in each component of equity...................................................................1
2. Providing comparative analysis of debt and equity position of both the firms.......................2
CASH FLOW STATEMENT..........................................................................................................4
3. Discussing changes in cash flow items over the past years....................................................4
4. Comparative analysis of broad categories of cash flow statement.........................................5
5. Comparison of both companies from the above analysis........................................................7
OTHER COMPREHENSIVE INCOME STATEMENT................................................................7
6. Stating items of other comprehensive income statement of both organization......................7
7. Reason for not including items in Profit and Loss statement..................................................8
8. Comparative analysis of other comprehensive income statement..........................................8
9. Performance evaluation must be considered in other comprehensive income (OCI)...........10
ACCOUNTING FOR CORPORATE INCOME TAX..................................................................11
10. Stating tax expenses of both organization...........................................................................11
11. Calculation of effective tax rate..........................................................................................11
12. Comment on deferred tax asset and liabilities....................................................................11
13. Presenting changes in deferred tax asset and liabilities......................................................12
14. Calculating cash tax amount with book tax, deferred tax asset and liabilities....................13
15. Calculating cash tax rate.....................................................................................................13
16. Providing difference among book and cash tax rate...........................................................14
CONCLUSION..............................................................................................................................14
REFERENCES..............................................................................................................................15
⊘ This is a preview!⊘
Do you want full access?
Subscribe today to unlock all pages.
Trusted by 1+ million students worldwide
INTRODUCTION
Corporate accounting can be termed as the major branch which directly deals with
organization's system, preparation of financial statements with its appropriate analysis and
interpretation of fiscal outcomes. The present report will discuss about two public limited
companies which are listed on Australian Securities Exchange as Qantas Airways Limited and
Alliance Aviation Services Limited. Both these organizations are comprised in transportation
industry. This report will state financial statements in detailed aspect with reference to owner's
equity and various alteration from past three years. It will provide comparative analysis of
capital structure of both organization. It will also articulate about cash flow statements and
classification of its broad categories in past three years. In the similar aspect, it would state items
of other comprehensive income statement and reason for not considering it in profit and loss
statement. This report will also show various working on corporate income tax with the latest
financial statements of both companies. It ill calculate effective tax rate and amount by stating
reasons of creating deferred tax asset and liability. Last but not least, it will conclude by stating
variations among cash tax and book tax rate.
OWNER'S EQUITY
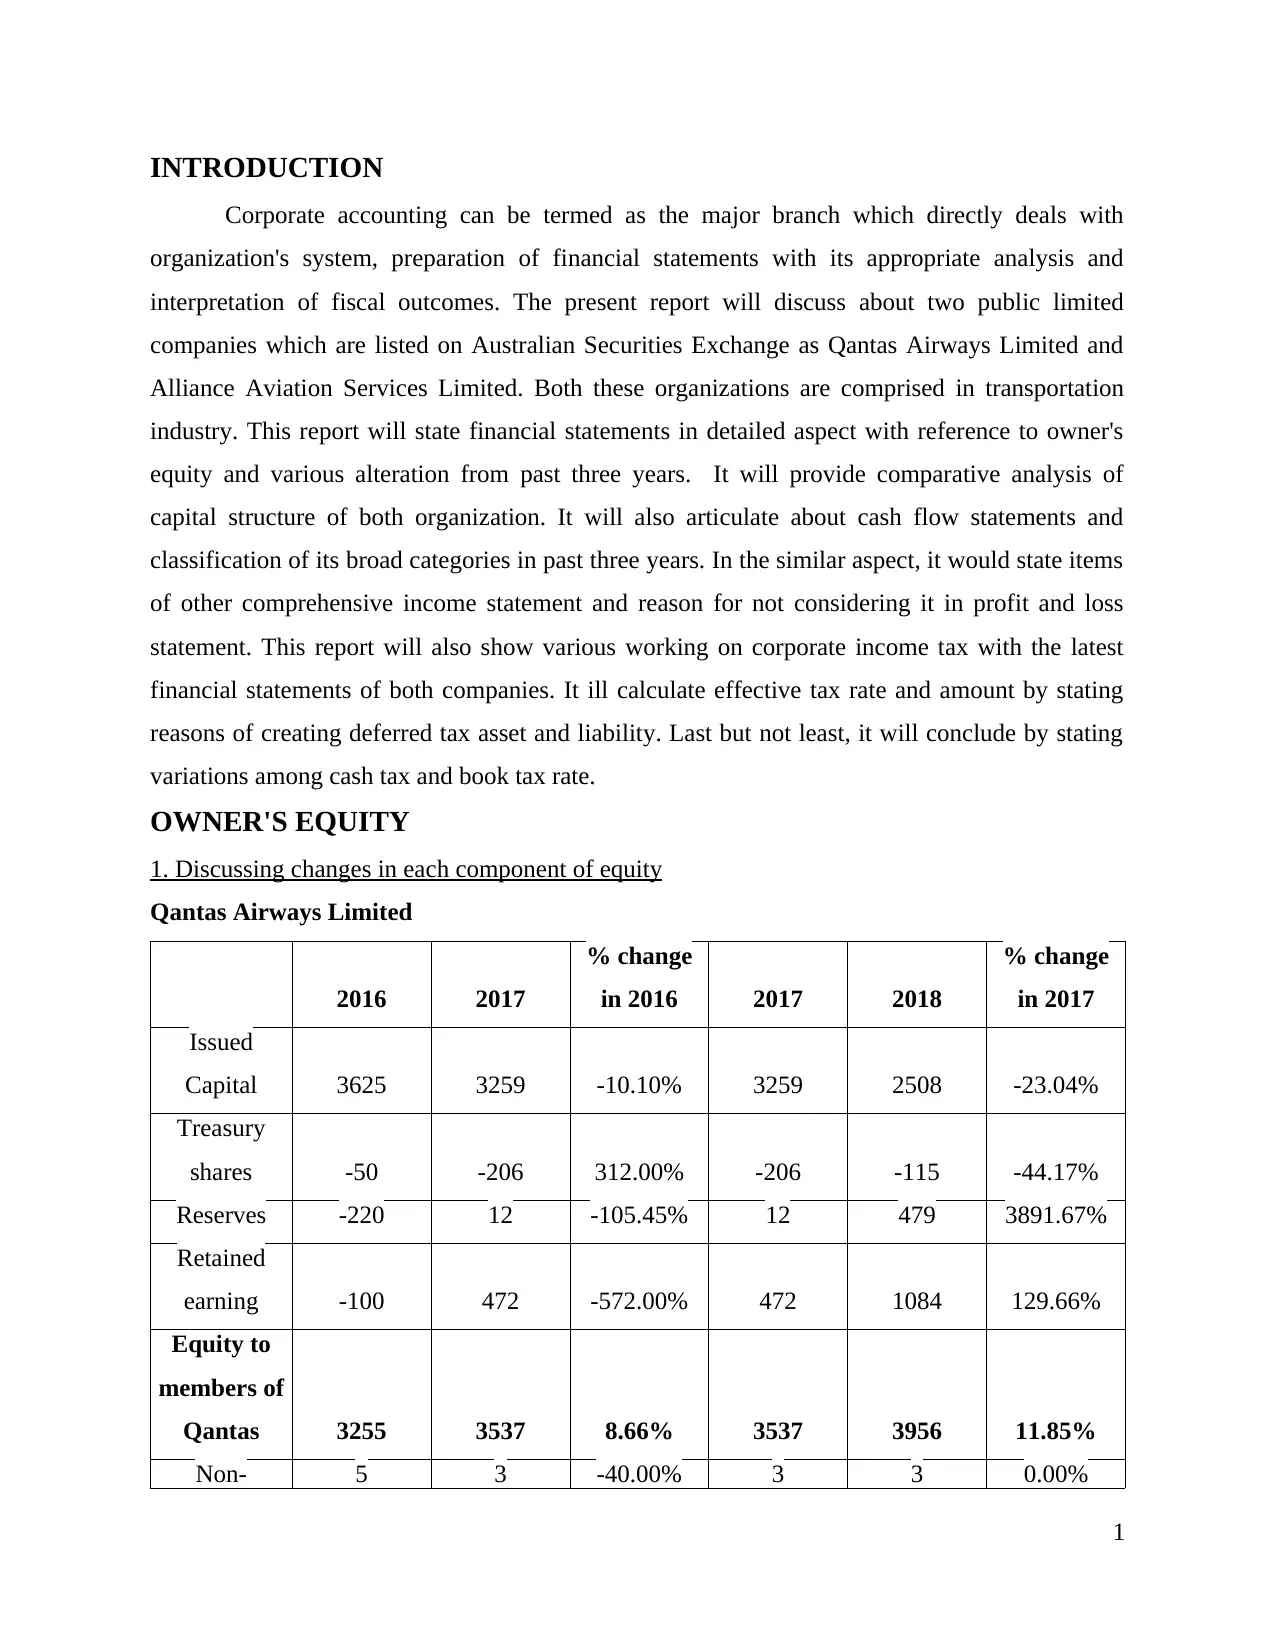
1. Discussing changes in each component of equity
Qantas Airways Limited
2016 2017
% change
in 2016 2017 2018
% change
in 2017
Issued
Capital 3625 3259 -10.10% 3259 2508 -23.04%
Treasury
shares -50 -206 312.00% -206 -115 -44.17%
Reserves -220 12 -105.45% 12 479 3891.67%
Retained
earning -100 472 -572.00% 472 1084 129.66%
Equity to
members of
Qantas 3255 3537 8.66% 3537 3956 11.85%
Non- 5 3 -40.00% 3 3 0.00%
1
Corporate accounting can be termed as the major branch which directly deals with
organization's system, preparation of financial statements with its appropriate analysis and
interpretation of fiscal outcomes. The present report will discuss about two public limited
companies which are listed on Australian Securities Exchange as Qantas Airways Limited and
Alliance Aviation Services Limited. Both these organizations are comprised in transportation
industry. This report will state financial statements in detailed aspect with reference to owner's
equity and various alteration from past three years. It will provide comparative analysis of
capital structure of both organization. It will also articulate about cash flow statements and
classification of its broad categories in past three years. In the similar aspect, it would state items
of other comprehensive income statement and reason for not considering it in profit and loss
statement. This report will also show various working on corporate income tax with the latest
financial statements of both companies. It ill calculate effective tax rate and amount by stating
reasons of creating deferred tax asset and liability. Last but not least, it will conclude by stating
variations among cash tax and book tax rate.
OWNER'S EQUITY
1. Discussing changes in each component of equity
Qantas Airways Limited
2016 2017
% change
in 2016 2017 2018
% change
in 2017
Issued
Capital 3625 3259 -10.10% 3259 2508 -23.04%
Treasury
shares -50 -206 312.00% -206 -115 -44.17%
Reserves -220 12 -105.45% 12 479 3891.67%
Retained
earning -100 472 -572.00% 472 1084 129.66%
Equity to
members of
Qantas 3255 3537 8.66% 3537 3956 11.85%
Non- 5 3 -40.00% 3 3 0.00%
1
Paraphrase This Document
Need a fresh take? Get an instant paraphrase of this document with our AI Paraphraser
controlling
interest
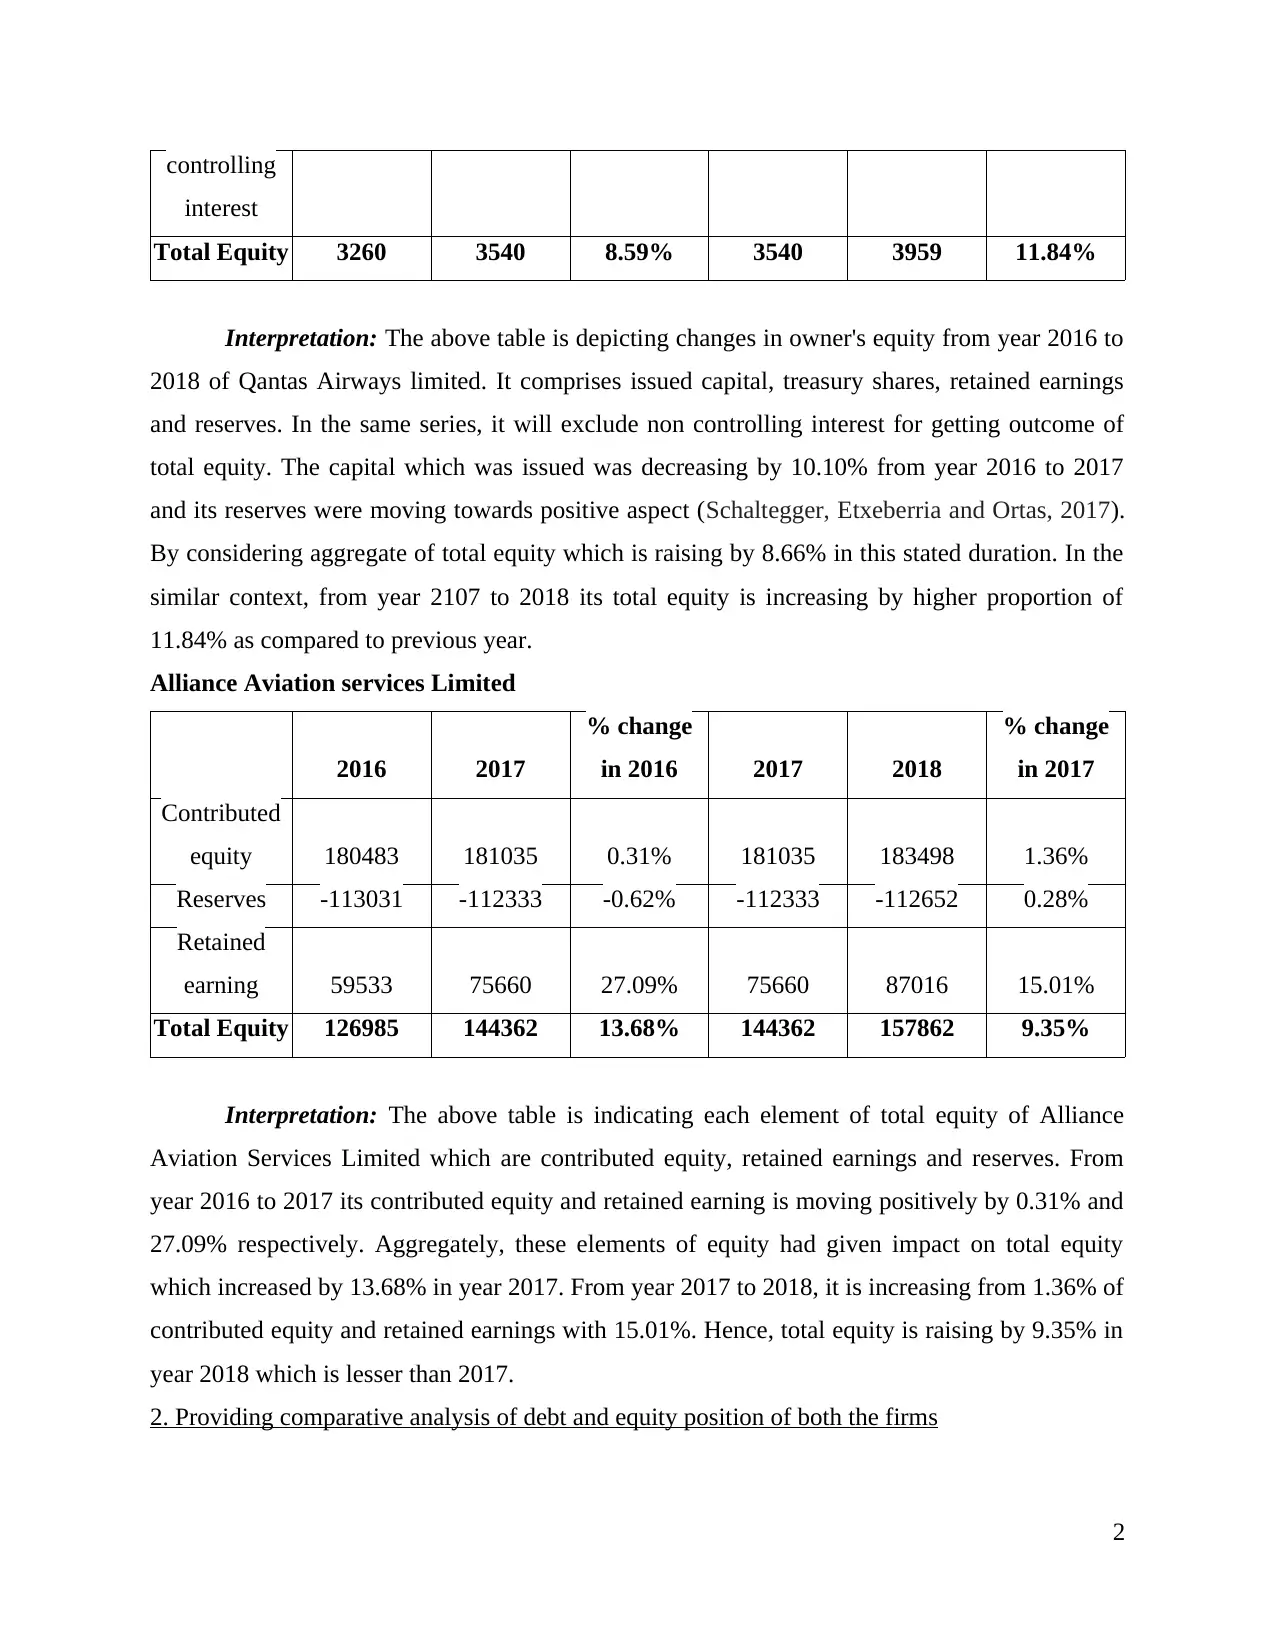
Total Equity 3260 3540 8.59% 3540 3959 11.84%
Interpretation: The above table is depicting changes in owner's equity from year 2016 to
2018 of Qantas Airways limited. It comprises issued capital, treasury shares, retained earnings
and reserves. In the same series, it will exclude non controlling interest for getting outcome of
total equity. The capital which was issued was decreasing by 10.10% from year 2016 to 2017
and its reserves were moving towards positive aspect (Schaltegger, Etxeberria and Ortas, 2017).
By considering aggregate of total equity which is raising by 8.66% in this stated duration. In the
similar context, from year 2107 to 2018 its total equity is increasing by higher proportion of
11.84% as compared to previous year.
Alliance Aviation services Limited
2016 2017
% change
in 2016 2017 2018
% change
in 2017
Contributed
equity 180483 181035 0.31% 181035 183498 1.36%
Reserves -113031 -112333 -0.62% -112333 -112652 0.28%
Retained
earning 59533 75660 27.09% 75660 87016 15.01%
Total Equity 126985 144362 13.68% 144362 157862 9.35%
Interpretation: The above table is indicating each element of total equity of Alliance
Aviation Services Limited which are contributed equity, retained earnings and reserves. From
year 2016 to 2017 its contributed equity and retained earning is moving positively by 0.31% and
27.09% respectively. Aggregately, these elements of equity had given impact on total equity
which increased by 13.68% in year 2017. From year 2017 to 2018, it is increasing from 1.36% of
contributed equity and retained earnings with 15.01%. Hence, total equity is raising by 9.35% in
year 2018 which is lesser than 2017.
2. Providing comparative analysis of debt and equity position of both the firms
2
interest
Total Equity 3260 3540 8.59% 3540 3959 11.84%
Interpretation: The above table is depicting changes in owner's equity from year 2016 to
2018 of Qantas Airways limited. It comprises issued capital, treasury shares, retained earnings
and reserves. In the same series, it will exclude non controlling interest for getting outcome of
total equity. The capital which was issued was decreasing by 10.10% from year 2016 to 2017
and its reserves were moving towards positive aspect (Schaltegger, Etxeberria and Ortas, 2017).
By considering aggregate of total equity which is raising by 8.66% in this stated duration. In the
similar context, from year 2107 to 2018 its total equity is increasing by higher proportion of
11.84% as compared to previous year.
Alliance Aviation services Limited
2016 2017
% change
in 2016 2017 2018
% change
in 2017
Contributed
equity 180483 181035 0.31% 181035 183498 1.36%
Reserves -113031 -112333 -0.62% -112333 -112652 0.28%
Retained
earning 59533 75660 27.09% 75660 87016 15.01%
Total Equity 126985 144362 13.68% 144362 157862 9.35%
Interpretation: The above table is indicating each element of total equity of Alliance
Aviation Services Limited which are contributed equity, retained earnings and reserves. From
year 2016 to 2017 its contributed equity and retained earning is moving positively by 0.31% and
27.09% respectively. Aggregately, these elements of equity had given impact on total equity
which increased by 13.68% in year 2017. From year 2017 to 2018, it is increasing from 1.36% of
contributed equity and retained earnings with 15.01%. Hence, total equity is raising by 9.35% in
year 2018 which is lesser than 2017.
2. Providing comparative analysis of debt and equity position of both the firms
2
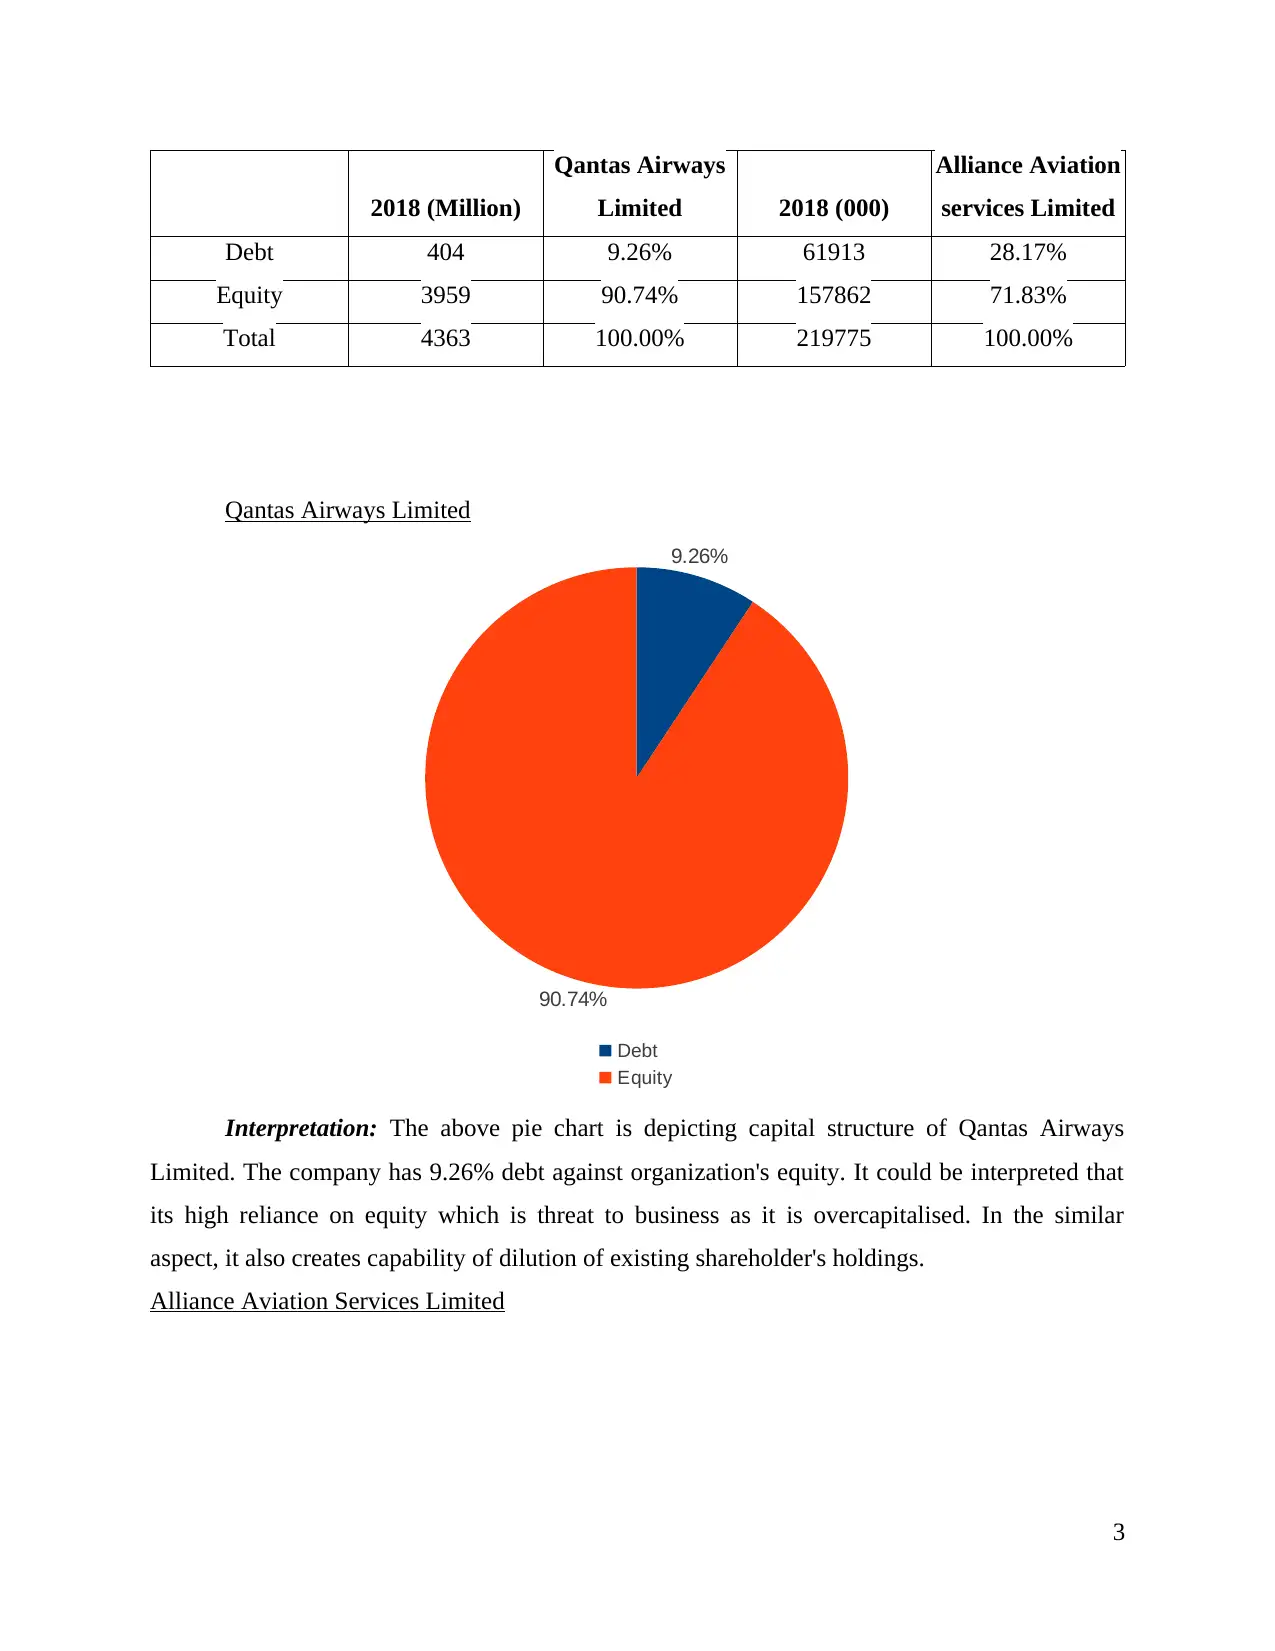
2018 (Million)
Qantas Airways
Limited 2018 (000)
Alliance Aviation
services Limited
Debt 404 9.26% 61913 28.17%
Equity 3959 90.74% 157862 71.83%
Total 4363 100.00% 219775 100.00%
Qantas Airways Limited
9.26%
90.74%
Debt
Equity
Interpretation: The above pie chart is depicting capital structure of Qantas Airways
Limited. The company has 9.26% debt against organization's equity. It could be interpreted that
its high reliance on equity which is threat to business as it is overcapitalised. In the similar
aspect, it also creates capability of dilution of existing shareholder's holdings.
Alliance Aviation Services Limited
3
⊘ This is a preview!⊘
Do you want full access?
Subscribe today to unlock all pages.
Trusted by 1+ million students worldwide
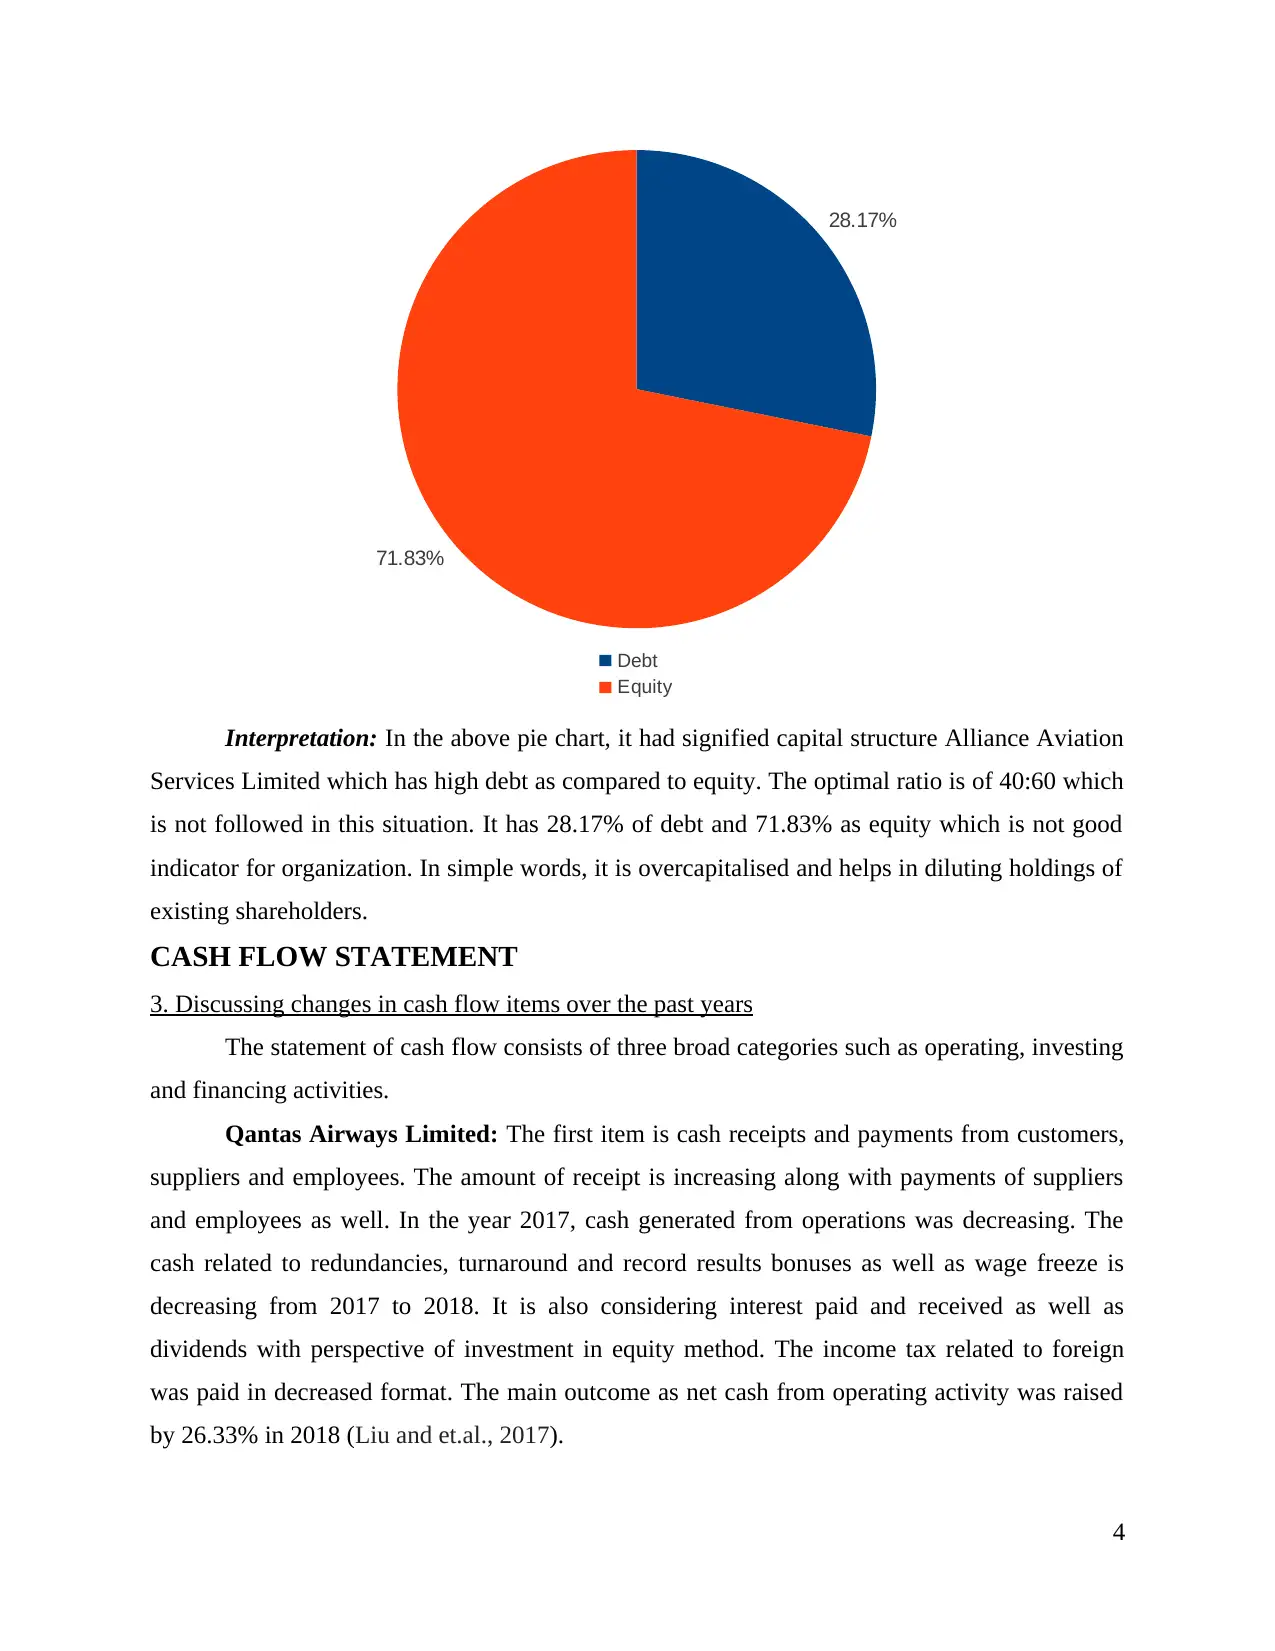
28.17%
71.83%
Debt
Equity
Interpretation: In the above pie chart, it had signified capital structure Alliance Aviation
Services Limited which has high debt as compared to equity. The optimal ratio is of 40:60 which
is not followed in this situation. It has 28.17% of debt and 71.83% as equity which is not good
indicator for organization. In simple words, it is overcapitalised and helps in diluting holdings of
existing shareholders.
CASH FLOW STATEMENT
3. Discussing changes in cash flow items over the past years
The statement of cash flow consists of three broad categories such as operating, investing
and financing activities.
Qantas Airways Limited: The first item is cash receipts and payments from customers,
suppliers and employees. The amount of receipt is increasing along with payments of suppliers
and employees as well. In the year 2017, cash generated from operations was decreasing. The
cash related to redundancies, turnaround and record results bonuses as well as wage freeze is
decreasing from 2017 to 2018. It is also considering interest paid and received as well as
dividends with perspective of investment in equity method. The income tax related to foreign
was paid in decreased format. The main outcome as net cash from operating activity was raised
by 26.33% in 2018 (Liu and et.al., 2017).
4
Paraphrase This Document
Need a fresh take? Get an instant paraphrase of this document with our AI Paraphraser
In context of investing activity, it will consider payments for intangible assets, plant and
equipment which is raised by $591 million. Along with this, interest paid and capitalised with
qualifying asset is decreasing with 41 million. It has stated proceeds from disposal of controlled
entity, property, equipment and plant. As controlled entity was absence in 2017 and its disposal
is reduced directly by 50%. The payments for investment under equity method is reduced as it is
an aircraft company. It will exclude aircraft operating lease refinancing which is decreased by
301 million. Hence, net cash used for the purpose of investing activity is increased by 7.58%.
In the similar aspect, cash flow from financing activity is very important for Qantas
Airways Limited because it is increasing by more than 50%. It consists of payments for share
buyback and treasury shares which is increasing and decreasing respectively. It will also consider
proceeds and repayments of borrowing which are changing in a positive aspect. The net receipts
about aircraft security deposits and debt in context of hedge was absence in 2018 as it was $8
million in 2017. The dividends paid to shareholders are decreasing and to non-controlling
interest was nil in 2018 but in 2017, it was $3 million.
Alliance Aviation Services limited: The cash in context of operating activity is
increasing by 76.31%. It consists of receipts via customers and payments to suppliers which is
increasing by huge proportion. The amount of interest received and paid is considered as they
both have huge variation in which payment is decreased and receipt of interest is increased by
$73000. Further, it will also include payment of income tax which is approx. similar to that of
previous year (Annual Report of Alliance Airlines, 2017).
In the similar aspect, cash from investing activity considers payments via plant,
equipment and property is increased from previous year with absence of its proceeds. The cash
outflow from investing activity is increasing but with small proportion of 10.37% as compared to
both; operating and financing activities.
Alliance Aviation Services Limited has also presence of financing activity which is
increasing from huge percentage as 113.33%. It comprises proceeds and repayments of
borrowings along with the dividend paid as well.
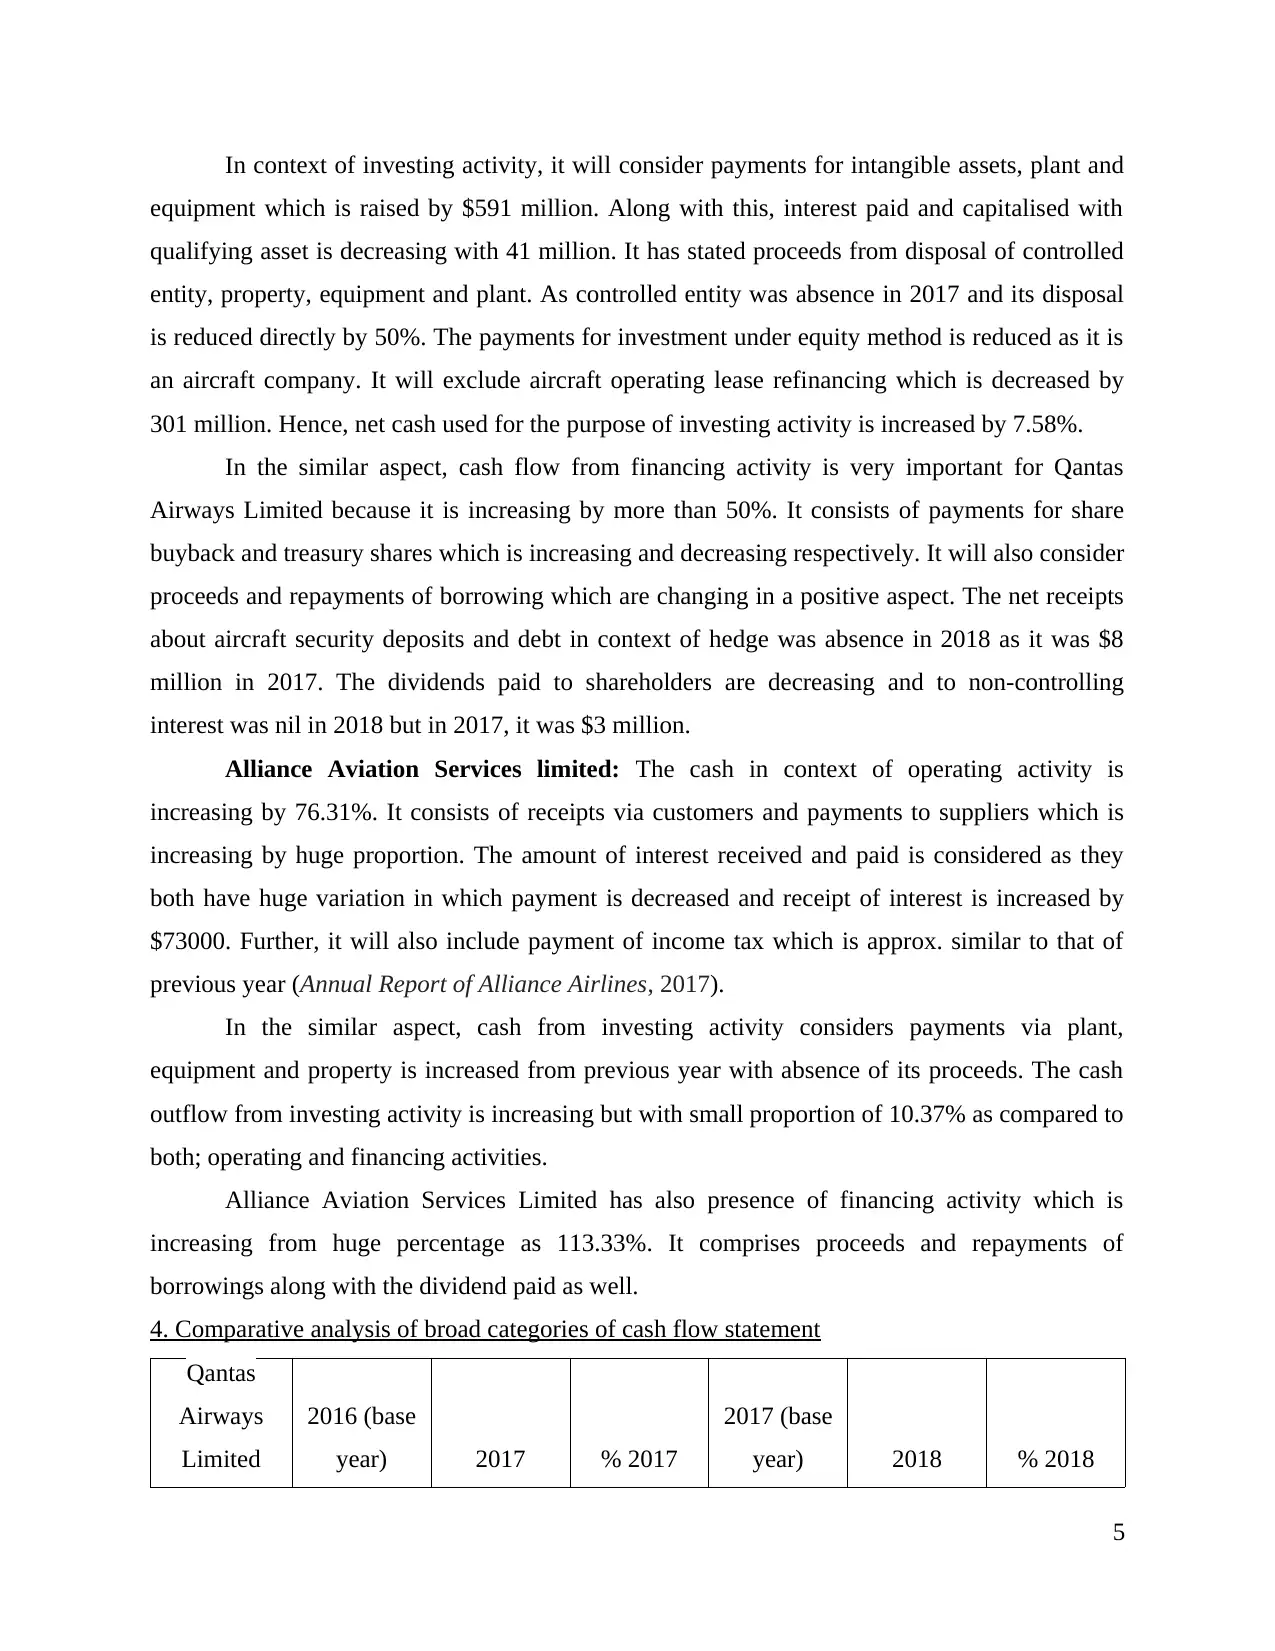
4. Comparative analysis of broad categories of cash flow statement
Qantas
Airways
Limited
2016 (base
year) 2017 % 2017
2017 (base
year) 2018 % 2018
5
equipment which is raised by $591 million. Along with this, interest paid and capitalised with
qualifying asset is decreasing with 41 million. It has stated proceeds from disposal of controlled
entity, property, equipment and plant. As controlled entity was absence in 2017 and its disposal
is reduced directly by 50%. The payments for investment under equity method is reduced as it is
an aircraft company. It will exclude aircraft operating lease refinancing which is decreased by
301 million. Hence, net cash used for the purpose of investing activity is increased by 7.58%.
In the similar aspect, cash flow from financing activity is very important for Qantas
Airways Limited because it is increasing by more than 50%. It consists of payments for share
buyback and treasury shares which is increasing and decreasing respectively. It will also consider
proceeds and repayments of borrowing which are changing in a positive aspect. The net receipts
about aircraft security deposits and debt in context of hedge was absence in 2018 as it was $8
million in 2017. The dividends paid to shareholders are decreasing and to non-controlling
interest was nil in 2018 but in 2017, it was $3 million.
Alliance Aviation Services limited: The cash in context of operating activity is
increasing by 76.31%. It consists of receipts via customers and payments to suppliers which is
increasing by huge proportion. The amount of interest received and paid is considered as they
both have huge variation in which payment is decreased and receipt of interest is increased by
$73000. Further, it will also include payment of income tax which is approx. similar to that of
previous year (Annual Report of Alliance Airlines, 2017).
In the similar aspect, cash from investing activity considers payments via plant,
equipment and property is increased from previous year with absence of its proceeds. The cash
outflow from investing activity is increasing but with small proportion of 10.37% as compared to
both; operating and financing activities.
Alliance Aviation Services Limited has also presence of financing activity which is
increasing from huge percentage as 113.33%. It comprises proceeds and repayments of
borrowings along with the dividend paid as well.
4. Comparative analysis of broad categories of cash flow statement
Qantas
Airways
Limited
2016 (base
year) 2017 % 2017
2017 (base
year) 2018 % 2018
5
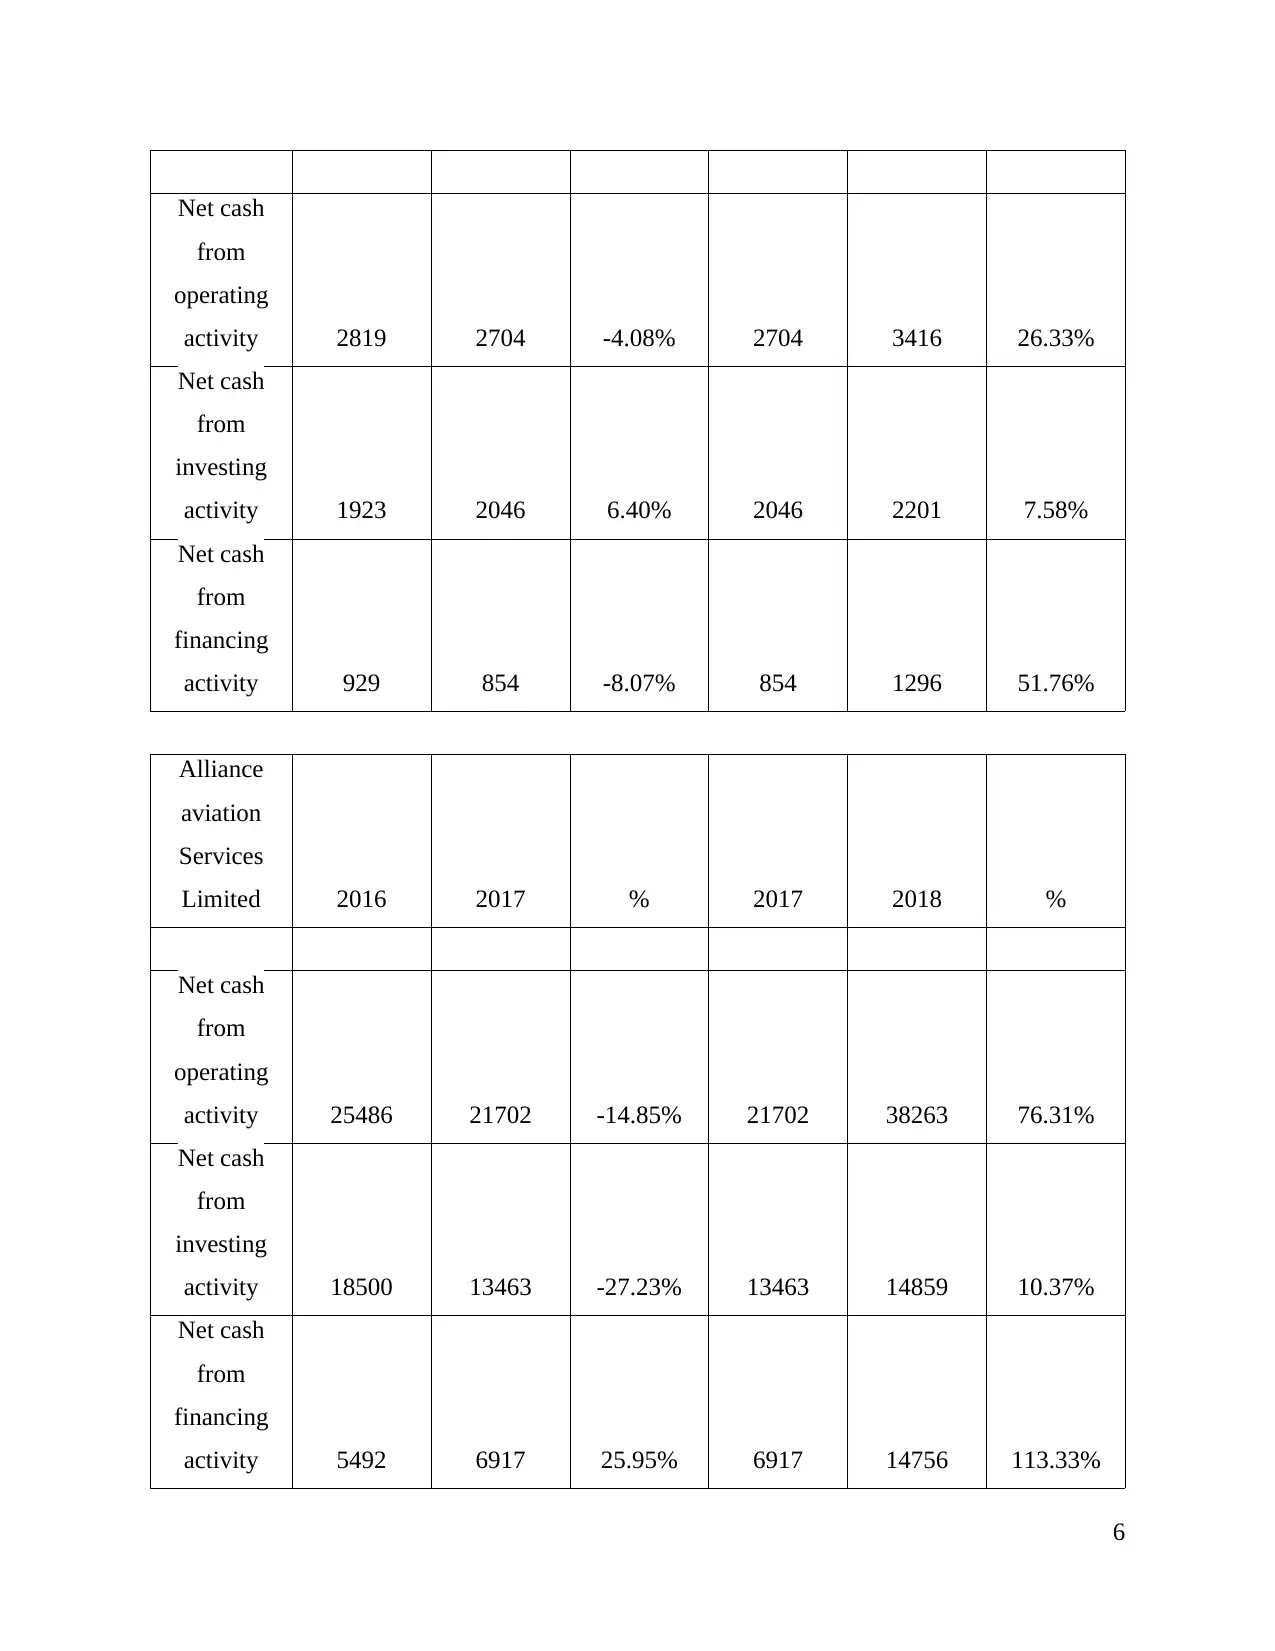
Net cash
from
operating
activity 2819 2704 -4.08% 2704 3416 26.33%
Net cash
from
investing
activity 1923 2046 6.40% 2046 2201 7.58%
Net cash
from
financing
activity 929 854 -8.07% 854 1296 51.76%
Alliance
aviation
Services
Limited 2016 2017 % 2017 2018 %
Net cash
from
operating
activity 25486 21702 -14.85% 21702 38263 76.31%
Net cash
from
investing
activity 18500 13463 -27.23% 13463 14859 10.37%
Net cash
from
financing
activity 5492 6917 25.95% 6917 14756 113.33%
6
from
operating
activity 2819 2704 -4.08% 2704 3416 26.33%
Net cash
from
investing
activity 1923 2046 6.40% 2046 2201 7.58%
Net cash
from
financing
activity 929 854 -8.07% 854 1296 51.76%
Alliance
aviation
Services
Limited 2016 2017 % 2017 2018 %
Net cash
from
operating
activity 25486 21702 -14.85% 21702 38263 76.31%
Net cash
from
investing
activity 18500 13463 -27.23% 13463 14859 10.37%
Net cash
from
financing
activity 5492 6917 25.95% 6917 14756 113.33%
6
⊘ This is a preview!⊘
Do you want full access?
Subscribe today to unlock all pages.
Trusted by 1+ million students worldwide
Interpretation: The above tables are signifying three broad categories of cash flow
statement on basis of both organization. It could be observed that, cash generated from operating
activities is higher than compared to both activities. While observing change, Qantas Airways
Limited had shown huge change in financing activity which is more than 50% and Alliance
Aviation services Limited with 113.33% in similar category.
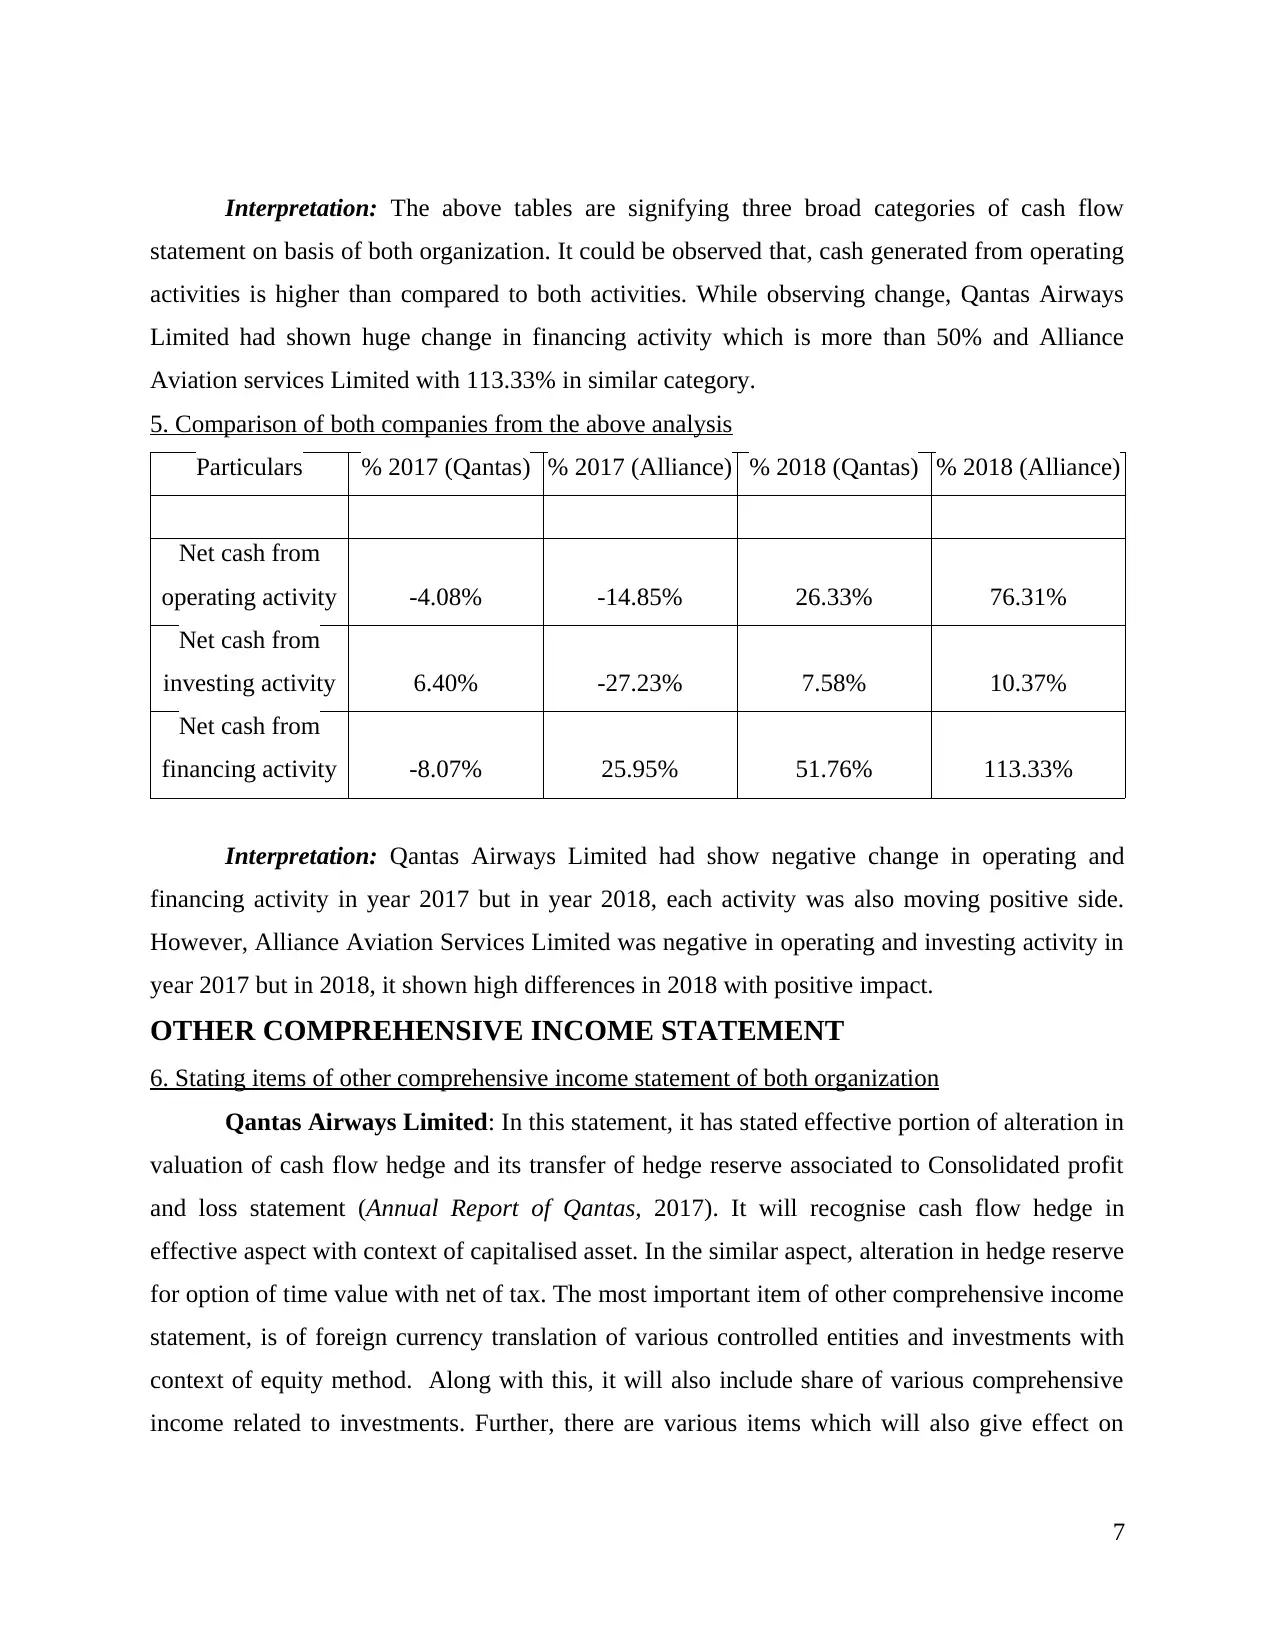
5. Comparison of both companies from the above analysis
Particulars % 2017 (Qantas) % 2017 (Alliance) % 2018 (Qantas) % 2018 (Alliance)
Net cash from
operating activity -4.08% -14.85% 26.33% 76.31%
Net cash from
investing activity 6.40% -27.23% 7.58% 10.37%
Net cash from
financing activity -8.07% 25.95% 51.76% 113.33%
Interpretation: Qantas Airways Limited had show negative change in operating and
financing activity in year 2017 but in year 2018, each activity was also moving positive side.
However, Alliance Aviation Services Limited was negative in operating and investing activity in
year 2017 but in 2018, it shown high differences in 2018 with positive impact.
OTHER COMPREHENSIVE INCOME STATEMENT
6. Stating items of other comprehensive income statement of both organization
Qantas Airways Limited: In this statement, it has stated effective portion of alteration in
valuation of cash flow hedge and its transfer of hedge reserve associated to Consolidated profit
and loss statement (Annual Report of Qantas, 2017). It will recognise cash flow hedge in
effective aspect with context of capitalised asset. In the similar aspect, alteration in hedge reserve
for option of time value with net of tax. The most important item of other comprehensive income
statement, is of foreign currency translation of various controlled entities and investments with
context of equity method. Along with this, it will also include share of various comprehensive
income related to investments. Further, there are various items which will also give effect on
7
statement on basis of both organization. It could be observed that, cash generated from operating
activities is higher than compared to both activities. While observing change, Qantas Airways
Limited had shown huge change in financing activity which is more than 50% and Alliance
Aviation services Limited with 113.33% in similar category.
5. Comparison of both companies from the above analysis
Particulars % 2017 (Qantas) % 2017 (Alliance) % 2018 (Qantas) % 2018 (Alliance)
Net cash from
operating activity -4.08% -14.85% 26.33% 76.31%
Net cash from
investing activity 6.40% -27.23% 7.58% 10.37%
Net cash from
financing activity -8.07% 25.95% 51.76% 113.33%
Interpretation: Qantas Airways Limited had show negative change in operating and
financing activity in year 2017 but in year 2018, each activity was also moving positive side.
However, Alliance Aviation Services Limited was negative in operating and investing activity in
year 2017 but in 2018, it shown high differences in 2018 with positive impact.
OTHER COMPREHENSIVE INCOME STATEMENT
6. Stating items of other comprehensive income statement of both organization
Qantas Airways Limited: In this statement, it has stated effective portion of alteration in
valuation of cash flow hedge and its transfer of hedge reserve associated to Consolidated profit
and loss statement (Annual Report of Qantas, 2017). It will recognise cash flow hedge in
effective aspect with context of capitalised asset. In the similar aspect, alteration in hedge reserve
for option of time value with net of tax. The most important item of other comprehensive income
statement, is of foreign currency translation of various controlled entities and investments with
context of equity method. Along with this, it will also include share of various comprehensive
income related to investments. Further, there are various items which will also give effect on
7
Paraphrase This Document
Need a fresh take? Get an instant paraphrase of this document with our AI Paraphraser
comprehensive income statement such as actuarial gains and fair value advantage on investment
as well.
Alliance Aviation Services Limited: It had considered cash flow hedge reserve which is
applicable for recording losses and gains with context of hedging instrument in cash flow. The
amount would be reclassified to loss or profit which is linked with hedge transaction which
impact both. In the similar aspect, it will also state expense of income tax relate to cash flow
hedge reserve (Annual Report of Alliance Airlines, 2018).
7. Reason for not including items in Profit and Loss statement
It is considered as very expansive view of net profit. In previous year, alterations in net
profit could be deemed outside with context of it core operations. It is volatile and allowed for
flowing towards shareholder's equity. It includes those expenses, losses, revenues and gains
which are not yet realized. Most common example is bond portfolio which is not yet sold so in
this context interim adjustments are considered in this other comprehensive income statement.
The items which changes business entity's equity without engaging investment of owner
or creation of its distribution. It does not affect net income and retained earning of organization
as well. The items of OCI of current year will impact alteration in accumulate other
comprehensive income which is replicated as other element of stockholder's equity.
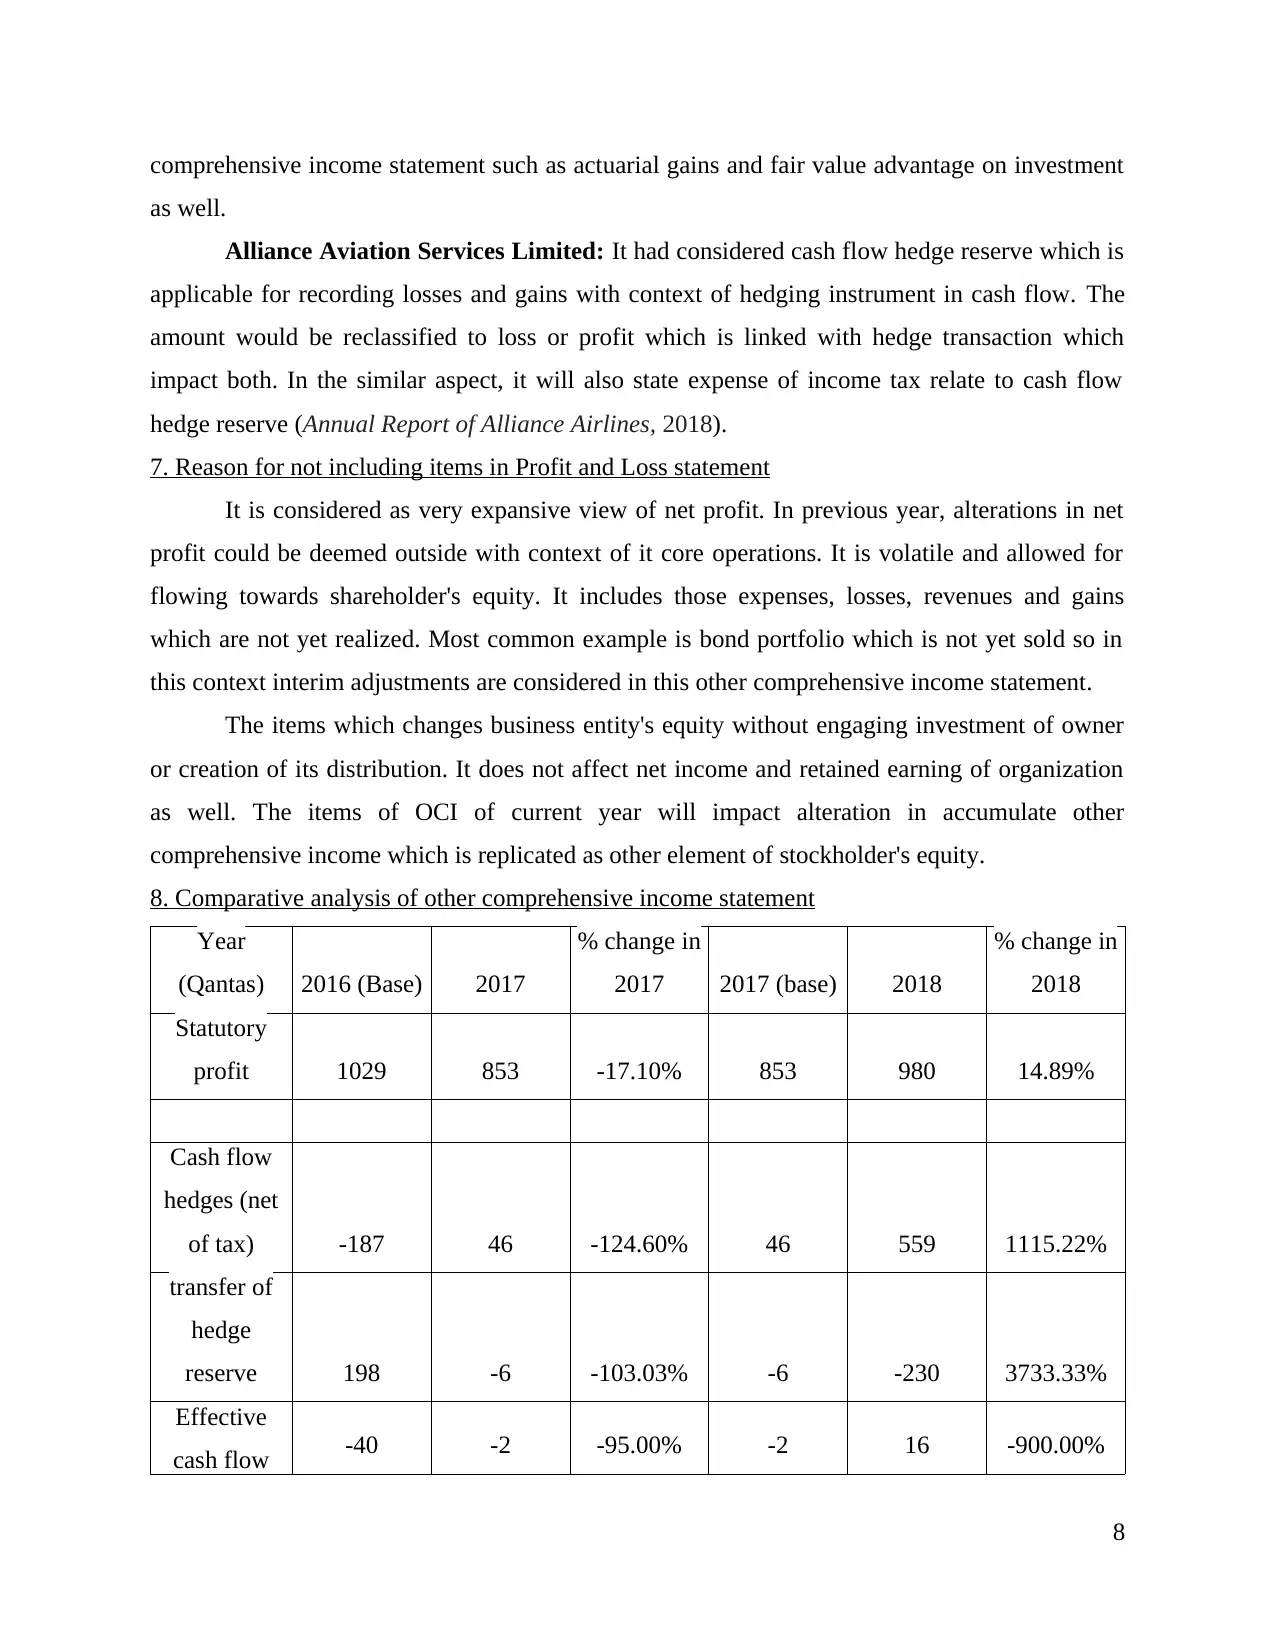
8. Comparative analysis of other comprehensive income statement
Year
(Qantas) 2016 (Base) 2017
% change in
2017 2017 (base) 2018
% change in
2018
Statutory
profit 1029 853 -17.10% 853 980 14.89%
Cash flow
hedges (net
of tax) -187 46 -124.60% 46 559 1115.22%
transfer of
hedge
reserve 198 -6 -103.03% -6 -230 3733.33%
Effective
cash flow -40 -2 -95.00% -2 16 -900.00%
8
as well.
Alliance Aviation Services Limited: It had considered cash flow hedge reserve which is
applicable for recording losses and gains with context of hedging instrument in cash flow. The
amount would be reclassified to loss or profit which is linked with hedge transaction which
impact both. In the similar aspect, it will also state expense of income tax relate to cash flow
hedge reserve (Annual Report of Alliance Airlines, 2018).
7. Reason for not including items in Profit and Loss statement
It is considered as very expansive view of net profit. In previous year, alterations in net
profit could be deemed outside with context of it core operations. It is volatile and allowed for
flowing towards shareholder's equity. It includes those expenses, losses, revenues and gains
which are not yet realized. Most common example is bond portfolio which is not yet sold so in
this context interim adjustments are considered in this other comprehensive income statement.
The items which changes business entity's equity without engaging investment of owner
or creation of its distribution. It does not affect net income and retained earning of organization
as well. The items of OCI of current year will impact alteration in accumulate other
comprehensive income which is replicated as other element of stockholder's equity.
8. Comparative analysis of other comprehensive income statement
Year
(Qantas) 2016 (Base) 2017
% change in
2017 2017 (base) 2018
% change in
2018
Statutory
profit 1029 853 -17.10% 853 980 14.89%
Cash flow
hedges (net
of tax) -187 46 -124.60% 46 559 1115.22%
transfer of
hedge
reserve 198 -6 -103.03% -6 -230 3733.33%
Effective
cash flow -40 -2 -95.00% -2 16 -900.00%
8
hedge
Changes in
hedge
reserve 35 -22 -162.86% -22 51 -331.82%
Foreign
currency
translation of
controlled
entities 2 -4 -300.00% -4 3 -175.00%
Foreign
currency
translation of
investments
under the
equity
method 24 -9 -137.50% -9 -3 -66.67%
Share of
other
comprehensi
ve
income/(loss)
of
investments -2 2 -200.00% 2 4 100.00%
Items that
will not
subsequently
be
reclassified
to profit or
loss
Benefit of -209 175 -183.73% 175 84 -52.00%
9
⊘ This is a preview!⊘
Do you want full access?
Subscribe today to unlock all pages.
Trusted by 1+ million students worldwide
1 out of 18
Related Documents


Your All-in-One AI-Powered Toolkit for Academic Success.
+13062052269
info@desklib.com
Available 24*7 on WhatsApp / Email
![[object Object]](/_next/static/media/star-bottom.7253800d.svg)
Unlock your academic potential
Copyright © 2020–2026 A2Z Services. All Rights Reserved. Developed and managed by ZUCOL.