Financial Statement Analysis, Valuation, & SWOT: Qantas Airways
VerifiedAdded on 2023/06/11
|11
|1930
|368
Report
AI Summary
This report presents a comprehensive financial statement analysis of Qantas Airways Limited, an ASX-listed firm. It employs various valuation models, including the method of comparables, dividend discount model, and discounted cash flow model, to assess the company's stock value. A SWOT analysis is conducted to evaluate the company's strengths, weaknesses, opportunities, and threats. The report compares Qantas Airways to competitors like Virgin Australia and Transurban, examining financial metrics such as sales revenue, earnings per share, and market value. The analysis concludes with an investment recommendation, suggesting that Qantas Airways' stock is undervalued and presents a potentially lucrative investment opportunity for investors. The appendices provide detailed calculations for the DCF model and cost of equity.
Running Head: Financial Statement Analysis For Business
1
Project Report: Running Head: Financial Statement Analysis For Business
1
Project Report: Running Head: Financial Statement Analysis For Business
Paraphrase This Document
Need a fresh take? Get an instant paraphrase of this document with our AI Paraphraser
Financial Statement Analysis For Business 2
Contents
Introduction.......................................................................................................................3
Valuation model................................................................................................................3
Methods of comparables...............................................................................................3
Dividend discount model..............................................................................................4
Discounted cash flow model.........................................................................................5
SWOT analysis.................................................................................................................5
Recommendation and Conclusion....................................................................................6
References.........................................................................................................................8
Appendix...........................................................................................................................9
Financial Statement Analysis For Business 3
Introduction:
Financial statement analysis is a process to evaluate the financial statement of an
organization in order to make better decision about the performance of the company. It
evaluates the overall financial health of the business. In the report, financial statement of
Qantas airways limited has been studied to measure the overall performance and the stock
position of the business. Various valuation model and the SWOT techniques have been
applied on the company to measure the investment position of the company.
Qantas airways limited are the flag carrier to Australia and it is largest airline in terms
of international flight, fleet size and international destination. It is operating the business
since 1921 in Australia market. Currently, the company is offering the services in 85
destinations.
Valuation model:
Valuation model is the business valuation method which focuses on the overall value
of a firm and its competitors to evaluate the financial worth of the business. This method is an
alternative to measure the intrinsic value of the company. In the report, following valuation
model has been applied on Qantas airways limited to measure the stock value of the
company.
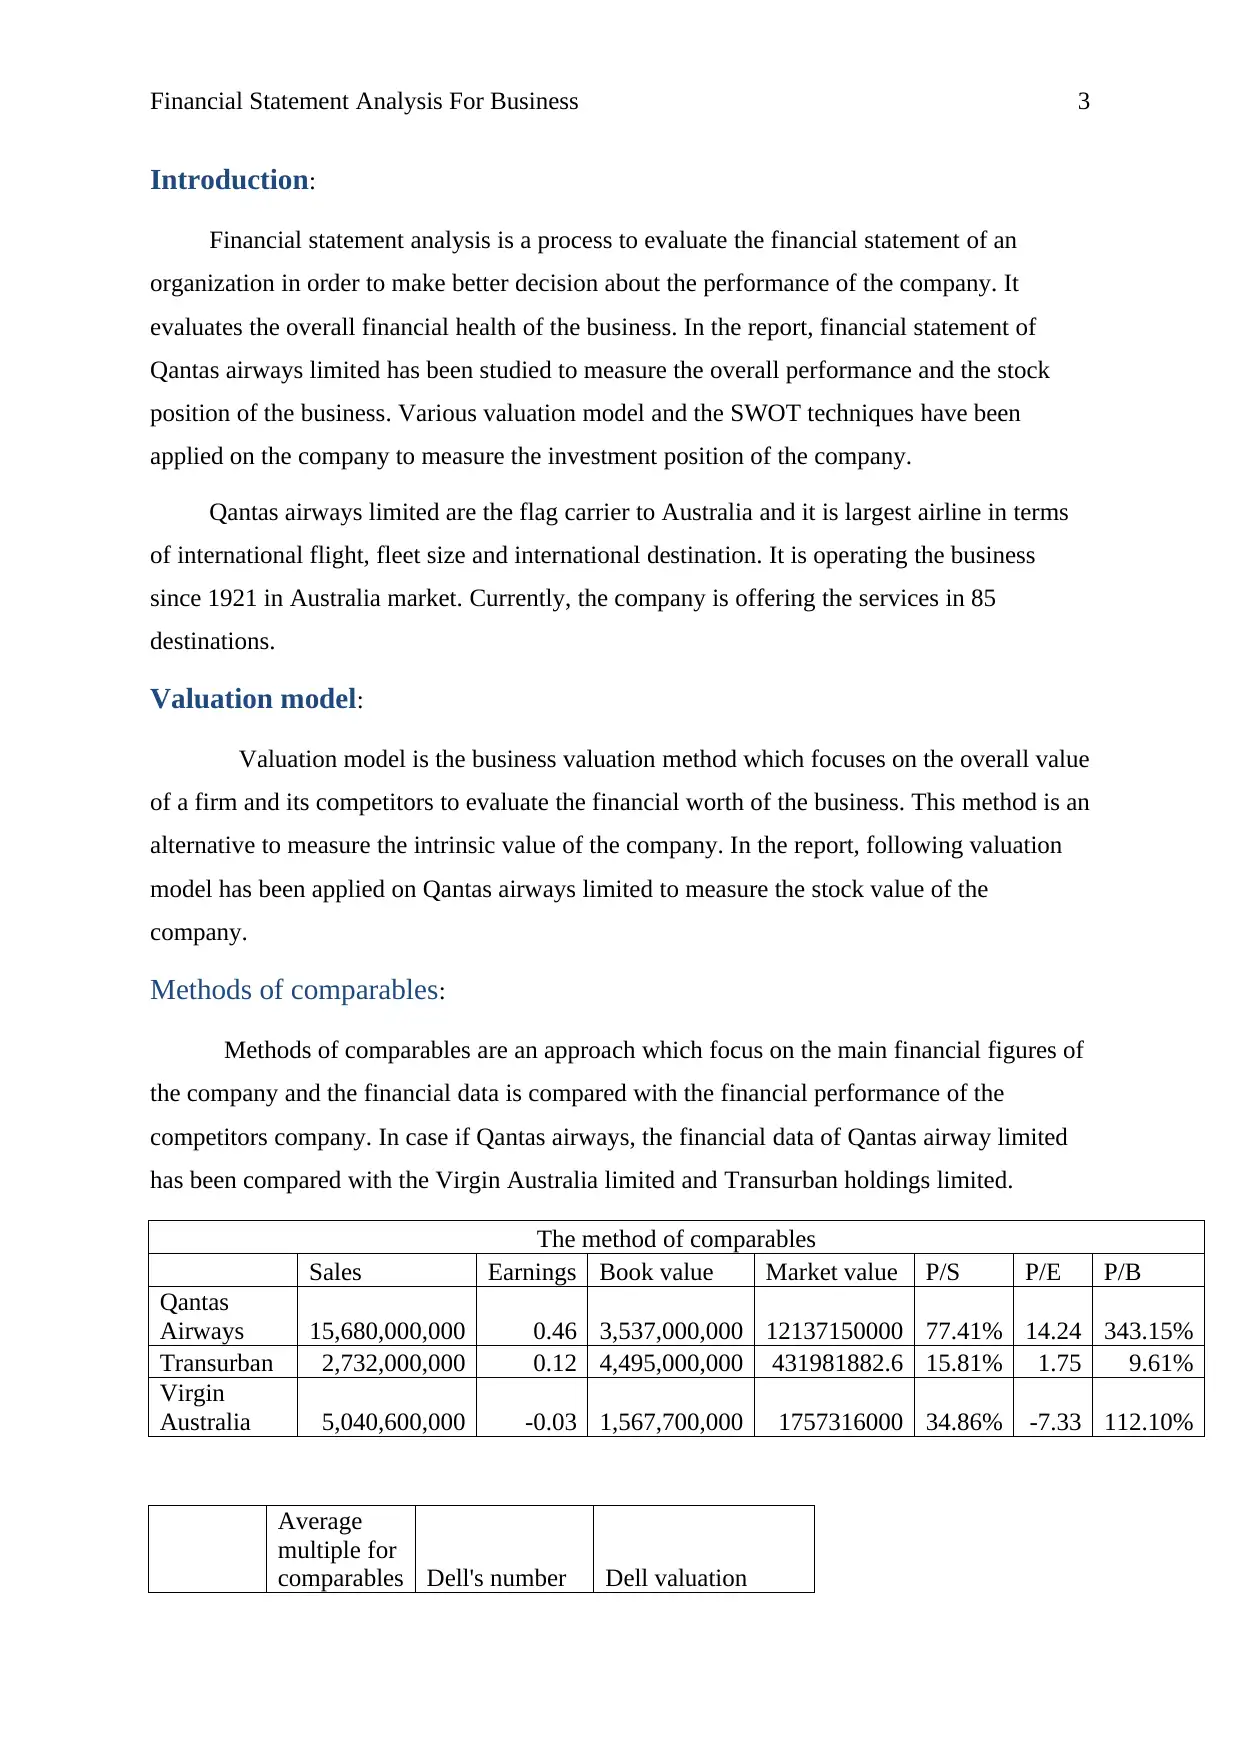
Methods of comparables:
Methods of comparables are an approach which focus on the main financial figures of
the company and the financial data is compared with the financial performance of the
competitors company. In case if Qantas airways, the financial data of Qantas airway limited
has been compared with the Virgin Australia limited and Transurban holdings limited.
The method of comparables
Sales Earnings Book value Market value P/S P/E P/B
Qantas
Airways 15,680,000,000 0.46 3,537,000,000 12137150000 77.41% 14.24 343.15%
Transurban 2,732,000,000 0.12 4,495,000,000 431981882.6 15.81% 1.75 9.61%
Virgin
Australia 5,040,600,000 -0.03 1,567,700,000 1757316000 34.86% -7.33 112.10%
Average
multiple for
comparables Dell's number Dell valuation
Introduction:
Financial statement analysis is a process to evaluate the financial statement of an
organization in order to make better decision about the performance of the company. It
evaluates the overall financial health of the business. In the report, financial statement of
Qantas airways limited has been studied to measure the overall performance and the stock
position of the business. Various valuation model and the SWOT techniques have been
applied on the company to measure the investment position of the company.
Qantas airways limited are the flag carrier to Australia and it is largest airline in terms
of international flight, fleet size and international destination. It is operating the business
since 1921 in Australia market. Currently, the company is offering the services in 85
destinations.
Valuation model:
Valuation model is the business valuation method which focuses on the overall value
of a firm and its competitors to evaluate the financial worth of the business. This method is an
alternative to measure the intrinsic value of the company. In the report, following valuation
model has been applied on Qantas airways limited to measure the stock value of the
company.
Methods of comparables:
Methods of comparables are an approach which focus on the main financial figures of
the company and the financial data is compared with the financial performance of the
competitors company. In case if Qantas airways, the financial data of Qantas airway limited
has been compared with the Virgin Australia limited and Transurban holdings limited.
The method of comparables
Sales Earnings Book value Market value P/S P/E P/B
Qantas
Airways 15,680,000,000 0.46 3,537,000,000 12137150000 77.41% 14.24 343.15%
Transurban 2,732,000,000 0.12 4,495,000,000 431981882.6 15.81% 1.75 9.61%
Virgin
Australia 5,040,600,000 -0.03 1,567,700,000 1757316000 34.86% -7.33 112.10%
Average
multiple for
comparables Dell's number Dell valuation
⊘ This is a preview!⊘
Do you want full access?
Subscribe today to unlock all pages.
Trusted by 1+ million students worldwide
Financial Statement Analysis For Business 4
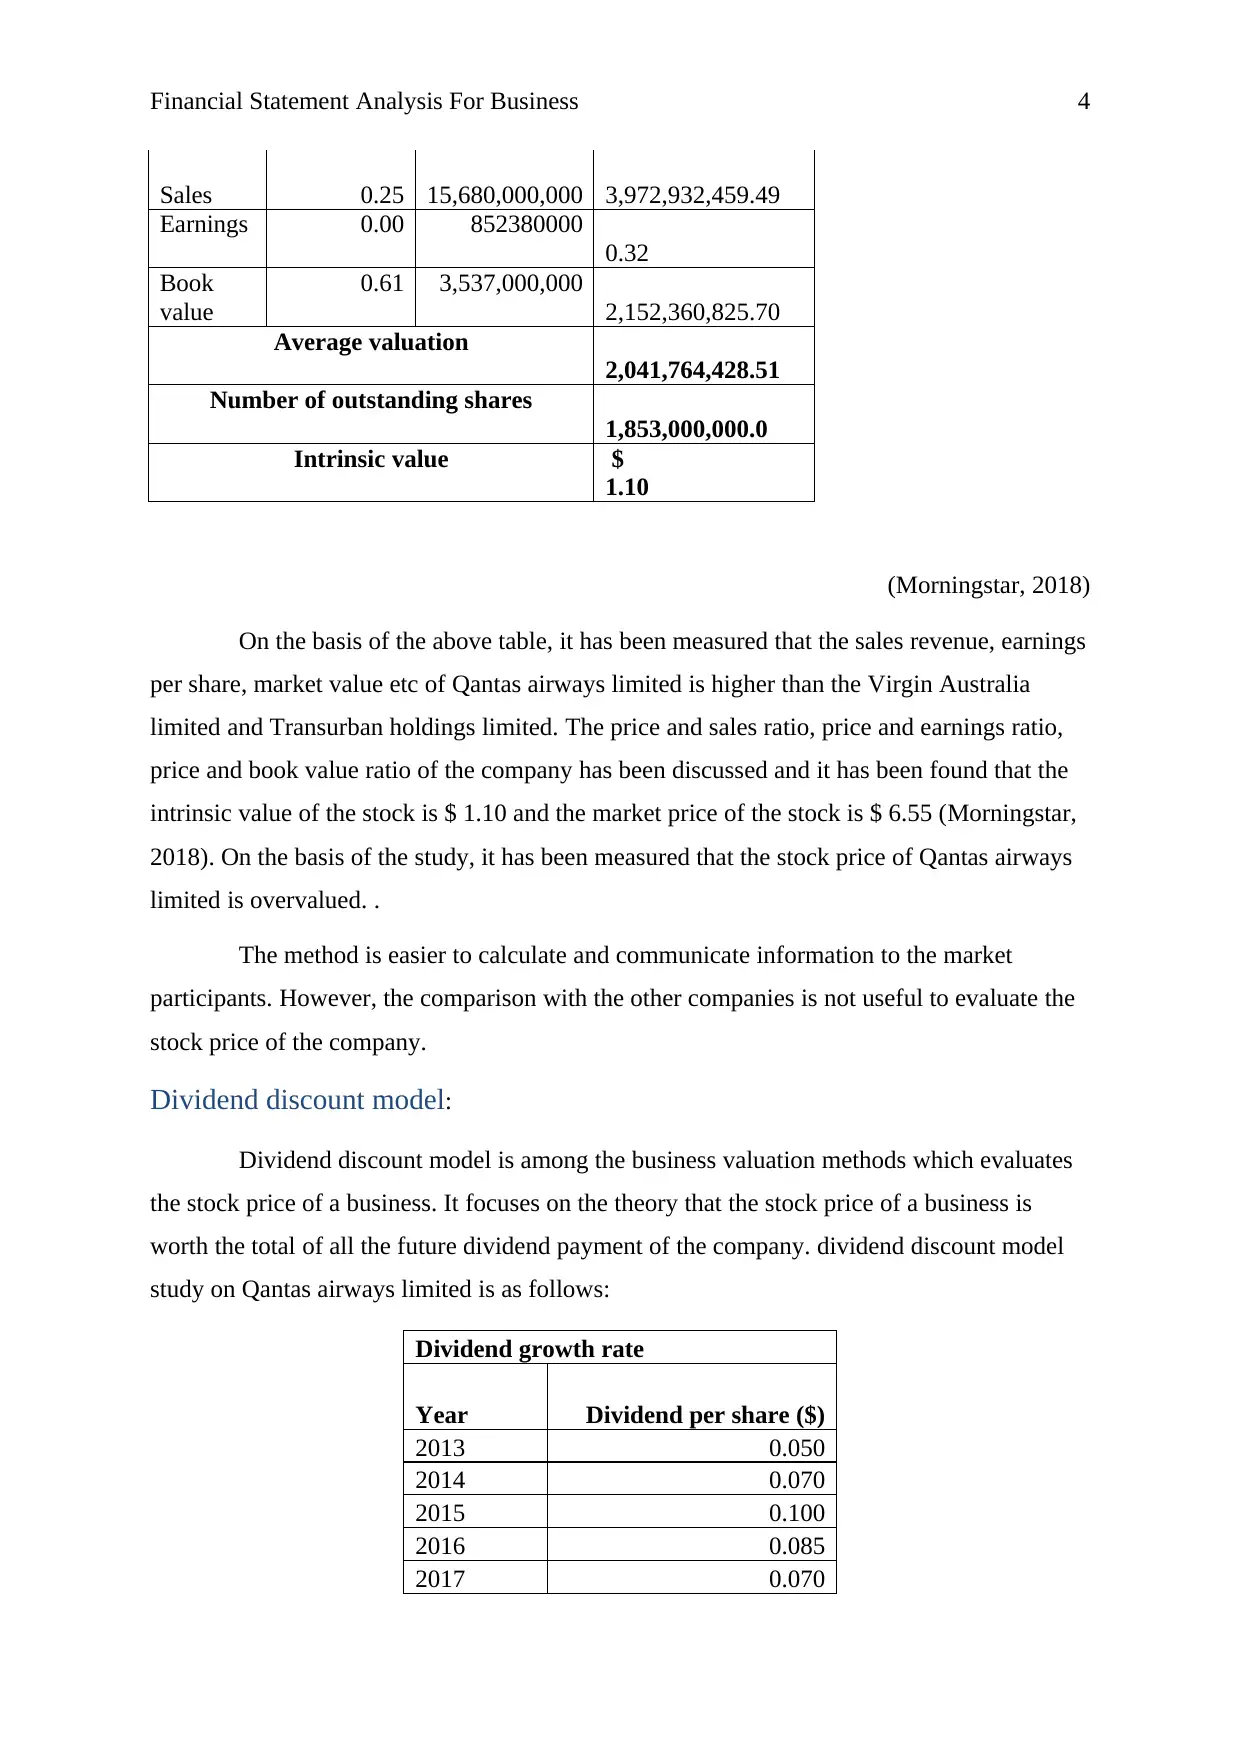
Sales 0.25 15,680,000,000 3,972,932,459.49
Earnings 0.00 852380000
0.32
Book
value
0.61 3,537,000,000
2,152,360,825.70
Average valuation
2,041,764,428.51
Number of outstanding shares
1,853,000,000.0
Intrinsic value $
1.10
(Morningstar, 2018)
On the basis of the above table, it has been measured that the sales revenue, earnings
per share, market value etc of Qantas airways limited is higher than the Virgin Australia
limited and Transurban holdings limited. The price and sales ratio, price and earnings ratio,
price and book value ratio of the company has been discussed and it has been found that the
intrinsic value of the stock is $ 1.10 and the market price of the stock is $ 6.55 (Morningstar,
2018). On the basis of the study, it has been measured that the stock price of Qantas airways
limited is overvalued. .
The method is easier to calculate and communicate information to the market
participants. However, the comparison with the other companies is not useful to evaluate the
stock price of the company.
Dividend discount model:
Dividend discount model is among the business valuation methods which evaluates
the stock price of a business. It focuses on the theory that the stock price of a business is
worth the total of all the future dividend payment of the company. dividend discount model
study on Qantas airways limited is as follows:
Dividend growth rate
Year Dividend per share ($)
2013 0.050
2014 0.070
2015 0.100
2016 0.085
2017 0.070
Paraphrase This Document
Need a fresh take? Get an instant paraphrase of this document with our AI Paraphraser
Financial Statement Analysis For Business 5
Growth
Rate 8.78%
(Yahoo Finance, 2018)
Dividend Discount Model
Dividend
expected $ 0.08
Growth rate 8.78%
Discount rate 9.41%
Intrisic Value 12
Share Price 6.55
Undervalued
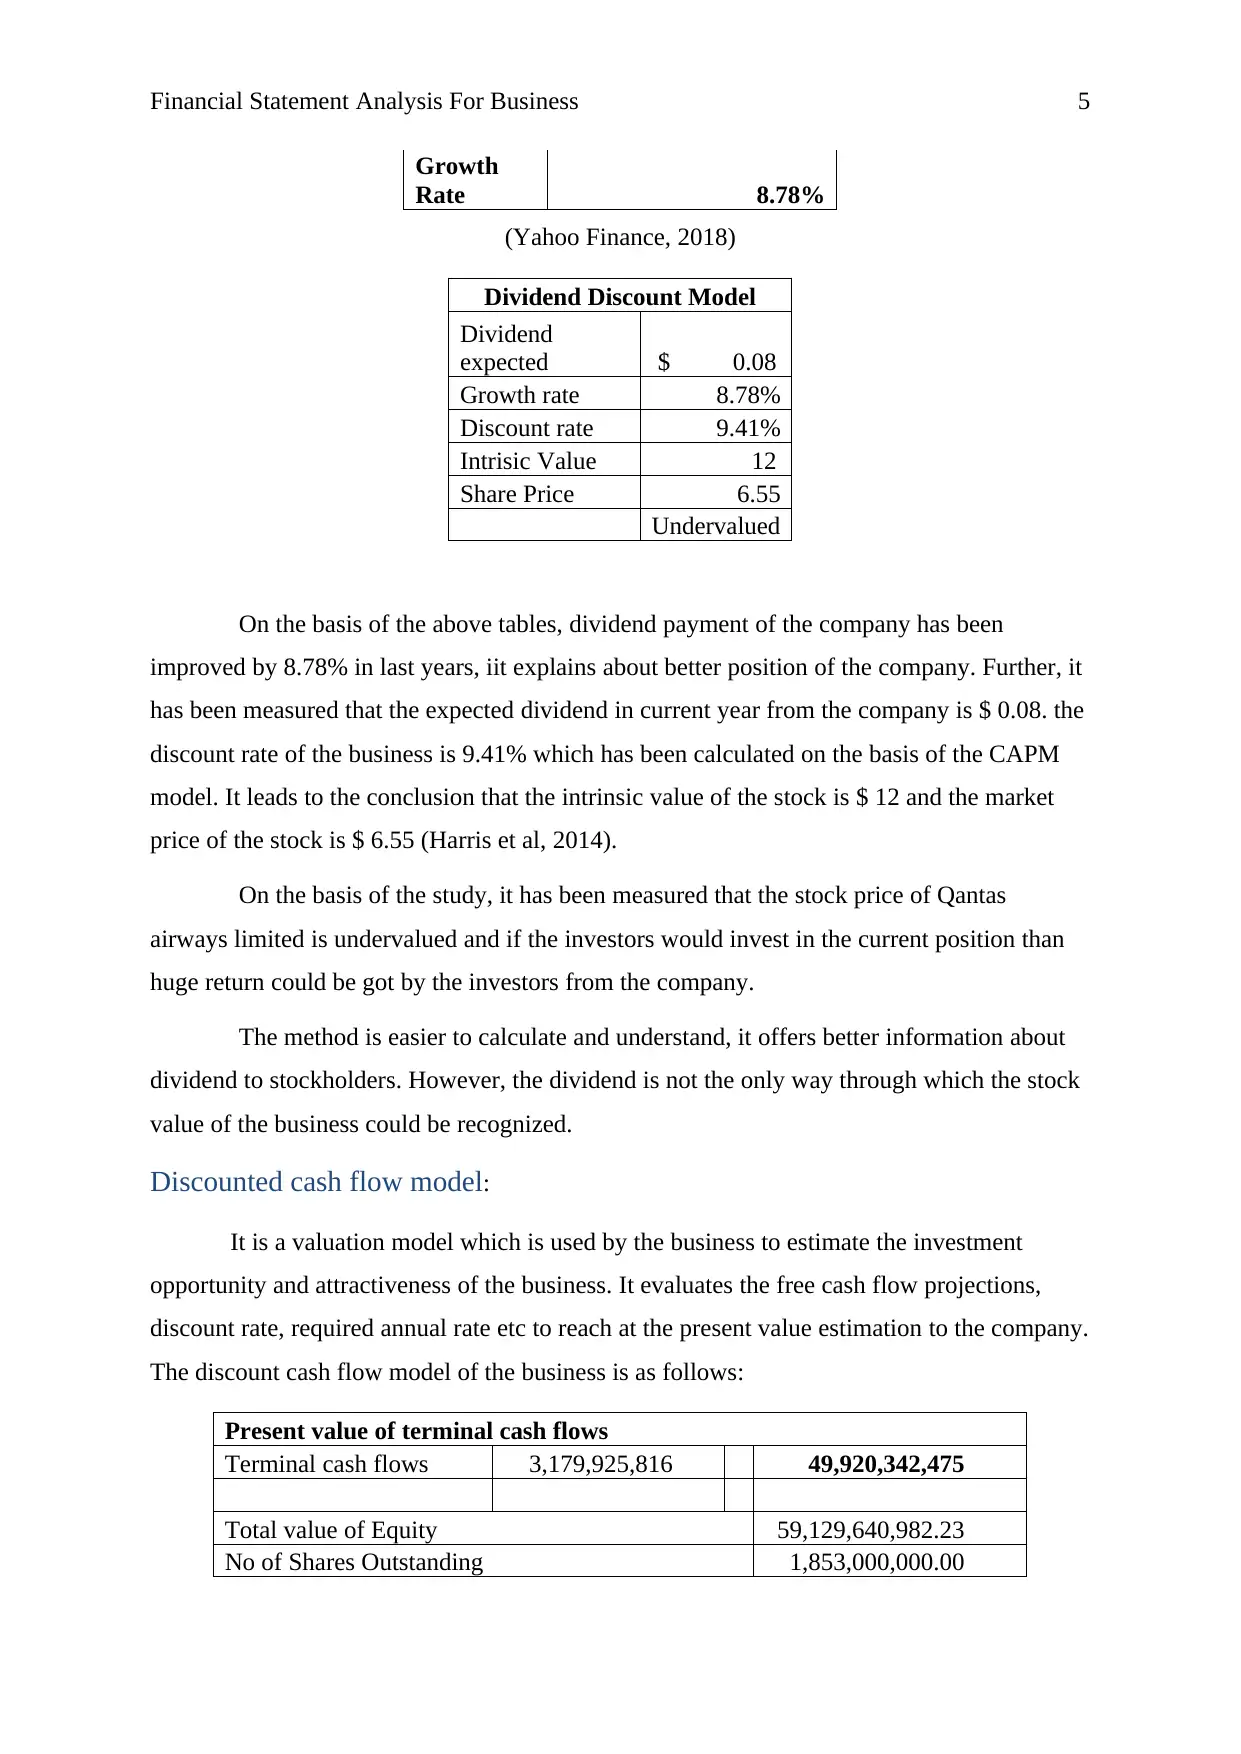
On the basis of the above tables, dividend payment of the company has been
improved by 8.78% in last years, iit explains about better position of the company. Further, it
has been measured that the expected dividend in current year from the company is $ 0.08. the
discount rate of the business is 9.41% which has been calculated on the basis of the CAPM
model. It leads to the conclusion that the intrinsic value of the stock is $ 12 and the market
price of the stock is $ 6.55 (Harris et al, 2014).
On the basis of the study, it has been measured that the stock price of Qantas
airways limited is undervalued and if the investors would invest in the current position than
huge return could be got by the investors from the company.
The method is easier to calculate and understand, it offers better information about
dividend to stockholders. However, the dividend is not the only way through which the stock
value of the business could be recognized.
Discounted cash flow model:
It is a valuation model which is used by the business to estimate the investment
opportunity and attractiveness of the business. It evaluates the free cash flow projections,
discount rate, required annual rate etc to reach at the present value estimation to the company.
The discount cash flow model of the business is as follows:
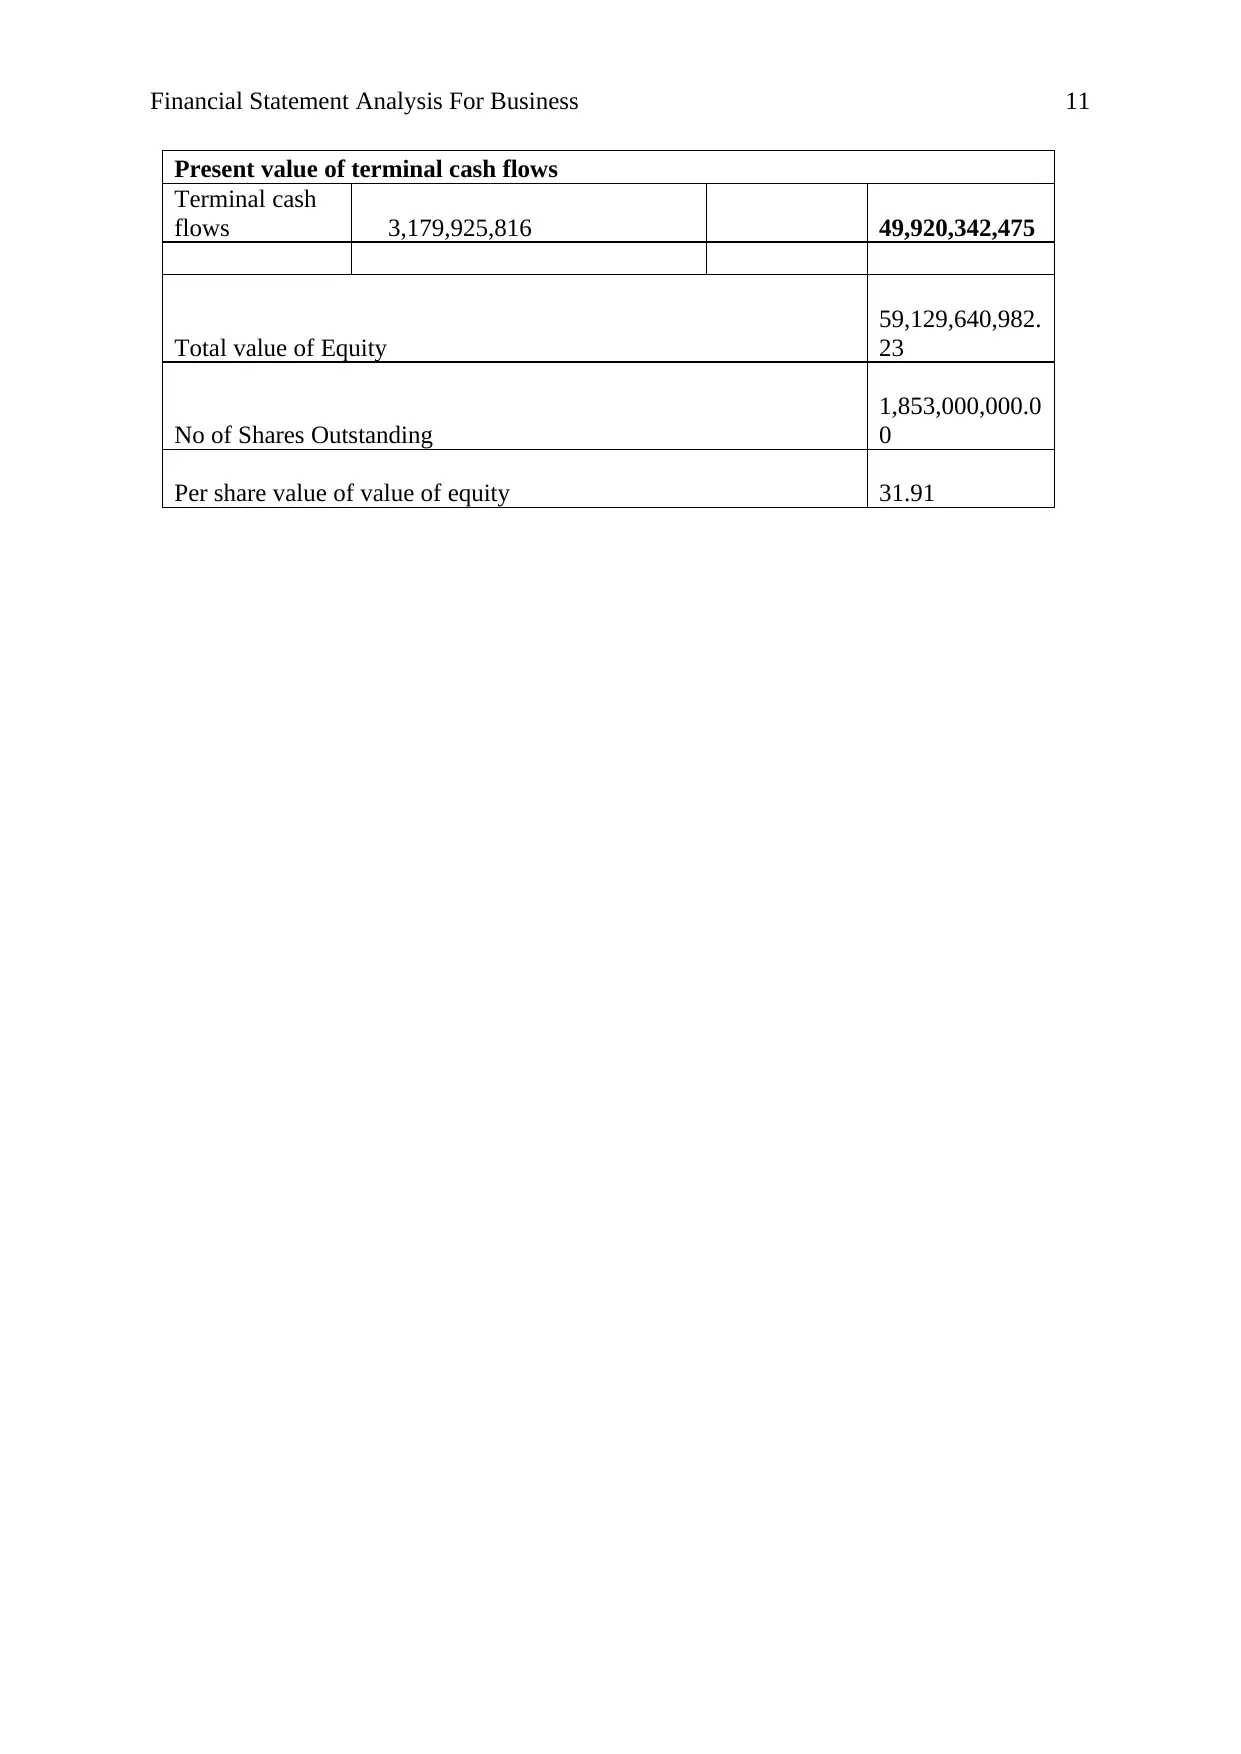
Present value of terminal cash flows
Terminal cash flows 3,179,925,816 49,920,342,475
Total value of Equity 59,129,640,982.23
No of Shares Outstanding 1,853,000,000.00
Growth
Rate 8.78%
(Yahoo Finance, 2018)
Dividend Discount Model
Dividend
expected $ 0.08
Growth rate 8.78%
Discount rate 9.41%
Intrisic Value 12
Share Price 6.55
Undervalued
On the basis of the above tables, dividend payment of the company has been
improved by 8.78% in last years, iit explains about better position of the company. Further, it
has been measured that the expected dividend in current year from the company is $ 0.08. the
discount rate of the business is 9.41% which has been calculated on the basis of the CAPM
model. It leads to the conclusion that the intrinsic value of the stock is $ 12 and the market
price of the stock is $ 6.55 (Harris et al, 2014).
On the basis of the study, it has been measured that the stock price of Qantas
airways limited is undervalued and if the investors would invest in the current position than
huge return could be got by the investors from the company.
The method is easier to calculate and understand, it offers better information about
dividend to stockholders. However, the dividend is not the only way through which the stock
value of the business could be recognized.
Discounted cash flow model:
It is a valuation model which is used by the business to estimate the investment
opportunity and attractiveness of the business. It evaluates the free cash flow projections,
discount rate, required annual rate etc to reach at the present value estimation to the company.
The discount cash flow model of the business is as follows:
Present value of terminal cash flows
Terminal cash flows 3,179,925,816 49,920,342,475
Total value of Equity 59,129,640,982.23
No of Shares Outstanding 1,853,000,000.00
Financial Statement Analysis For Business 6
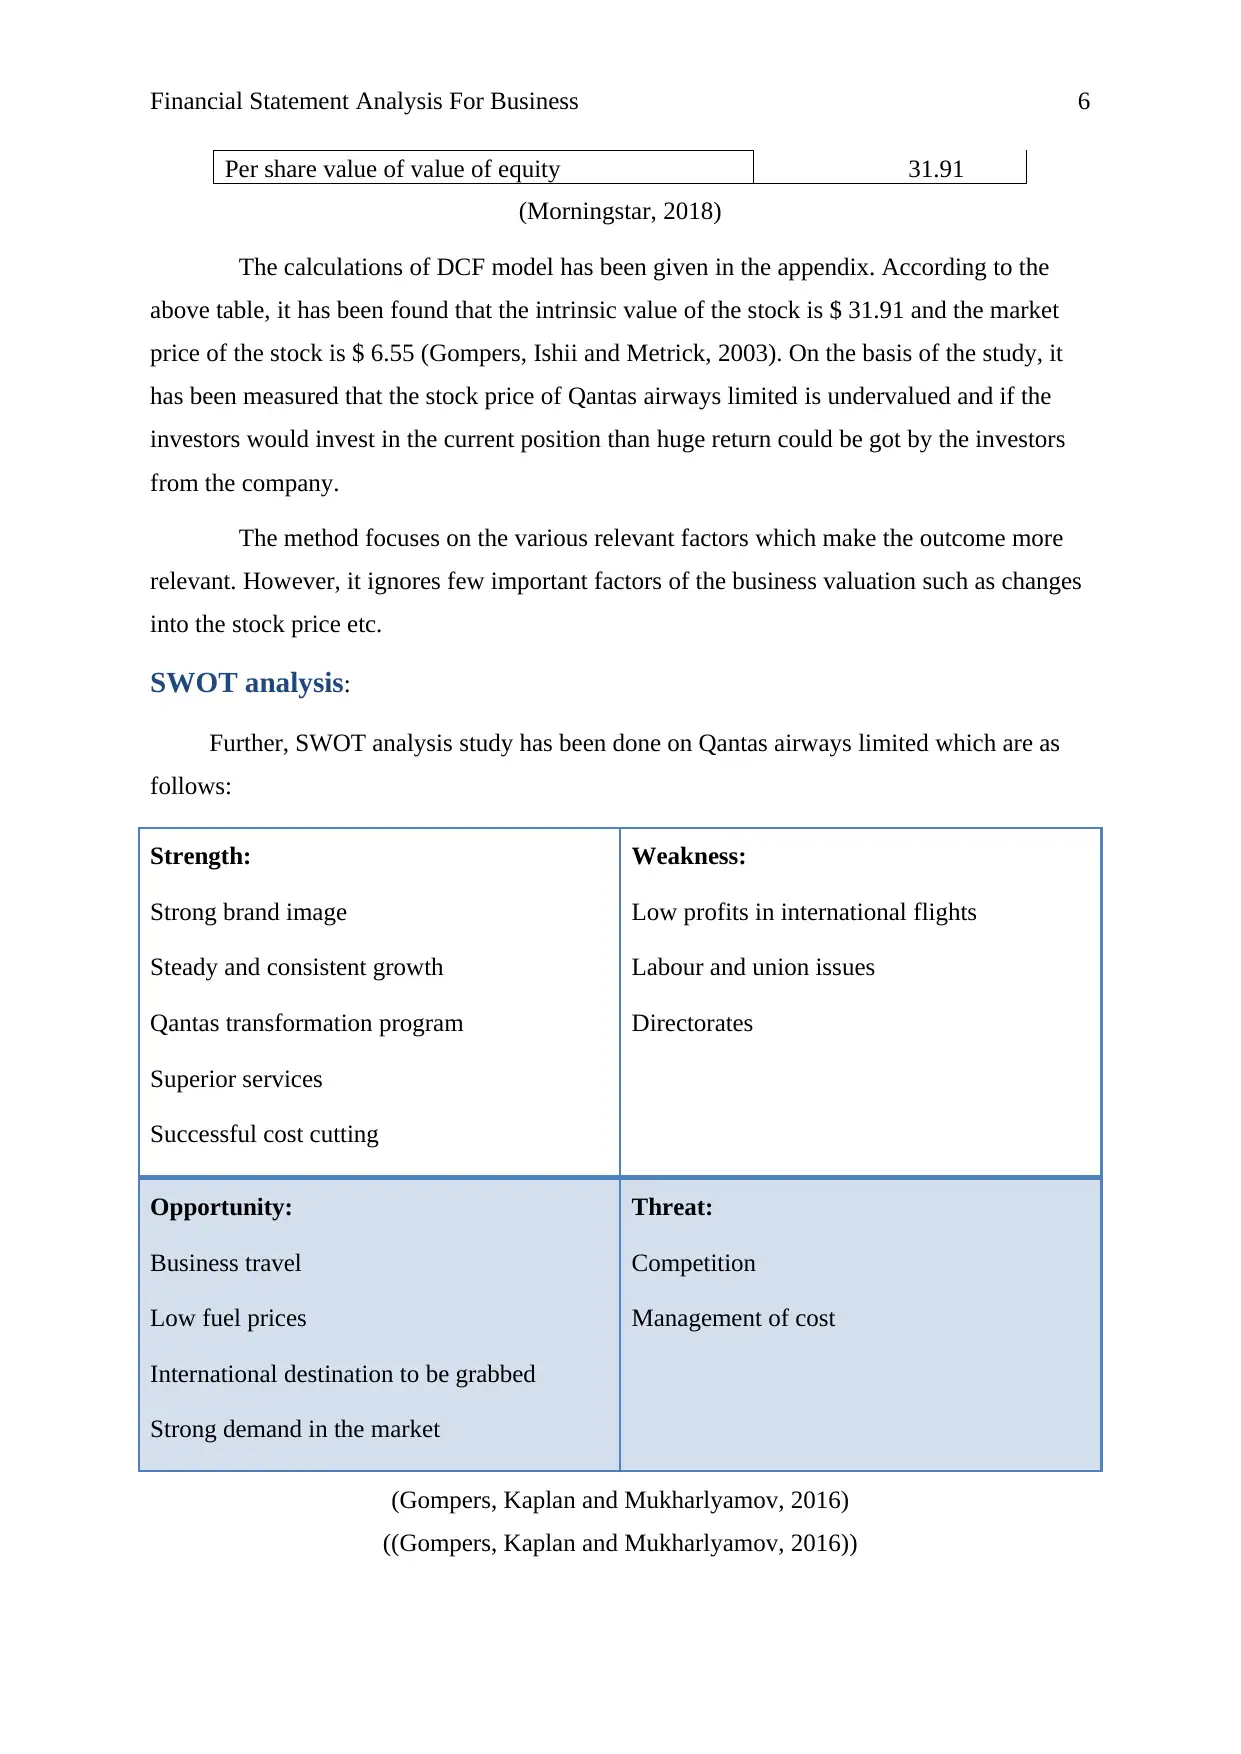
Per share value of value of equity 31.91
(Morningstar, 2018)
The calculations of DCF model has been given in the appendix. According to the
above table, it has been found that the intrinsic value of the stock is $ 31.91 and the market
price of the stock is $ 6.55 (Gompers, Ishii and Metrick, 2003). On the basis of the study, it
has been measured that the stock price of Qantas airways limited is undervalued and if the
investors would invest in the current position than huge return could be got by the investors
from the company.
The method focuses on the various relevant factors which make the outcome more
relevant. However, it ignores few important factors of the business valuation such as changes
into the stock price etc.
SWOT analysis:
Further, SWOT analysis study has been done on Qantas airways limited which are as
follows:
Strength:
Strong brand image
Steady and consistent growth
Qantas transformation program
Superior services
Successful cost cutting
Weakness:
Low profits in international flights
Labour and union issues
Directorates
Opportunity:
Business travel
Low fuel prices
International destination to be grabbed
Strong demand in the market
Threat:
Competition
Management of cost
(Gompers, Kaplan and Mukharlyamov, 2016)
((Gompers, Kaplan and Mukharlyamov, 2016))
⊘ This is a preview!⊘
Do you want full access?
Subscribe today to unlock all pages.
Trusted by 1+ million students worldwide
Financial Statement Analysis For Business 7
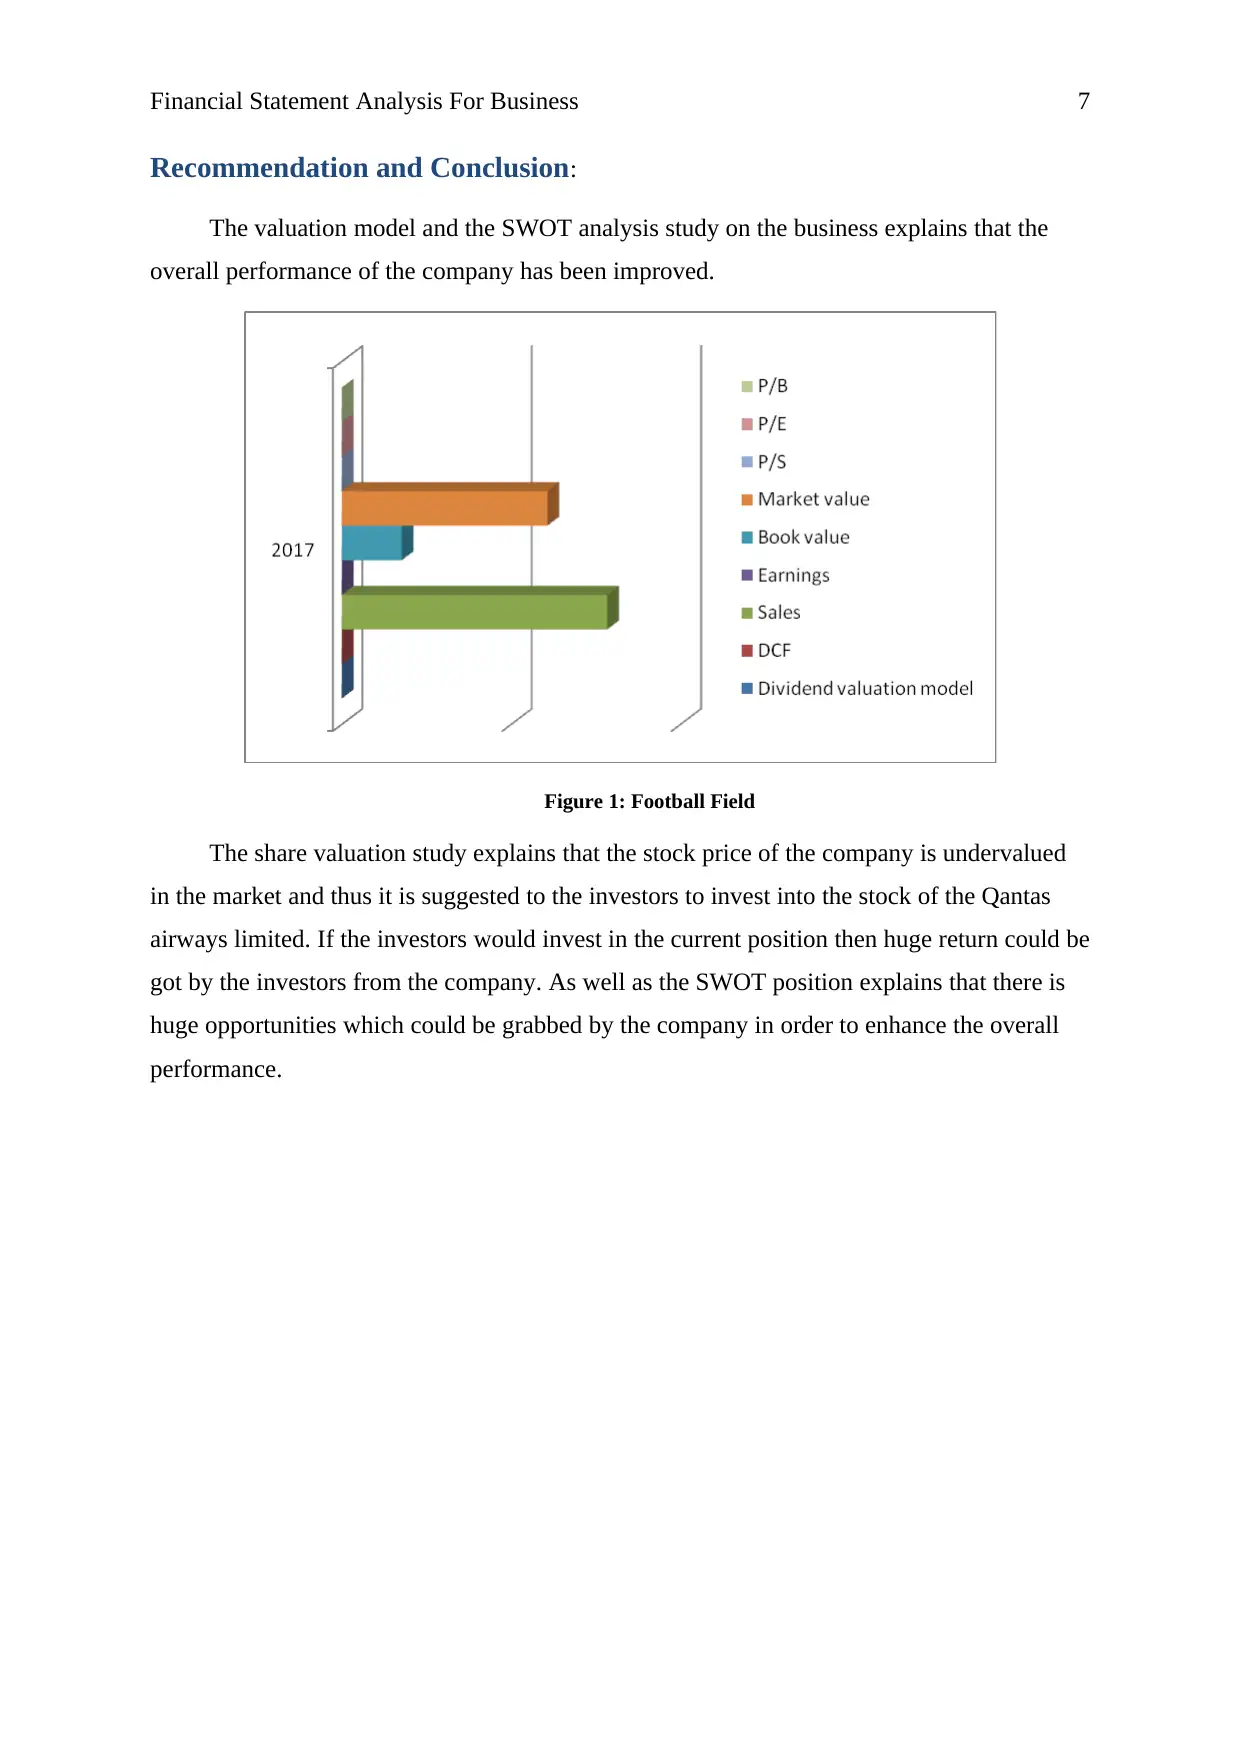
Recommendation and Conclusion:
The valuation model and the SWOT analysis study on the business explains that the
overall performance of the company has been improved.
Figure 1: Football Field
The share valuation study explains that the stock price of the company is undervalued
in the market and thus it is suggested to the investors to invest into the stock of the Qantas
airways limited. If the investors would invest in the current position then huge return could be
got by the investors from the company. As well as the SWOT position explains that there is
huge opportunities which could be grabbed by the company in order to enhance the overall
performance.
Paraphrase This Document
Need a fresh take? Get an instant paraphrase of this document with our AI Paraphraser
Financial Statement Analysis For Business 8
References:
Gompers, P., Ishii, J. and Metrick, A., 2003. Corporate governance and equity prices. The
quarterly journal of economics, 118(1), pp.107-156.
Gompers, P., Kaplan, S.N. and Mukharlyamov, V., 2016. What do private equity firms say
they do?. Journal of Financial Economics, 121(3), pp.449-476.
Harris, R.S., Jenkinson, T. and Kaplan, S.N., 2014. Private equity performance: What do we
know?. The Journal of Finance, 69(5), pp.1851-1882.
Morningstar. 2018. Qantas airways limited. [online]. Accessed from:
http://financials.morningstar.com/income-statement/is.html?
t=QAN®ion=aus&culture=en-US&platform=sal (available 23/6/18).
Morningstar. 2018. Transurban. [online]. Accessed from:
http://financials.morningstar.com/income-statement/is.html?t=TCL®ion=aus&culture=en-
US (available 23/6/18).
Morningstar. 2018. Virgin Australia holdings limited. [online]. Accessed from:
http://financials.morningstar.com/income-statement/is.html?
t=VAH®ion=aus&culture=en-US&platform=sal (available 23/6/18).
Yahoo finance. 2018. Qantas airways limited. [online]. Accessed from:
https://in.finance.yahoo.com/quote/QAN.AX/history?
period1=1339957800&period2=1529692200&interval=div
%7Csplit&filter=div&frequency=1d (available 23/6/18).
Financial Statement Analysis For Business 9
Appendix:
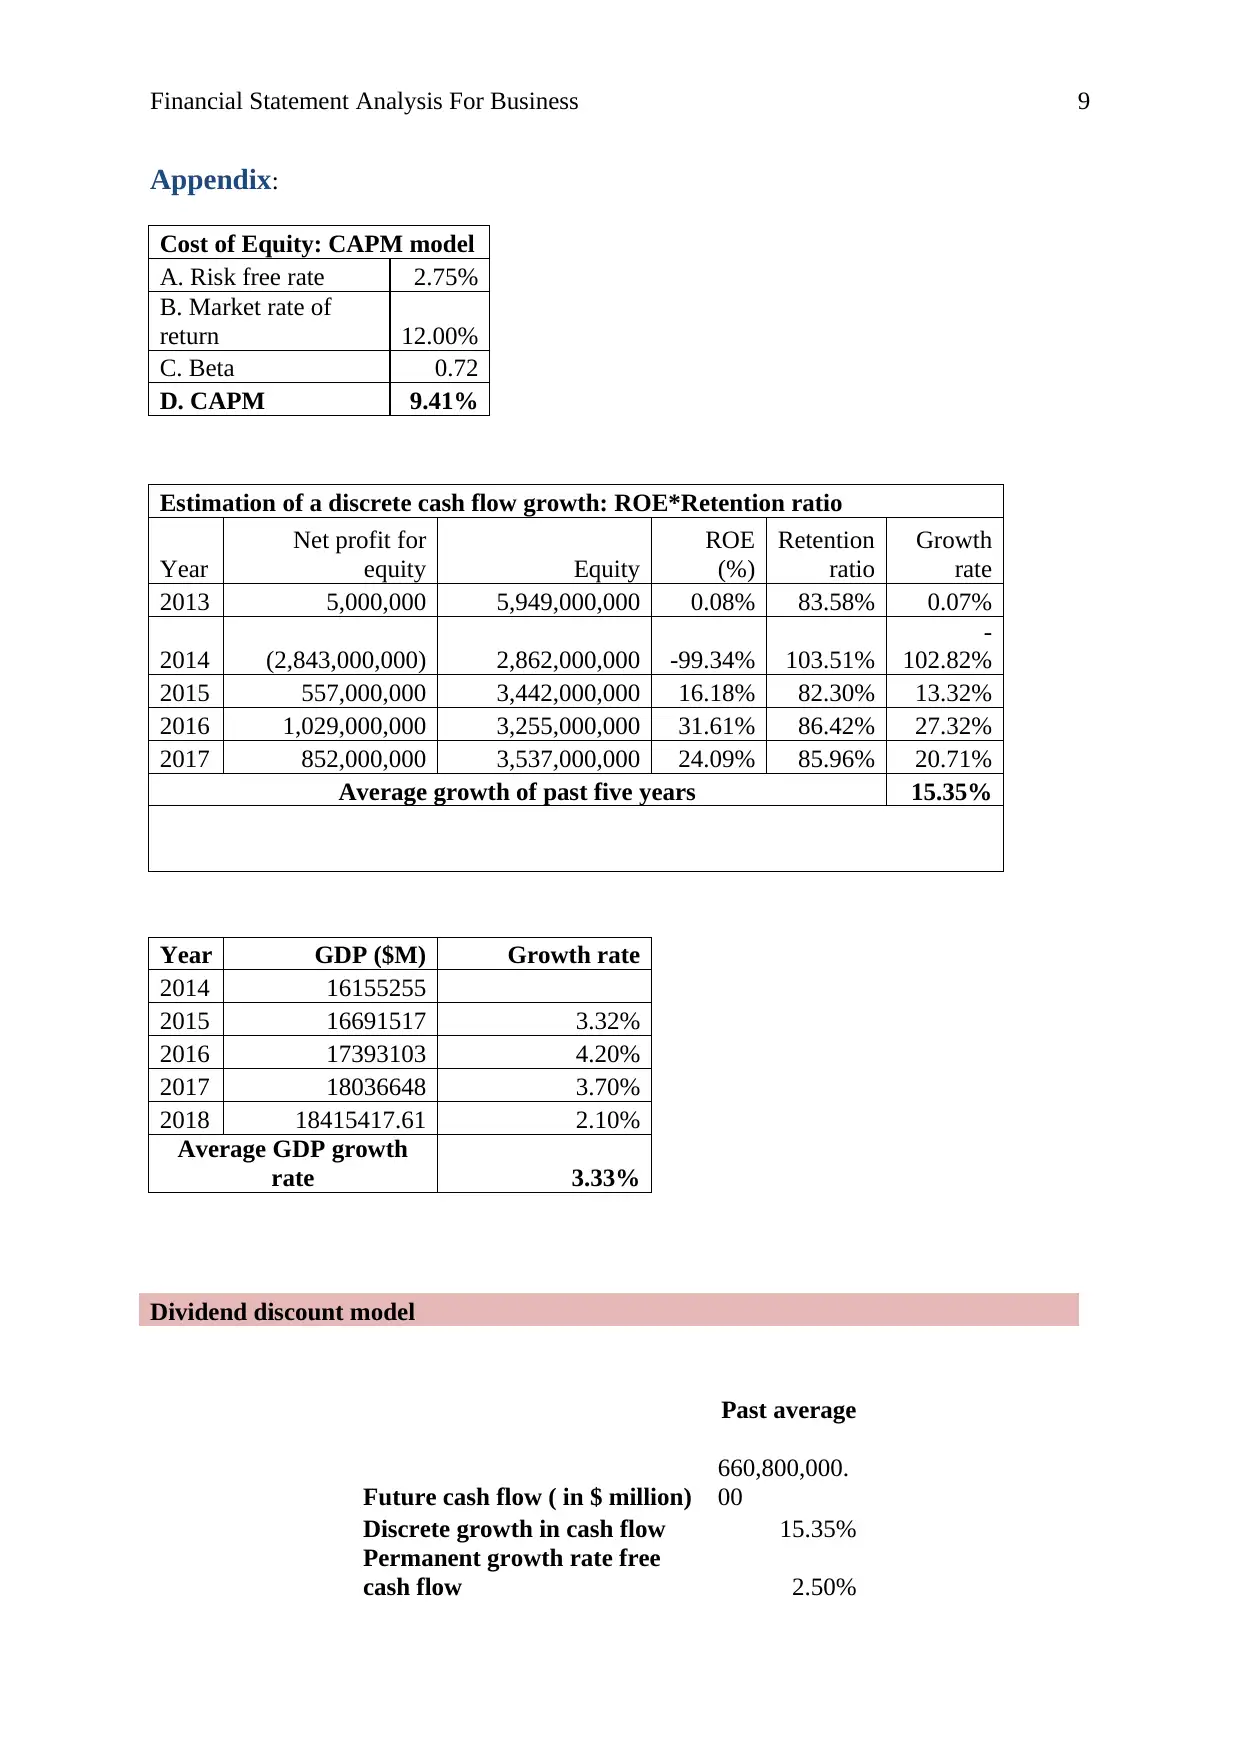
Cost of Equity: CAPM model
A. Risk free rate 2.75%
B. Market rate of
return 12.00%
C. Beta 0.72
D. CAPM 9.41%
Estimation of a discrete cash flow growth: ROE*Retention ratio
Year
Net profit for
equity Equity
ROE
(%)
Retention
ratio
Growth
rate
2013 5,000,000 5,949,000,000 0.08% 83.58% 0.07%
2014 (2,843,000,000) 2,862,000,000 -99.34% 103.51%
-
102.82%
2015 557,000,000 3,442,000,000 16.18% 82.30% 13.32%
2016 1,029,000,000 3,255,000,000 31.61% 86.42% 27.32%
2017 852,000,000 3,537,000,000 24.09% 85.96% 20.71%
Average growth of past five years 15.35%
Year GDP ($M) Growth rate
2014 16155255
2015 16691517 3.32%
2016 17393103 4.20%
2017 18036648 3.70%
2018 18415417.61 2.10%
Average GDP growth
rate 3.33%
Dividend discount model
Past average
Future cash flow ( in $ million)
660,800,000.
00
Discrete growth in cash flow 15.35%
Permanent growth rate free
cash flow 2.50%
Appendix:
Cost of Equity: CAPM model
A. Risk free rate 2.75%
B. Market rate of
return 12.00%
C. Beta 0.72
D. CAPM 9.41%
Estimation of a discrete cash flow growth: ROE*Retention ratio
Year
Net profit for
equity Equity
ROE
(%)
Retention
ratio
Growth
rate
2013 5,000,000 5,949,000,000 0.08% 83.58% 0.07%
2014 (2,843,000,000) 2,862,000,000 -99.34% 103.51%
-
102.82%
2015 557,000,000 3,442,000,000 16.18% 82.30% 13.32%
2016 1,029,000,000 3,255,000,000 31.61% 86.42% 27.32%
2017 852,000,000 3,537,000,000 24.09% 85.96% 20.71%
Average growth of past five years 15.35%
Year GDP ($M) Growth rate
2014 16155255
2015 16691517 3.32%
2016 17393103 4.20%
2017 18036648 3.70%
2018 18415417.61 2.10%
Average GDP growth
rate 3.33%
Dividend discount model
Past average
Future cash flow ( in $ million)
660,800,000.
00
Discrete growth in cash flow 15.35%
Permanent growth rate free
cash flow 2.50%
⊘ This is a preview!⊘
Do you want full access?
Subscribe today to unlock all pages.
Trusted by 1+ million students worldwide
Financial Statement Analysis For Business 10
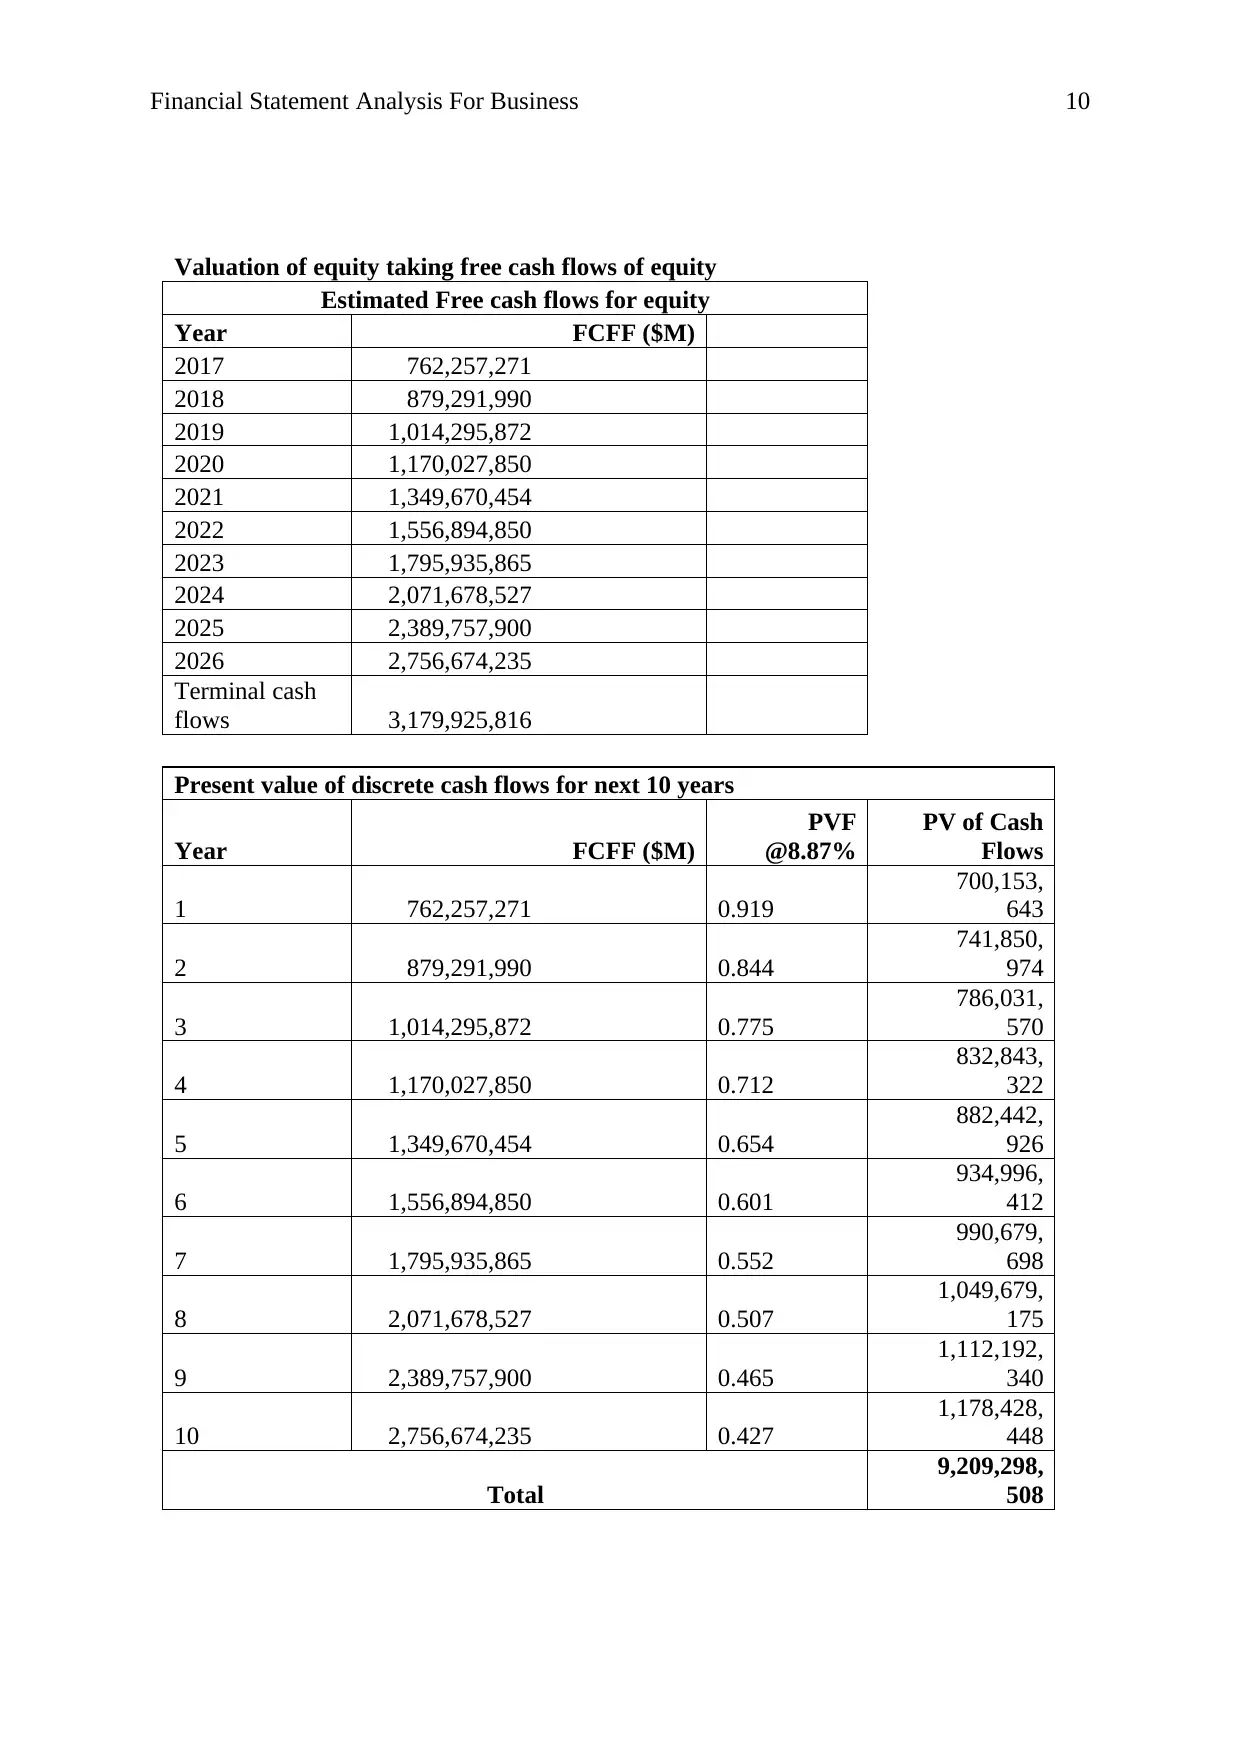
Valuation of equity taking free cash flows of equity
Estimated Free cash flows for equity
Year FCFF ($M)
2017 762,257,271
2018 879,291,990
2019 1,014,295,872
2020 1,170,027,850
2021 1,349,670,454
2022 1,556,894,850
2023 1,795,935,865
2024 2,071,678,527
2025 2,389,757,900
2026 2,756,674,235
Terminal cash
flows 3,179,925,816
Present value of discrete cash flows for next 10 years
Year FCFF ($M)
PVF
@8.87%
PV of Cash
Flows
1 762,257,271 0.919
700,153,
643
2 879,291,990 0.844
741,850,
974
3 1,014,295,872 0.775
786,031,
570
4 1,170,027,850 0.712
832,843,
322
5 1,349,670,454 0.654
882,442,
926
6 1,556,894,850 0.601
934,996,
412
7 1,795,935,865 0.552
990,679,
698
8 2,071,678,527 0.507
1,049,679,
175
9 2,389,757,900 0.465
1,112,192,
340
10 2,756,674,235 0.427
1,178,428,
448
Total
9,209,298,
508
Paraphrase This Document
Need a fresh take? Get an instant paraphrase of this document with our AI Paraphraser
Financial Statement Analysis For Business 11
Present value of terminal cash flows
Terminal cash
flows 3,179,925,816 49,920,342,475
Total value of Equity
59,129,640,982.
23
No of Shares Outstanding
1,853,000,000.0
0
Per share value of value of equity 31.91
Present value of terminal cash flows
Terminal cash
flows 3,179,925,816 49,920,342,475
Total value of Equity
59,129,640,982.
23
No of Shares Outstanding
1,853,000,000.0
0
Per share value of value of equity 31.91
1 out of 11
Related Documents


Your All-in-One AI-Powered Toolkit for Academic Success.
+13062052269
info@desklib.com
Available 24*7 on WhatsApp / Email
![[object Object]](/_next/static/media/star-bottom.7253800d.svg)
Unlock your academic potential
Copyright © 2020–2026 A2Z Services. All Rights Reserved. Developed and managed by ZUCOL.