Qantas Limited: Business Valuation and Financial Analysis Report
VerifiedAdded on 2020/03/01
|15
|4034
|39
Report
AI Summary
This report offers a comprehensive financial analysis of Qantas Limited, evaluating its performance through various lenses. It begins with an introduction and company overview, followed by an examination of Porter's 5 Forces model and a SWOT analysis to assess external and internal factors. The report then delves into the company's corporate strategy and accounting policies, including revenue and expense recognition, and asset and liability recording. A key aspect involves analyzing Qantas's financial position in 2013, 2015, and 2016 using financial ratios to gauge liquidity, profitability, capital structure, and efficiency. The analysis includes interpretation of current, quick, and profitability ratios, among others, to provide a detailed understanding of the company's financial health. The report concludes with recommendations and conclusions based on the findings, supported by references and an appendix with relevant financial data.
RUNNING HEAD: Business valuation and analysis
1
Business Valuation and Analysis
1
Business Valuation and Analysis
Paraphrase This Document
Need a fresh take? Get an instant paraphrase of this document with our AI Paraphraser
Business valuation and analysis
2
Contents
Introduction.......................................................................................................................3
Company overview...........................................................................................................3
Porter’s 5 forces model.....................................................................................................3
Industry Competitors....................................................................................................3
Threat of new entrance.................................................................................................4
Threat of substitute products........................................................................................4
Bargaining power of suppliers......................................................................................4
Bargaining power of buyers..........................................................................................4
SWOT analysis.................................................................................................................4
Strengths.......................................................................................................................5
Weakness......................................................................................................................5
Opportunity...................................................................................................................5
Threat............................................................................................................................6
Corporate Strategy............................................................................................................6
Accounting policy.............................................................................................................6
Revenue and expenses recognition...............................................................................7
Asset and liability recording.........................................................................................7
Financial position of the company in 2013.......................................................................7
Financial position of the company in 2015 and 2016.......................................................8
Analysis the data of 2013, 2015 and 2016........................................................................9
Recommendation and Conclusion..................................................................................10
Business valuation and analysis
3
References.......................................................................................................................11
Appendix.........................................................................................................................13
Introduction:
This report depicts the user about the financial and non financial condition and factor
of the Qantas limited. This study has been performed after analyzing the Qantas case study.
In this case study report, SWOT analysis porter’s 5 forces model has been analyzed over the
Qantas limited. More, company’s corporate strategy has been investigated to recognize the
financial and non financial condition of the company. Further, the financial data of 2013,
2015 and 2016 has been analyzed by the company to understand the performance of the
company.
Company overview:
Case study over Qantas limited depict that it is one of the oldest firm in the aviation
industry. Currently, the market share of this company is greater than any other firm in the
industry. The main operation of this company is to offer longest distance airways. This
company came into existence in 1920 in the Queensland. These days, this company has
operating its business into 42 countries with 173 offices and 35000 employees (Qantas,
2016). Many further operations have also been started by this firm to manage the
performance such as Qantas holidays, budget airlines, Qantas catering, Jetstar etc. to evaluate
and cram the situation of the firm. Red kangaroo is the symbol of the company. Currently, the
main office of the company is in Australia. The main revelation of Qantas is contributing the
best eminence services in fewer fare prices to the customers. Qantas is disparate in Australian
aviation industry since FSC and LCC is hold by this company only.
Porter’s 5 forces model:
Porter’s 5 forces model of the company has been analyzed to identify the external
factor which influences the performance of the company. The analysis over it is as follows:
Industry Competitors:
⊘ This is a preview!⊘
Do you want full access?
Subscribe today to unlock all pages.
Trusted by 1+ million students worldwide
Business valuation and analysis
4
Industry competition depict about the various firms which are operating in the same
industry. As according to the case study, fewer firms are there in the Australian aviation
industry and none of them is equal to the Qantas limited in terms of performance, profitability
and market share. Further, it has been analyzed that various firms are there in the market to
give a high competition to the company. It has been observed that company must adopt some
new strategy to save itself from huge competition (Frazer, 2015). It has been analyzed
through the case study that cost leadership strategy is required to be modified as it would not
help the company further.
Threat of new entrance:
Threat of new entrants depict about the new firms which are trying to enter into the
industry. As according to the case study, it is not easy for the firms to enter into the aviation
industry as huge amount, technology and operating costs, professionals etc are required to
enter into the firm. Further, it has been analyzed that various firms are trying to enter in the
market to give a high competition to the company. It has been observed that company the
threat from new entrants is quite less to the company.
Threat of substitute products:
Threat of substitute product depict about the new products which are almost similar to
the existing product. As according to the case study, various substitutes are available in the
market. Basically, people use the aviation way to save their time but many other sources are
also available in the market to move a people from one place to another such as car, bus,
bike, train, rental cars etc. Further, it has been analyzed that various substitutes are trying to
enter in the market to give a high competition to the company. It has been observed that the
threat from substitute is quite less to the company (Coughlin et. Al, 2002).
Bargaining power of suppliers:
Bargaining power of supplier depict about the suppliers power to influence the price
and quality of raw products. As according to the case study, various raw materials are
required from the market. Basically, fuel and aircrafts are important element. Further, it has
been analyzed that company is taking the products from one of the biggest supplier in the
marketplace so this is strength for the company.
Paraphrase This Document
Need a fresh take? Get an instant paraphrase of this document with our AI Paraphraser
Business valuation and analysis
5
Bargaining power of buyers:
` Bargaining power of buyers depict about the buyer power to influence the price and
other factors. As according to the case study, various clients are available in the market and
various firms are also available to serve them so buyers have the power to influence the price
of the company and the operations as well (Brigden, 2009).
SWOT analysis:
SWOT analysis of the company has been analyzed to identify the external factor
which influences the performance of the company. The analysis over it is as follows:
Strengths:
Qantas limited’s strengths are as follows:
Monopoly of the company in Australia
Oldest airline
Highest market share in Australia
Strong Backing of Australian Government
20 domestic and global destinations
Huge sponsorship and advertising campaign
Great market share (Brigden and Cathy, 2009)
Weakness:
Qantas limited’s weaknesses are as follows:
Too Much special treatment around Australian marketplace
Issue amid employees resourced an issue
Opportunity:
Qantas limited’s opportunities are as follows:
More market share could be grabbed through tapping the untapped market
Huge technology
Business valuation and analysis
6
Investors attractiveness
Asian various tourist destination
Joint venture with international brands
(Craigie and Bekiaris, 2010)
Threat:
Qantas limited’s threats are as follows:
high fuel prices
the high labour cost
Huge competition in the market due to new entries.
Corporate Strategy:
The case study over Qantas limited has been analyzed to investigate over the
corporate strategy of the company. Various factors related to Qantas limited’s corporate
strategy has been analyzed through these case studies. The company has come into existence
in the 1920 and from that time, company is opting new strategies to manage the business and
enjoy the growth.
It has been analyzed that after 1992, company has made many changes into its
strategy, operations, functioning, technology, sources etc to manage and enhance the
performance and profitability of the company. It has been analyzed through this study that
company has adopted mainly 2 strategies to manage the performance and profitability of the
company. Company has used international expansion strategy and diversification strategy for
this business. After adopting these strategies various changes have taken place into the
operations of the company.
These days, this company has operating its business into 42 countries with 173
offices and 35000 employees (Qantas, 2016). Many further operations have also been started
by this firm to manage the performance such as Qantas holidays, budget airlines, Qantas
catering, Jetstar etc. to evaluate and cram the situation of the firm. This has taken place due to
the new strategy of the company and thus it could be said that the performance of the
company has been changed on a huge basis.
⊘ This is a preview!⊘
Do you want full access?
Subscribe today to unlock all pages.
Trusted by 1+ million students worldwide
Business valuation and analysis
7
Accounting policy:
The Qantas limited’s case study depict that the company is peppering the final
financial data after analyzing the various point related to the company and further, it has been
analyzed that it is required by every company to manage the reports according to the
accounting policies. It has been observed through this case study that the final data must be
investigated by an auditor to make it reliable about the statements of the company. Auditors
analyze the final information of a company on the basis of many points out of which
accounting policies are quite main. Accounting policies are the rules, process and principles
which must be executed in the final reports of the company by the top level man agent.
Accoutring policies have various principles, but according to the aviation industry, assets and
liability recording and revenue recognition are important point (Dallas, 2011). These
principles must be observed by the auditors while investigating over the financial statement
of the company. The main concept of these principles is as follows:
Revenue and expenses recognition:
IFRS and US GAAP rules describe that an association must identify entire income
and expenses according to the market value in the income statement. Revenue is recognized
as income of an association which could be get by the corporation at the time of trading the
products or services like sales, long term gains, interest income, short term profits etc
whereas expense is recognized as loss of an association which could be paid by the
corporation at the time of trading the products or services like COGS, labour, salaries,
operational expenses etc. (D’Aveni, Dagnino & Smith, K2010). The accounting rules depict
that the expenses must be recorded in the debit column whereas the income must be recorded
in the credit column in the income statement.
Asset and liability recording:
IFRS and US GAAP rules describe that an association must identify entire asset and
liabilities according to the market value in the balance sheet. assets is recognized as
economical profit of an association which could be converted by the corporation accrording
to the nature of the assets as short term asset could be converted in a year and long term asset
take some time such as debtors, plants etc. whereas liability is recognized as debt of an
association which could be converted by the corporation accrording to the nature of the
Paraphrase This Document
Need a fresh take? Get an instant paraphrase of this document with our AI Paraphraser
Business valuation and analysis
8
liability as short term liability could be converted in a year and long term liability take some
time such as debtors, plants etc. double entry accounting system is helpful in it as the total
asset is equal to the liability and capital of the company.
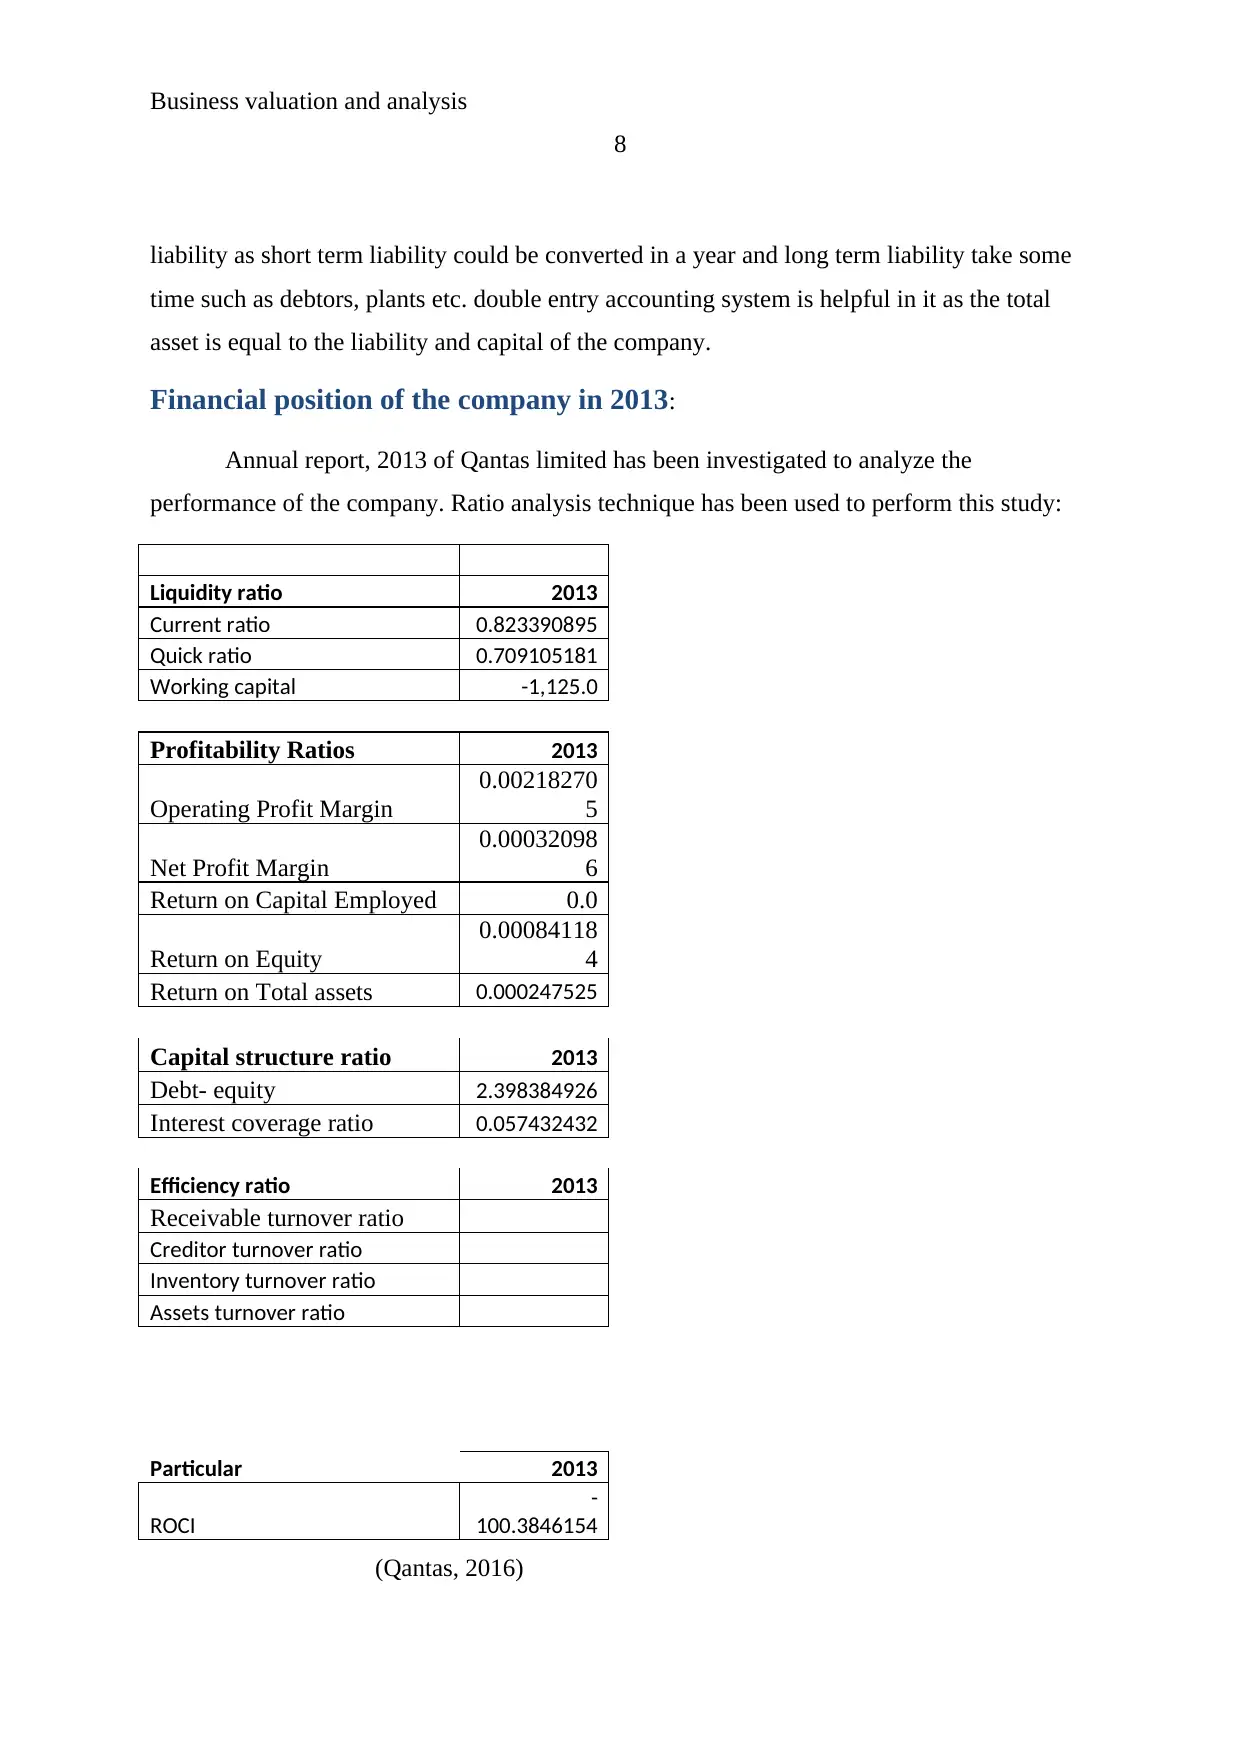
Financial position of the company in 2013:
Annual report, 2013 of Qantas limited has been investigated to analyze the
performance of the company. Ratio analysis technique has been used to perform this study:
Liquidity ratio 2013
Current ratio 0.823390895
Quick ratio 0.709105181
Working capital -1,125.0
Profitability Ratios 2013
Operating Profit Margin
0.00218270
5
Net Profit Margin
0.00032098
6
Return on Capital Employed 0.0
Return on Equity
0.00084118
4
Return on Total assets 0.000247525
Capital structure ratio 2013
Debt- equity 2.398384926
Interest coverage ratio 0.057432432
Efficiency ratio 2013
Receivable turnover ratio
Creditor turnover ratio
Inventory turnover ratio
Assets turnover ratio
Particular 2013
ROCI
-
100.3846154
(Qantas, 2016)
8
liability as short term liability could be converted in a year and long term liability take some
time such as debtors, plants etc. double entry accounting system is helpful in it as the total
asset is equal to the liability and capital of the company.
Financial position of the company in 2013:
Annual report, 2013 of Qantas limited has been investigated to analyze the
performance of the company. Ratio analysis technique has been used to perform this study:
Liquidity ratio 2013
Current ratio 0.823390895
Quick ratio 0.709105181
Working capital -1,125.0
Profitability Ratios 2013
Operating Profit Margin
0.00218270
5
Net Profit Margin
0.00032098
6
Return on Capital Employed 0.0
Return on Equity
0.00084118
4
Return on Total assets 0.000247525
Capital structure ratio 2013
Debt- equity 2.398384926
Interest coverage ratio 0.057432432
Efficiency ratio 2013
Receivable turnover ratio
Creditor turnover ratio
Inventory turnover ratio
Assets turnover ratio
Particular 2013
ROCI
-
100.3846154
(Qantas, 2016)
Business valuation and analysis
9
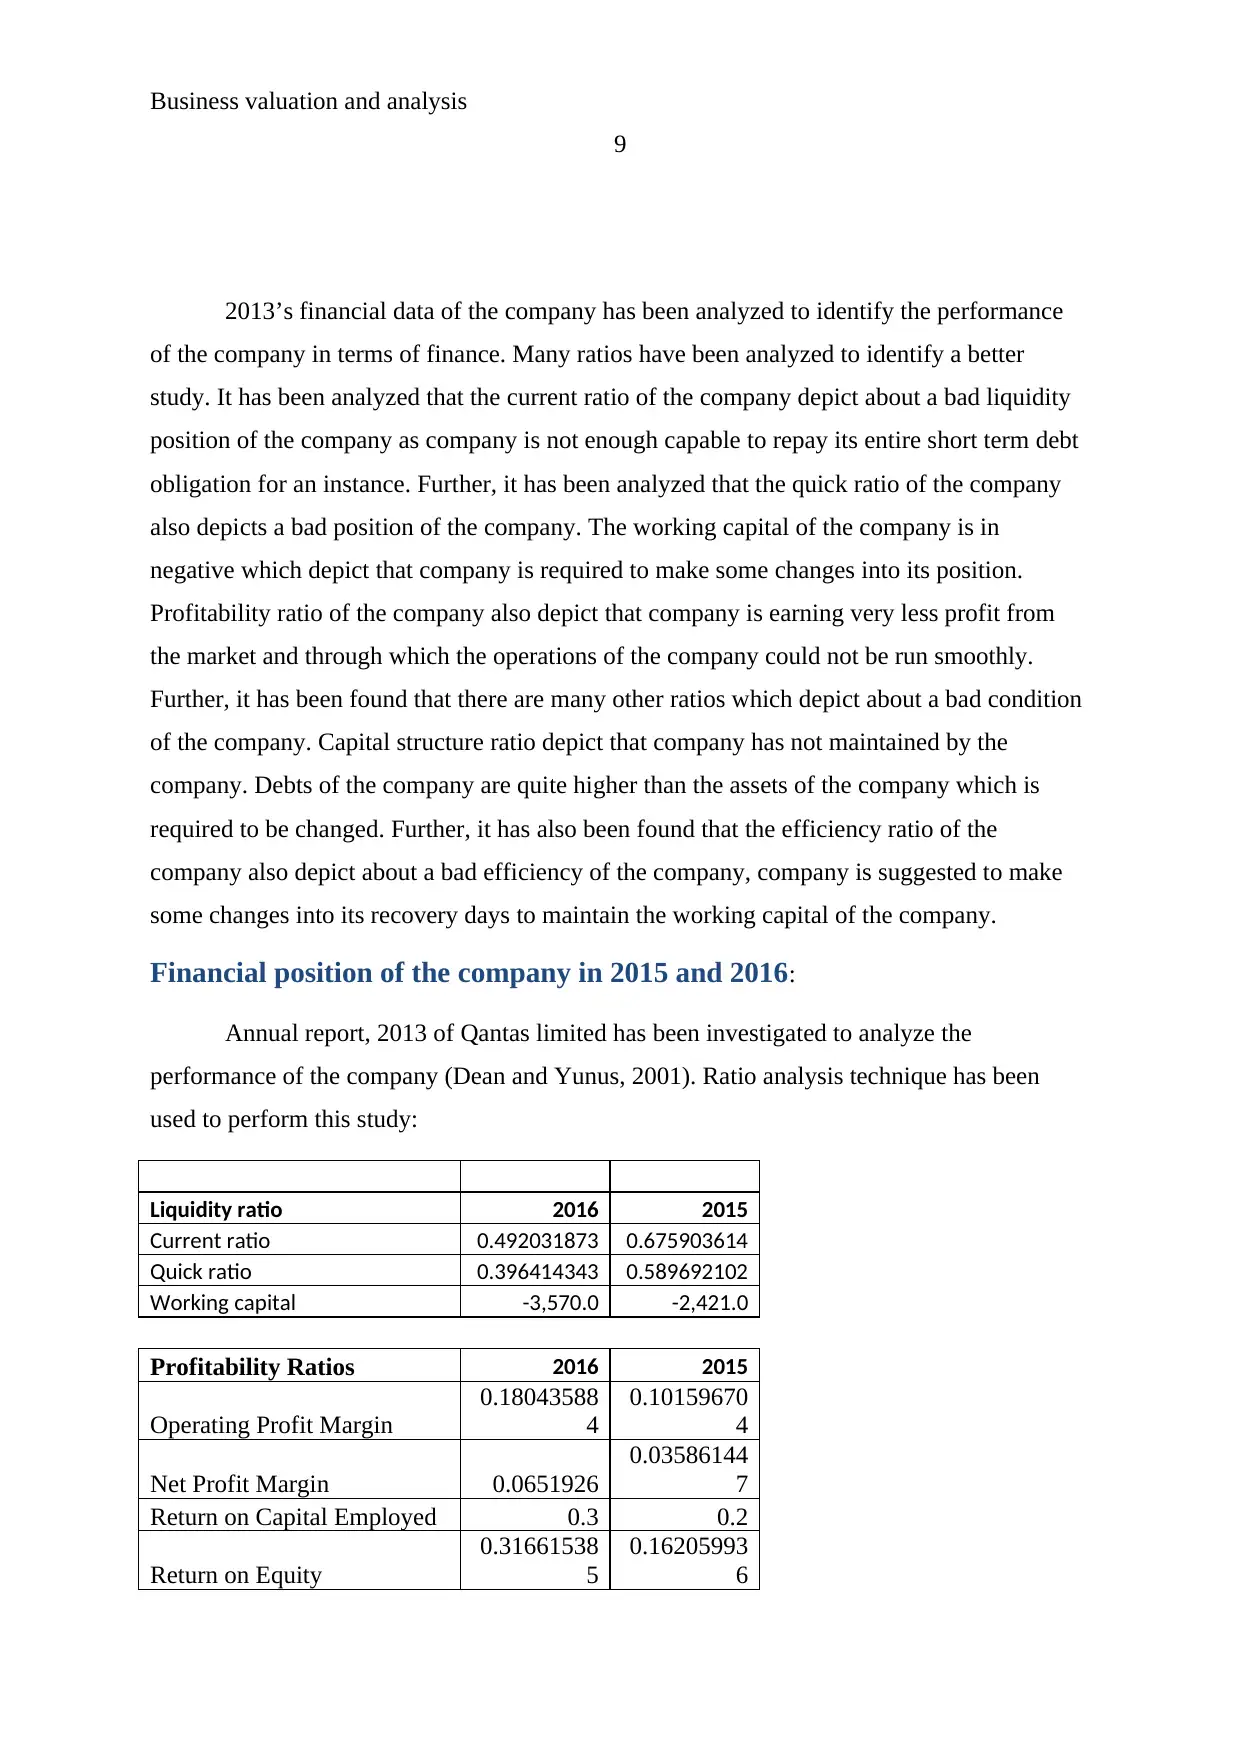
2013’s financial data of the company has been analyzed to identify the performance
of the company in terms of finance. Many ratios have been analyzed to identify a better
study. It has been analyzed that the current ratio of the company depict about a bad liquidity
position of the company as company is not enough capable to repay its entire short term debt
obligation for an instance. Further, it has been analyzed that the quick ratio of the company
also depicts a bad position of the company. The working capital of the company is in
negative which depict that company is required to make some changes into its position.
Profitability ratio of the company also depict that company is earning very less profit from
the market and through which the operations of the company could not be run smoothly.
Further, it has been found that there are many other ratios which depict about a bad condition
of the company. Capital structure ratio depict that company has not maintained by the
company. Debts of the company are quite higher than the assets of the company which is
required to be changed. Further, it has also been found that the efficiency ratio of the
company also depict about a bad efficiency of the company, company is suggested to make
some changes into its recovery days to maintain the working capital of the company.
Financial position of the company in 2015 and 2016:
Annual report, 2013 of Qantas limited has been investigated to analyze the
performance of the company (Dean and Yunus, 2001). Ratio analysis technique has been
used to perform this study:
Liquidity ratio 2016 2015
Current ratio 0.492031873 0.675903614
Quick ratio 0.396414343 0.589692102
Working capital -3,570.0 -2,421.0
Profitability Ratios 2016 2015
Operating Profit Margin
0.18043588
4
0.10159670
4
Net Profit Margin 0.0651926
0.03586144
7
Return on Capital Employed 0.3 0.2
Return on Equity
0.31661538
5
0.16205993
6
9
2013’s financial data of the company has been analyzed to identify the performance
of the company in terms of finance. Many ratios have been analyzed to identify a better
study. It has been analyzed that the current ratio of the company depict about a bad liquidity
position of the company as company is not enough capable to repay its entire short term debt
obligation for an instance. Further, it has been analyzed that the quick ratio of the company
also depicts a bad position of the company. The working capital of the company is in
negative which depict that company is required to make some changes into its position.
Profitability ratio of the company also depict that company is earning very less profit from
the market and through which the operations of the company could not be run smoothly.
Further, it has been found that there are many other ratios which depict about a bad condition
of the company. Capital structure ratio depict that company has not maintained by the
company. Debts of the company are quite higher than the assets of the company which is
required to be changed. Further, it has also been found that the efficiency ratio of the
company also depict about a bad efficiency of the company, company is suggested to make
some changes into its recovery days to maintain the working capital of the company.
Financial position of the company in 2015 and 2016:
Annual report, 2013 of Qantas limited has been investigated to analyze the
performance of the company (Dean and Yunus, 2001). Ratio analysis technique has been
used to perform this study:
Liquidity ratio 2016 2015
Current ratio 0.492031873 0.675903614
Quick ratio 0.396414343 0.589692102
Working capital -3,570.0 -2,421.0
Profitability Ratios 2016 2015
Operating Profit Margin
0.18043588
4
0.10159670
4
Net Profit Margin 0.0651926
0.03586144
7
Return on Capital Employed 0.3 0.2
Return on Equity
0.31661538
5
0.16205993
6
⊘ This is a preview!⊘
Do you want full access?
Subscribe today to unlock all pages.
Trusted by 1+ million students worldwide
Business valuation and analysis
10
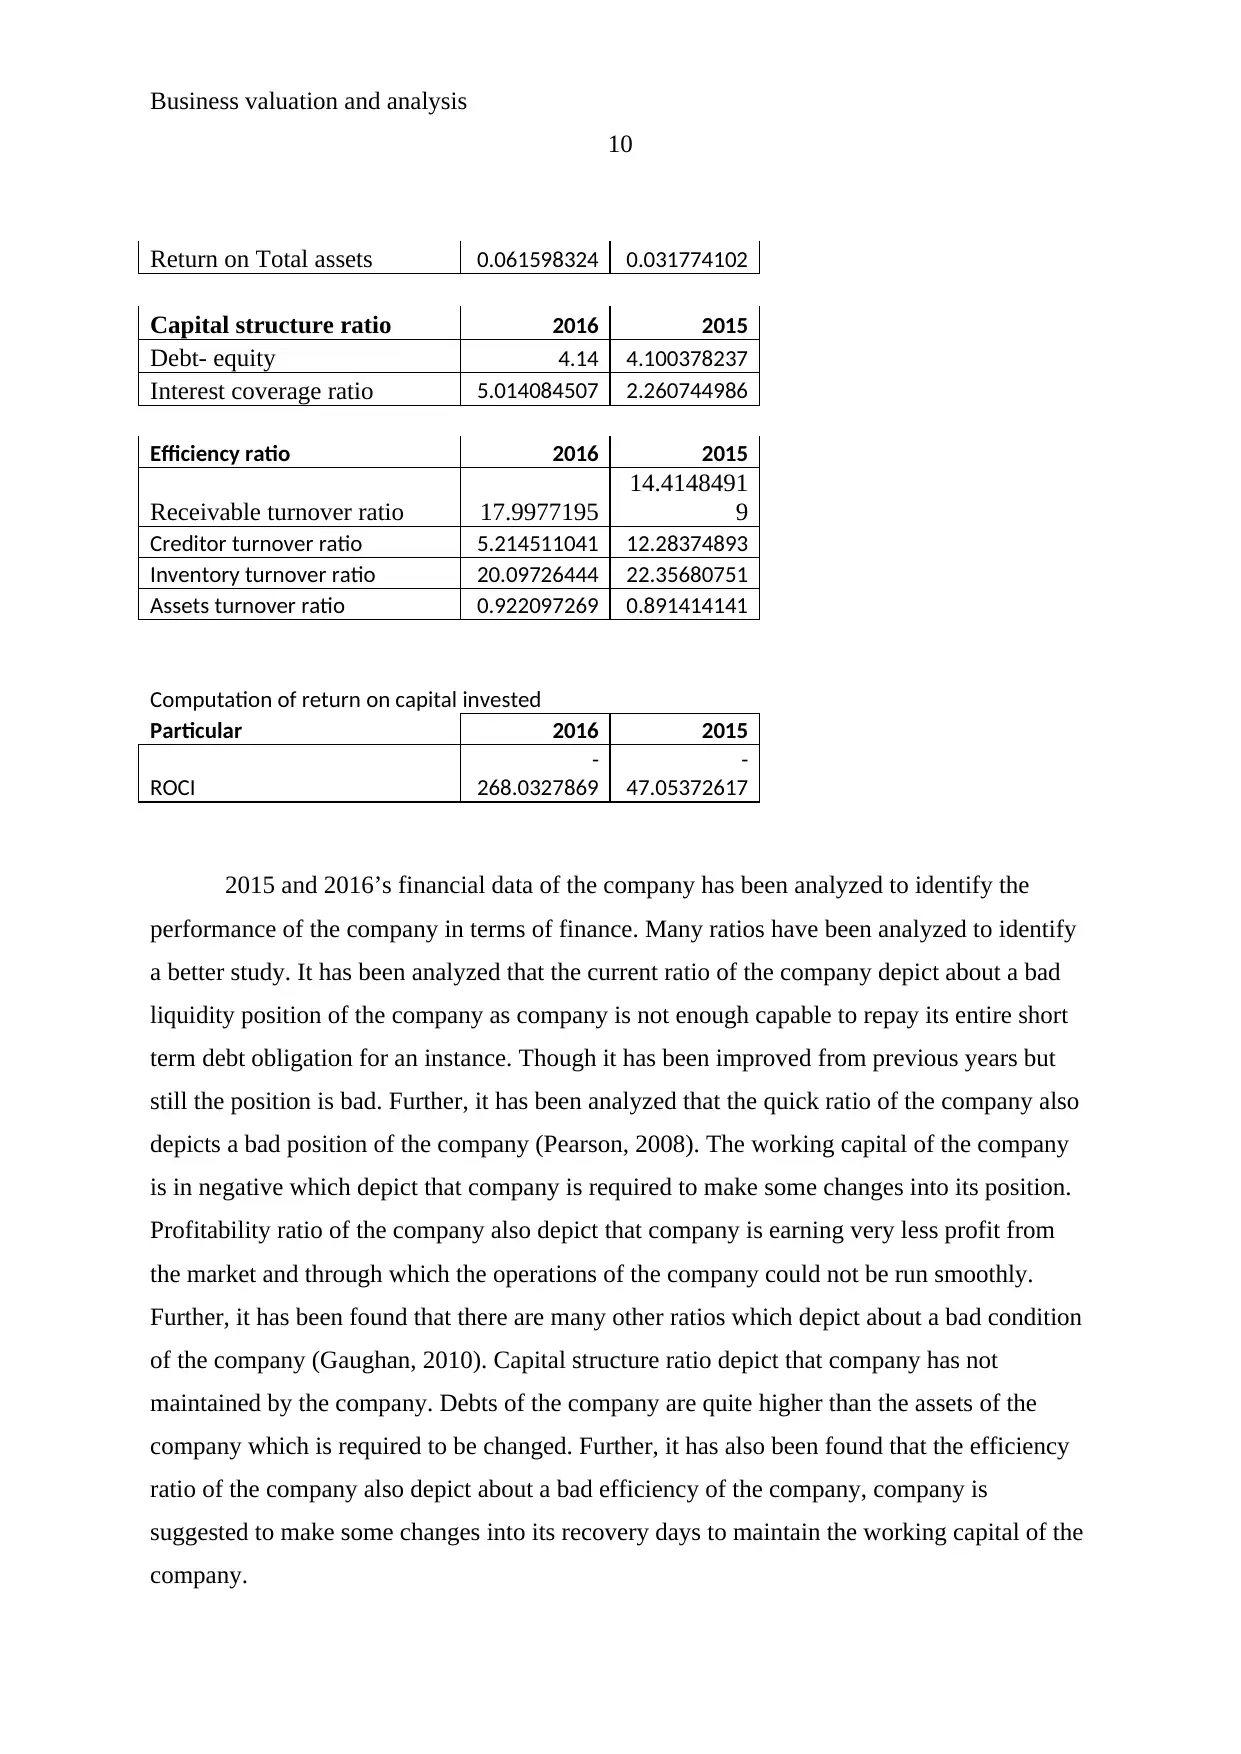
Return on Total assets 0.061598324 0.031774102
Capital structure ratio 2016 2015
Debt- equity 4.14 4.100378237
Interest coverage ratio 5.014084507 2.260744986
Efficiency ratio 2016 2015
Receivable turnover ratio 17.9977195
14.4148491
9
Creditor turnover ratio 5.214511041 12.28374893
Inventory turnover ratio 20.09726444 22.35680751
Assets turnover ratio 0.922097269 0.891414141
Computation of return on capital invested
Particular 2016 2015
ROCI
-
268.0327869
-
47.05372617
2015 and 2016’s financial data of the company has been analyzed to identify the
performance of the company in terms of finance. Many ratios have been analyzed to identify
a better study. It has been analyzed that the current ratio of the company depict about a bad
liquidity position of the company as company is not enough capable to repay its entire short
term debt obligation for an instance. Though it has been improved from previous years but
still the position is bad. Further, it has been analyzed that the quick ratio of the company also
depicts a bad position of the company (Pearson, 2008). The working capital of the company
is in negative which depict that company is required to make some changes into its position.
Profitability ratio of the company also depict that company is earning very less profit from
the market and through which the operations of the company could not be run smoothly.
Further, it has been found that there are many other ratios which depict about a bad condition
of the company (Gaughan, 2010). Capital structure ratio depict that company has not
maintained by the company. Debts of the company are quite higher than the assets of the
company which is required to be changed. Further, it has also been found that the efficiency
ratio of the company also depict about a bad efficiency of the company, company is
suggested to make some changes into its recovery days to maintain the working capital of the
company.
10
Return on Total assets 0.061598324 0.031774102
Capital structure ratio 2016 2015
Debt- equity 4.14 4.100378237
Interest coverage ratio 5.014084507 2.260744986
Efficiency ratio 2016 2015
Receivable turnover ratio 17.9977195
14.4148491
9
Creditor turnover ratio 5.214511041 12.28374893
Inventory turnover ratio 20.09726444 22.35680751
Assets turnover ratio 0.922097269 0.891414141
Computation of return on capital invested
Particular 2016 2015
ROCI
-
268.0327869
-
47.05372617
2015 and 2016’s financial data of the company has been analyzed to identify the
performance of the company in terms of finance. Many ratios have been analyzed to identify
a better study. It has been analyzed that the current ratio of the company depict about a bad
liquidity position of the company as company is not enough capable to repay its entire short
term debt obligation for an instance. Though it has been improved from previous years but
still the position is bad. Further, it has been analyzed that the quick ratio of the company also
depicts a bad position of the company (Pearson, 2008). The working capital of the company
is in negative which depict that company is required to make some changes into its position.
Profitability ratio of the company also depict that company is earning very less profit from
the market and through which the operations of the company could not be run smoothly.
Further, it has been found that there are many other ratios which depict about a bad condition
of the company (Gaughan, 2010). Capital structure ratio depict that company has not
maintained by the company. Debts of the company are quite higher than the assets of the
company which is required to be changed. Further, it has also been found that the efficiency
ratio of the company also depict about a bad efficiency of the company, company is
suggested to make some changes into its recovery days to maintain the working capital of the
company.
Paraphrase This Document
Need a fresh take? Get an instant paraphrase of this document with our AI Paraphraser
Business valuation and analysis
11
Analysis the data of 2013, 2015-2016:
Through doing a study over the Qantas limited and its financial data of the year of
2013, 2015-2016, it has been observed that the company has faced many issues in last few
years due to many internal s well as external factors. It has also been investigated that various
strategies have been adopted by Qantas limited to enhance the performance (Elmuti and
Kathawala, 2001).
This study depict that the performance of the company is similar in 2013 as well as in
2015 and 2016. It has been analyzed that the liquid position of the company is also similar.
Still the company is facing the issue of meeting its short term debt obligation. Further, it has
been analyzed that the company is still not able to enjoy the high profits. Though, the
profitability ratios have been enhanced but still company is required to do more efforts.
Further, the capital structure ratio of the company is not at all good. Company is required to
make some changes into it, thus it has been found that there are very less changes into the
financial performance in the company from 2013 in 2015 and 2016.
Recommendation and Conclusion:
Thus this case study over Qantas limited depict that the company is required to make
some changes into its financial and non financial figures to enhance the performance. It has
been found that it is the biggest company in the aviation industry but still due to many
external and internal issues, the performance of the company has been lowered. Company is
suggested to make some changes into the operations of the company to enhance its
performance.
Business valuation and analysis
12
References:
Barney, J. 1992. ‘Firm Resources and Sustained Competitive Advantage’. Journal of
Management, vol. 17, no. 1, p. 99.
Brigden, Cathy. 2009. Journal of Industrial Relations. Unions and collective bargaining in
2008, 513, 365-378.
Campbell, A, Goold, M and Alexander, M. 1995. Corporate Strategy: The Quest for
Parenting Advantage. Harvard Business Review, viewed 18 Jan 2017,
<https://hbr.org/1995/03/corporate-strategy-the-quest-for-parenting-advantageandgt.
Coughlin, Cletus C. and et. Al. 2002. Review. Aviation Security and Terrorism: A Review of
the Economic Issues, 845, 9-16.
Craigie, J. Bekiaris, M. 2010. Money. Qantas gets cosy with AirAsia, 2120, 16-16.
D’Aveni, R, Dagnino, G, and Smith, K. 2010. The age of temporary advantage. Strategic
Management Journal, 31, 13, pp. 1371-1385, Business Source Complete, EBSCOhost,
viewed 18 Jan 2017.
Dallas, H, 2011. “Strategic Management; competitiveness and globalization”. Strategic
management, Asia-Pacific 4th ed, pp 434-440.
Datamonitor. 2009. Airline Industry Profile: Asia-Pacific. Airline Industry Profile: Asia-
Pacific, 1-32.
Dean, E. and Yunus, K. 2001. ”An overview of strategic alliances”. Management Decision,
Vol. 39 Iss 3 pp. 205 – 218.
Elmuti, D. and Kathawala, Y. 2001. “An overview of strategic alliances”. Management
Decision, vol. 39, no. 3, pp. 205-217.
Frazer, S 2015. Jetstar expansion stalled by Hong Kong authorities, Text, ABC News, viewed
12 October 2015. http://www.abc.net.au/news/2015-06-26/jetstar-expansion-stalled-by-hong-
kong-authorities/6576346andgt.
Fu, X., Oum, T.H. and Zhang, A. 2010. “Air Transport Liberalization and Its Impacts on
Airline Competition and Air Passenger Traffic”. Transportation Journal, vol. 49, no. 4, pp.
24-41.
⊘ This is a preview!⊘
Do you want full access?
Subscribe today to unlock all pages.
Trusted by 1+ million students worldwide
1 out of 15
Related Documents


Your All-in-One AI-Powered Toolkit for Academic Success.
+13062052269
info@desklib.com
Available 24*7 on WhatsApp / Email
![[object Object]](/_next/static/media/star-bottom.7253800d.svg)
Unlock your academic potential
Copyright © 2020–2026 A2Z Services. All Rights Reserved. Developed and managed by ZUCOL.