Financial Analysis Report: Qantas and Emirates Performance Comparison
VerifiedAdded on 2020/06/06
|38
|11354
|75
Report
AI Summary
This financial analysis report compares the financial positions of Qantas and Emirates, two major airlines. It utilizes various financial tools, including profitability, efficiency, liquidity, and gearing ratios, to assess their performance. The report also conducts horizontal and vertical analyses to evaluate growth trends and uses comparative analysis to benchmark the two companies. Furthermore, it examines both financial and non-financial measures to evaluate Qantas's performance, identifying its strengths and weaknesses. The analysis reveals insights into each company's financial health, helping to identify areas for improvement and strategic decision-making in the aviation industry. The report concludes with recommendations based on the findings.
Financial Analysis Report
Paraphrase This Document
Need a fresh take? Get an instant paraphrase of this document with our AI Paraphraser
Table of Contents
EXECUTIVE SUMMARY.............................................................................................................1
INTRODUCTION...........................................................................................................................2
TASK...............................................................................................................................................2
A. Profitability ratios...................................................................................................................2
B. Efficiency ratios......................................................................................................................6
C. Liquidity ratios.....................................................................................................................10
D. Gearing ratios.......................................................................................................................12
E. Horizontal common size analysis.........................................................................................14
F. Vertical common size analysis..............................................................................................19
G. Comparative analysis...........................................................................................................22
H. Evaluation of performance of business................................................................................25
CONCLUSION AND RECOMMENDATIONS..........................................................................26
REFERENCES..............................................................................................................................27
APPENDIX....................................................................................................................................28
EXECUTIVE SUMMARY
In this report there is the analysis carried out in context of financial position of Qantas
and emirates. There will be various aspects which are present in business which are related to
finance and for them analysis will have to be carried out. Under this certain tools are there that
are used. They involve ratio analysis in which various sectors such as profitability, liquidity,
efficiency and gearing are measured. It is identified that whether company is able to meet all the
requirements and standards in proper manner. Another part of the report shows horizontal and
vertical analysis that is carried out. In that performance of various years is compared so that
growth level can be determined and it can be known that how much development has taken
place. In addition to them comparative analysis is also done where the working of both the
companies are compared with one another so that it can be known that which one is better among
them. There are various measures that are used for performance evaluation and it includes both
financial and non financial methods. In this report a evaluation segment is made in which
performance of Qantas is taken into consideration and various aspects such as its structure,
performance measures and other factors are taken into consideration. In the analysis it is
identified that performance of which is growing at faster speed and which is in loss. All of these
are very important to carry on the business in most successful manner as by this all shortcomings
are identified and then measures are taken to remove them. This way it will be possible to make
the development process even better and fast.
1
⊘ This is a preview!⊘
Do you want full access?
Subscribe today to unlock all pages.
Trusted by 1+ million students worldwide
INTRODUCTION
In the global economy, there are various sectors which are present and one of the most
important among them is aviation industry. By the help of airline services, people are able to
travel from one place to another in an easy and convenient manner. In order to survive in this
sector, it is needed that proper analysis shall be carried out so that all the shortcomings and faults
in system can be identified (Almazari, 2012). It is necessary that services shall be provided at the
lowest possible cost as then only, it will be able to deal with high level of competition that is
existing in market. There are various expenses which are to be incurred and in order to carry out
this business, license will have to be obtained from government so that it can travel to other
countries.
There are many airlines which are providing these services and in this report, two of them
are taken into consideration which are Qantas and Emirates. Qantas is one of the largest airlines
that is established in Australia which provides the best facilities by using advanced technologies.
Whereas, emirates is a Dubai based airline which is also providing such services. In this report,
analysis will be carried out in order to evaluate the position of both companies. For this purpose,
several ratios will be calculated and also, vertical and horizontal analysis will be performed
(David, 2011). This helps in knowing the working in respect of certain years that is done by both
of them. On the basis of them, comparison will be made among both the organisations. Financial
and non-financial measures will also be used to evaluate the performance of any one company.
TASK
A. Profitability ratios
In business, it is important that profitability shall be examined as by this, company's
performance will be reflected. All investors and analysts will be able to gain knowledge about its
position and on that basis, they can take required decisions for the making of investments. There
are various metrics which are used in finance and they are all classified with the help of these
ratios (Carfì and Musolino, 2011). By the help of them, ability of business in terms of making
good earnings will be evaluated and all the expenditures which are made during that particular
period will be compared. For the assessment of this, several tools are there which can be taken
into use. Some of the main ratios which are included in this are net profit margin, gross profit
margin, return on investment as well as return on assets and equity. They are to be calculated as
2
Paraphrase This Document
Need a fresh take? Get an instant paraphrase of this document with our AI Paraphraser
various conclusions can be drawn on the basis of them and for that, proper understanding is
required to be obtained. For the same, explanation in relation to them is provided as below:
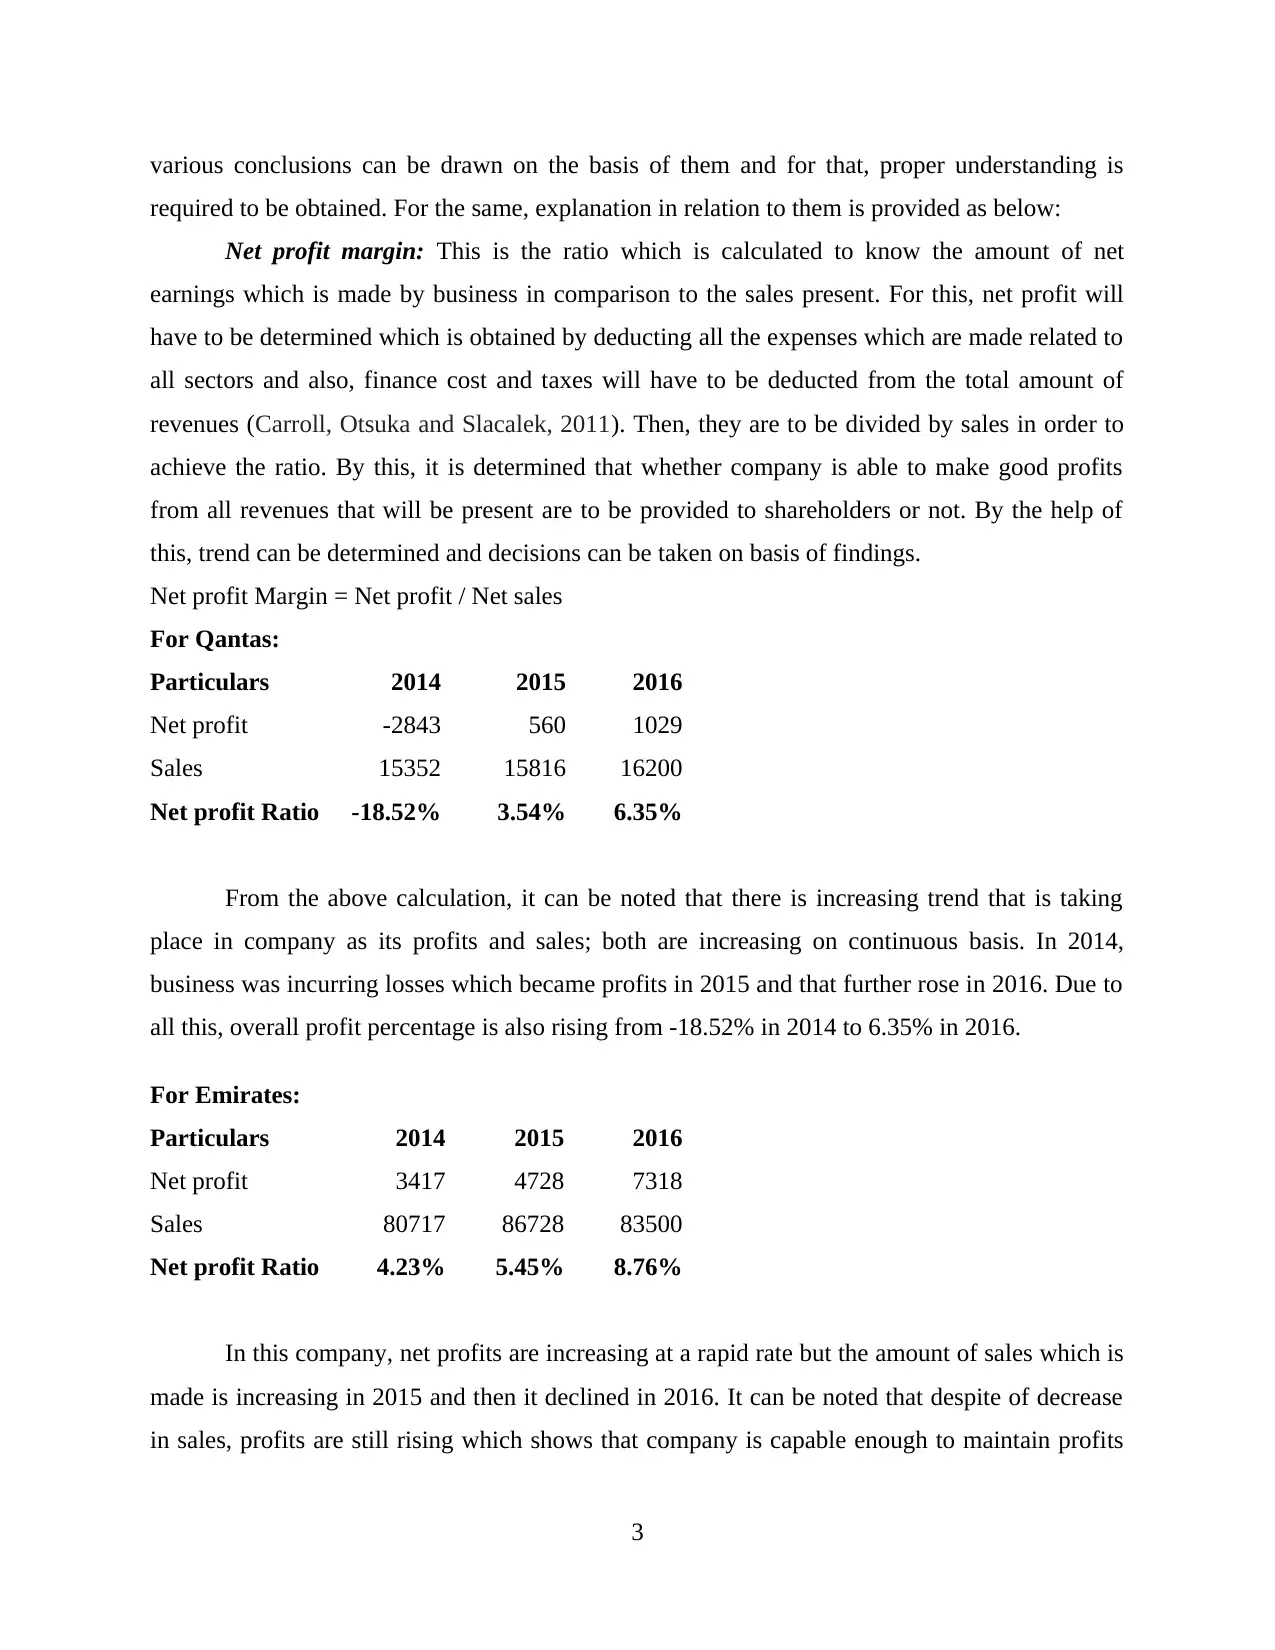
Net profit margin: This is the ratio which is calculated to know the amount of net
earnings which is made by business in comparison to the sales present. For this, net profit will
have to be determined which is obtained by deducting all the expenses which are made related to
all sectors and also, finance cost and taxes will have to be deducted from the total amount of
revenues (Carroll, Otsuka and Slacalek, 2011). Then, they are to be divided by sales in order to
achieve the ratio. By this, it is determined that whether company is able to make good profits
from all revenues that will be present are to be provided to shareholders or not. By the help of
this, trend can be determined and decisions can be taken on basis of findings.
Net profit Margin = Net profit / Net sales
For Qantas:
Particulars 2014 2015 2016
Net profit -2843 560 1029
Sales 15352 15816 16200
Net profit Ratio -18.52% 3.54% 6.35%
From the above calculation, it can be noted that there is increasing trend that is taking
place in company as its profits and sales; both are increasing on continuous basis. In 2014,
business was incurring losses which became profits in 2015 and that further rose in 2016. Due to
all this, overall profit percentage is also rising from -18.52% in 2014 to 6.35% in 2016.
For Emirates:
Particulars 2014 2015 2016
Net profit 3417 4728 7318
Sales 80717 86728 83500
Net profit Ratio 4.23% 5.45% 8.76%
In this company, net profits are increasing at a rapid rate but the amount of sales which is
made is increasing in 2015 and then it declined in 2016. It can be noted that despite of decrease
in sales, profits are still rising which shows that company is capable enough to maintain profits
3
required to be obtained. For the same, explanation in relation to them is provided as below:
Net profit margin: This is the ratio which is calculated to know the amount of net
earnings which is made by business in comparison to the sales present. For this, net profit will
have to be determined which is obtained by deducting all the expenses which are made related to
all sectors and also, finance cost and taxes will have to be deducted from the total amount of
revenues (Carroll, Otsuka and Slacalek, 2011). Then, they are to be divided by sales in order to
achieve the ratio. By this, it is determined that whether company is able to make good profits
from all revenues that will be present are to be provided to shareholders or not. By the help of
this, trend can be determined and decisions can be taken on basis of findings.
Net profit Margin = Net profit / Net sales
For Qantas:
Particulars 2014 2015 2016
Net profit -2843 560 1029
Sales 15352 15816 16200
Net profit Ratio -18.52% 3.54% 6.35%
From the above calculation, it can be noted that there is increasing trend that is taking
place in company as its profits and sales; both are increasing on continuous basis. In 2014,
business was incurring losses which became profits in 2015 and that further rose in 2016. Due to
all this, overall profit percentage is also rising from -18.52% in 2014 to 6.35% in 2016.
For Emirates:
Particulars 2014 2015 2016
Net profit 3417 4728 7318
Sales 80717 86728 83500
Net profit Ratio 4.23% 5.45% 8.76%
In this company, net profits are increasing at a rapid rate but the amount of sales which is
made is increasing in 2015 and then it declined in 2016. It can be noted that despite of decrease
in sales, profits are still rising which shows that company is capable enough to maintain profits
3
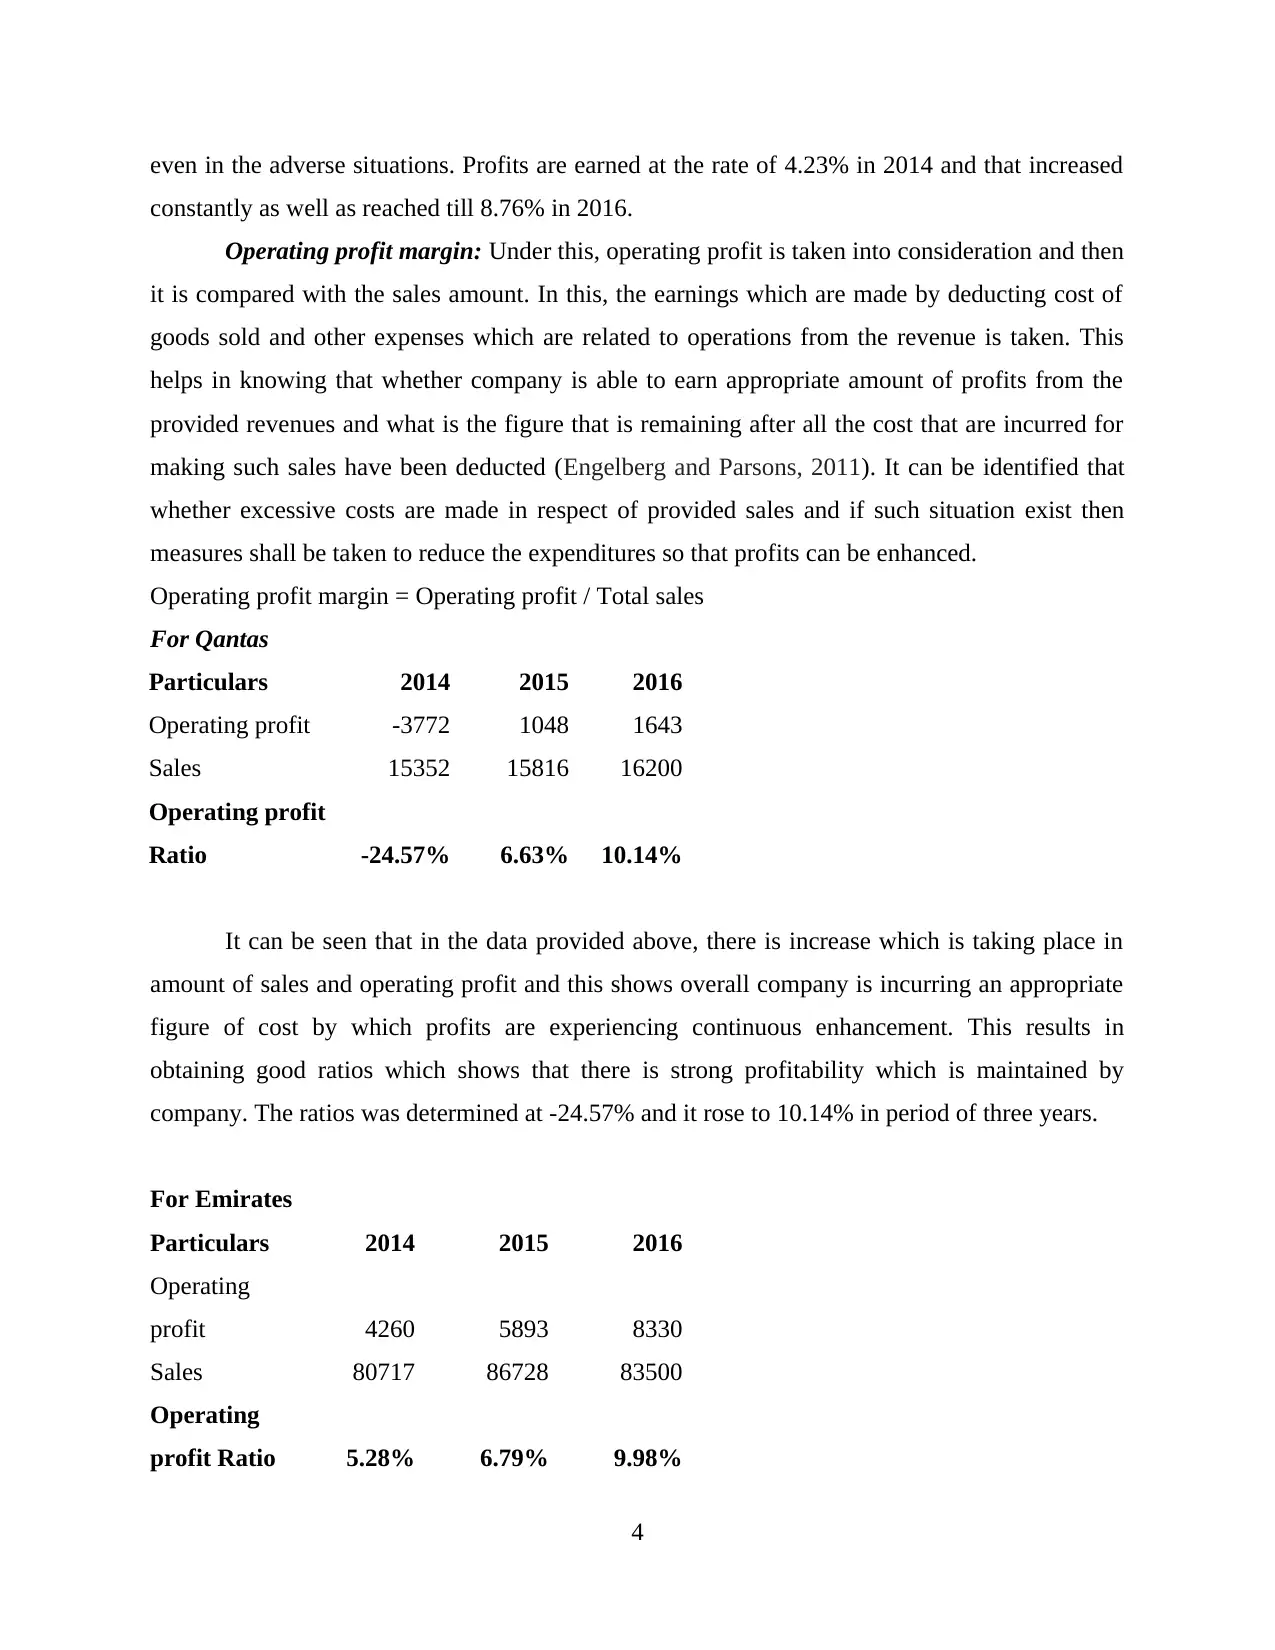
even in the adverse situations. Profits are earned at the rate of 4.23% in 2014 and that increased
constantly as well as reached till 8.76% in 2016.
Operating profit margin: Under this, operating profit is taken into consideration and then
it is compared with the sales amount. In this, the earnings which are made by deducting cost of
goods sold and other expenses which are related to operations from the revenue is taken. This
helps in knowing that whether company is able to earn appropriate amount of profits from the
provided revenues and what is the figure that is remaining after all the cost that are incurred for
making such sales have been deducted (Engelberg and Parsons, 2011). It can be identified that
whether excessive costs are made in respect of provided sales and if such situation exist then
measures shall be taken to reduce the expenditures so that profits can be enhanced.
Operating profit margin = Operating profit / Total sales
For Qantas
Particulars 2014 2015 2016
Operating profit -3772 1048 1643
Sales 15352 15816 16200
Operating profit
Ratio -24.57% 6.63% 10.14%
It can be seen that in the data provided above, there is increase which is taking place in
amount of sales and operating profit and this shows overall company is incurring an appropriate
figure of cost by which profits are experiencing continuous enhancement. This results in
obtaining good ratios which shows that there is strong profitability which is maintained by
company. The ratios was determined at -24.57% and it rose to 10.14% in period of three years.
For Emirates
Particulars 2014 2015 2016
Operating
profit 4260 5893 8330
Sales 80717 86728 83500
Operating
profit Ratio 5.28% 6.79% 9.98%
4
⊘ This is a preview!⊘
Do you want full access?
Subscribe today to unlock all pages.
Trusted by 1+ million students worldwide
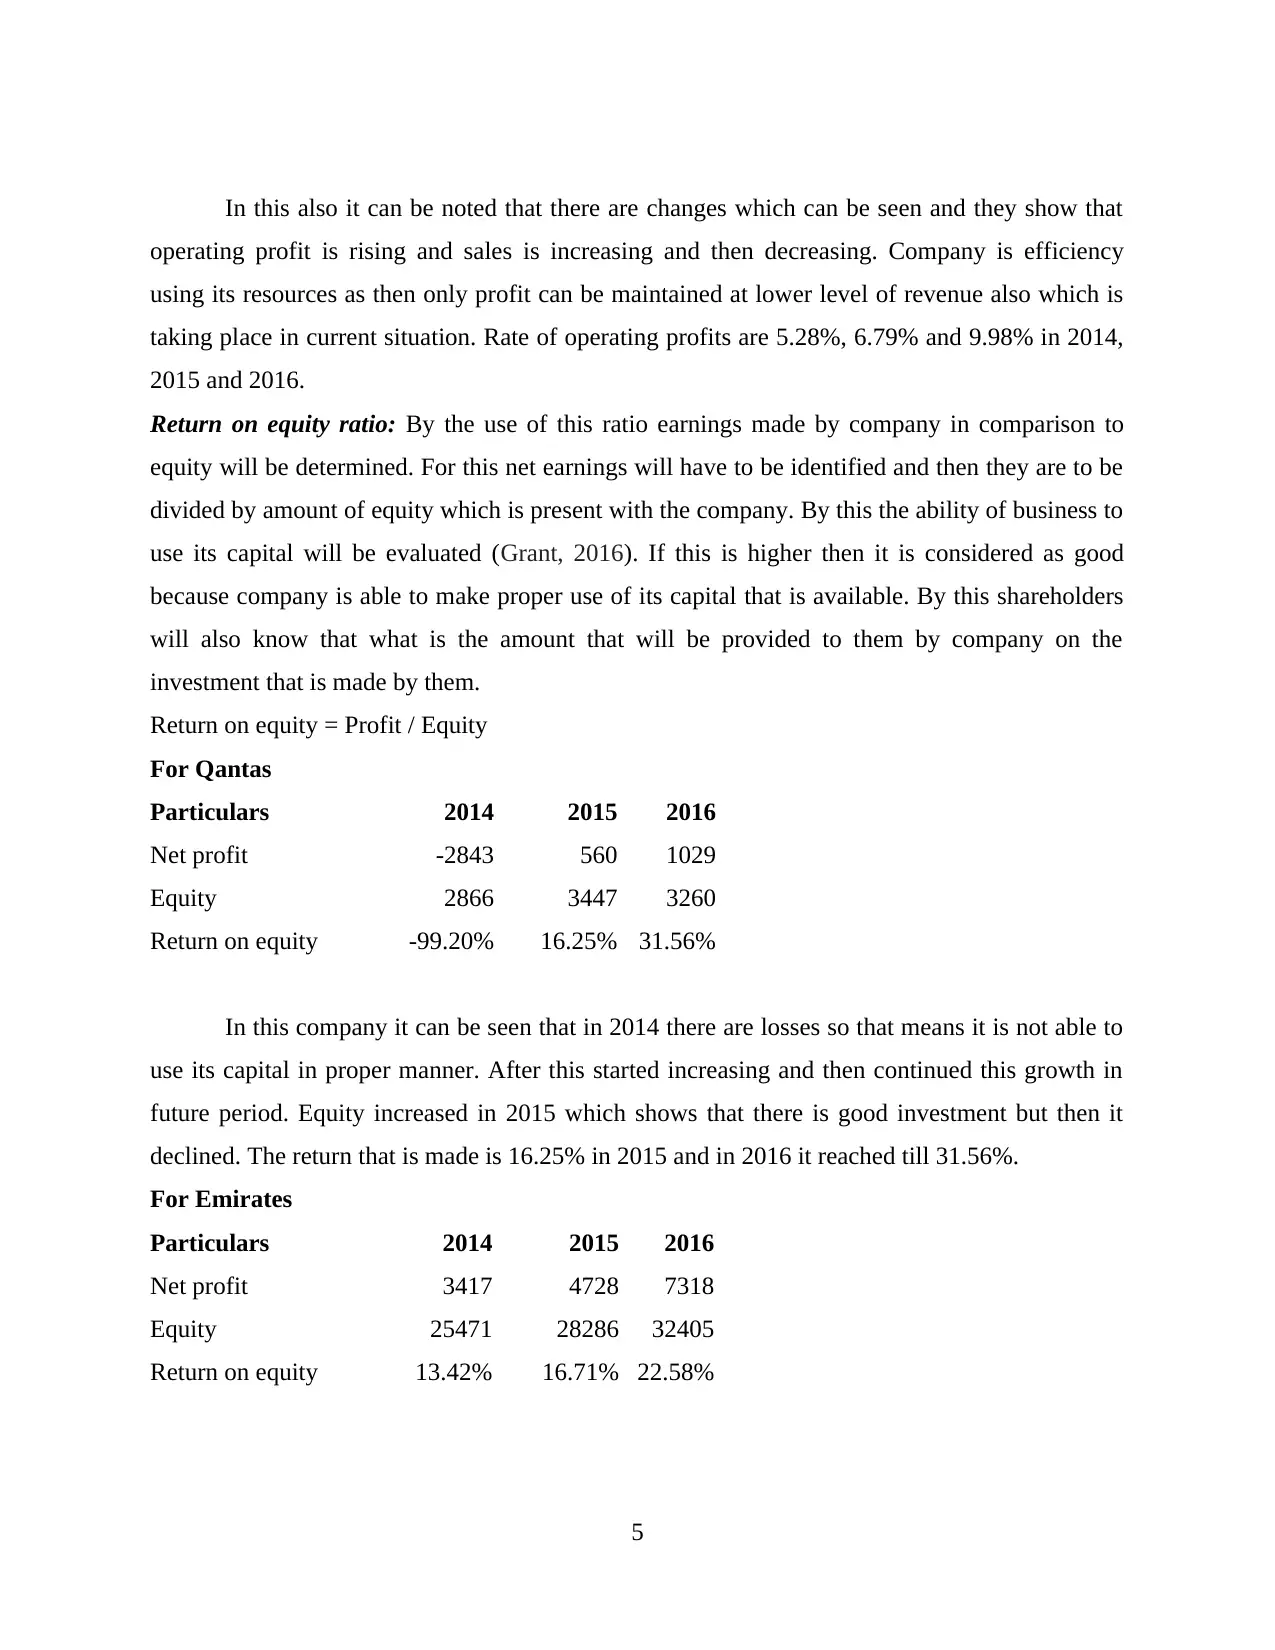
In this also it can be noted that there are changes which can be seen and they show that
operating profit is rising and sales is increasing and then decreasing. Company is efficiency
using its resources as then only profit can be maintained at lower level of revenue also which is
taking place in current situation. Rate of operating profits are 5.28%, 6.79% and 9.98% in 2014,
2015 and 2016.
Return on equity ratio: By the use of this ratio earnings made by company in comparison to
equity will be determined. For this net earnings will have to be identified and then they are to be
divided by amount of equity which is present with the company. By this the ability of business to
use its capital will be evaluated (Grant, 2016). If this is higher then it is considered as good
because company is able to make proper use of its capital that is available. By this shareholders
will also know that what is the amount that will be provided to them by company on the
investment that is made by them.
Return on equity = Profit / Equity
For Qantas
Particulars 2014 2015 2016
Net profit -2843 560 1029
Equity 2866 3447 3260
Return on equity -99.20% 16.25% 31.56%
In this company it can be seen that in 2014 there are losses so that means it is not able to
use its capital in proper manner. After this started increasing and then continued this growth in
future period. Equity increased in 2015 which shows that there is good investment but then it
declined. The return that is made is 16.25% in 2015 and in 2016 it reached till 31.56%.
For Emirates
Particulars 2014 2015 2016
Net profit 3417 4728 7318
Equity 25471 28286 32405
Return on equity 13.42% 16.71% 22.58%
5
Paraphrase This Document
Need a fresh take? Get an instant paraphrase of this document with our AI Paraphraser
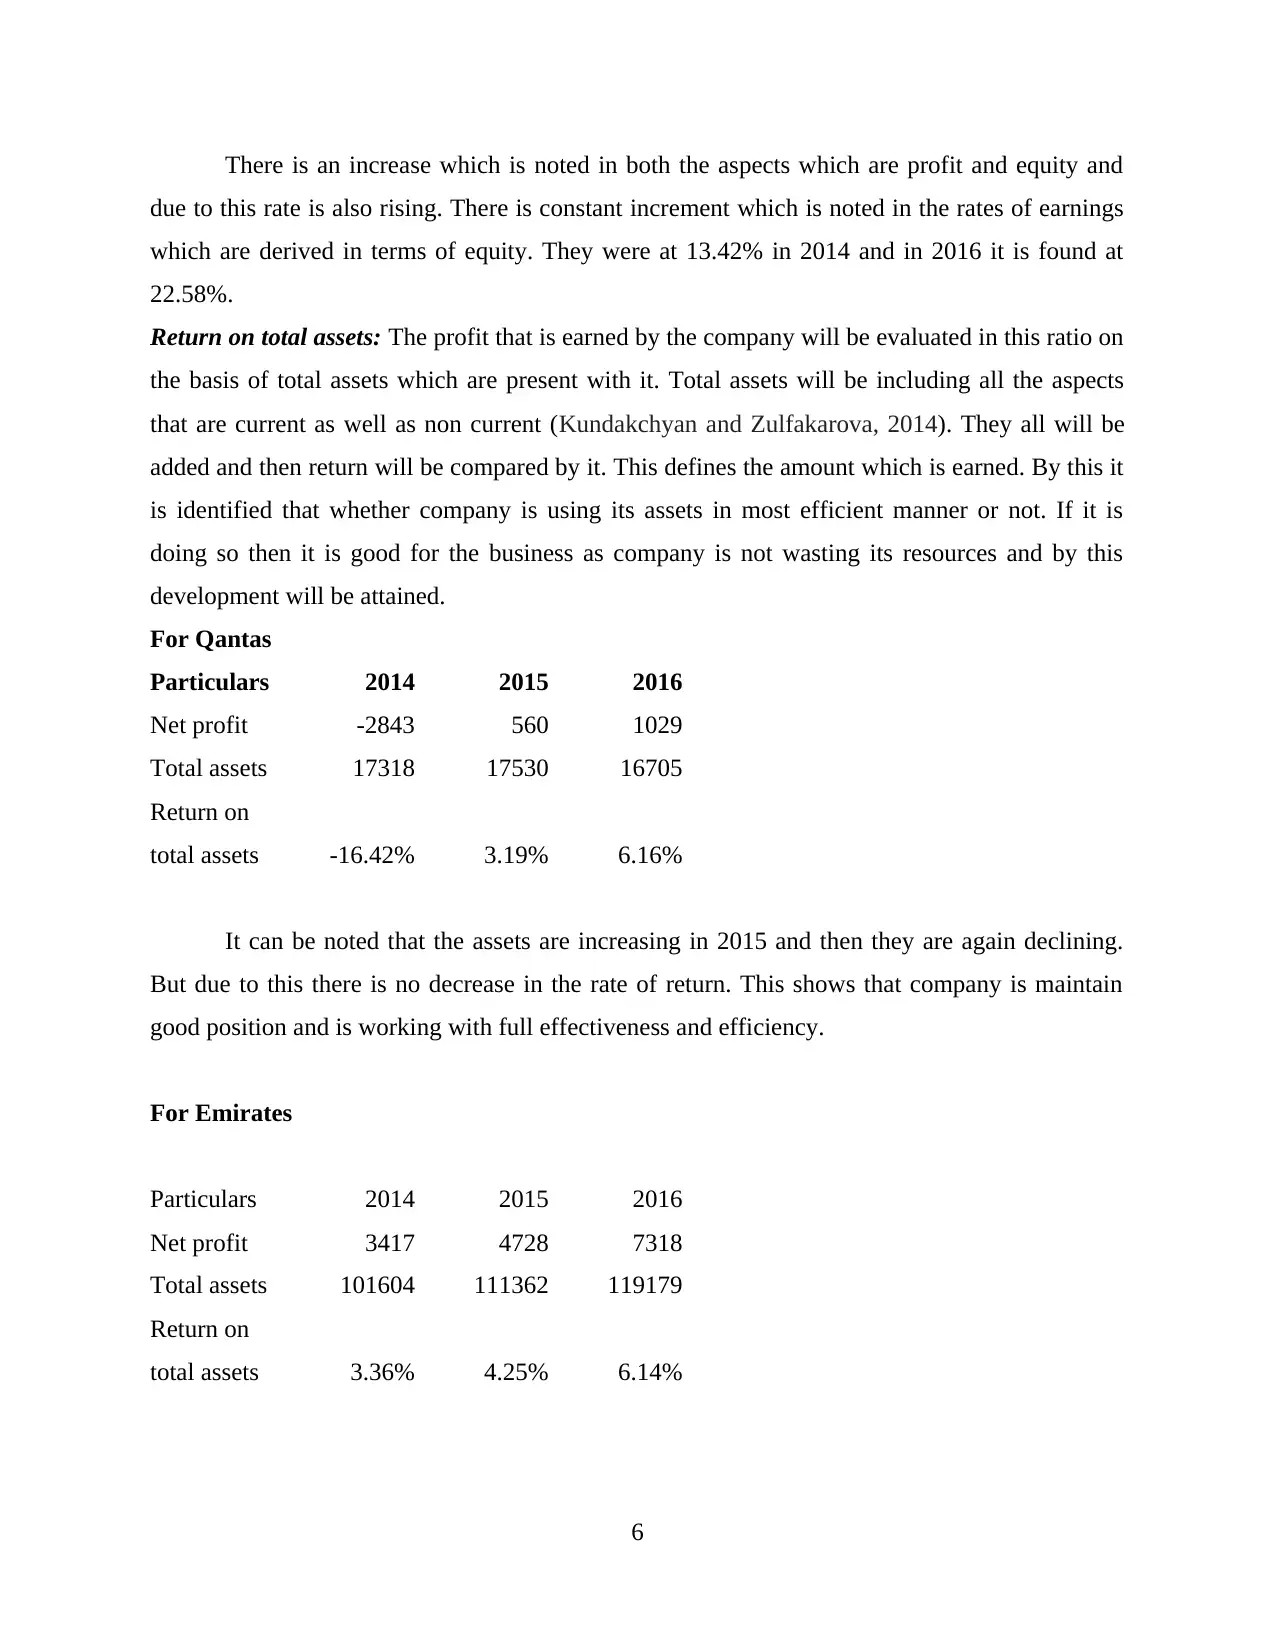
There is an increase which is noted in both the aspects which are profit and equity and
due to this rate is also rising. There is constant increment which is noted in the rates of earnings
which are derived in terms of equity. They were at 13.42% in 2014 and in 2016 it is found at
22.58%.
Return on total assets: The profit that is earned by the company will be evaluated in this ratio on
the basis of total assets which are present with it. Total assets will be including all the aspects
that are current as well as non current (Kundakchyan and Zulfakarova, 2014). They all will be
added and then return will be compared by it. This defines the amount which is earned. By this it
is identified that whether company is using its assets in most efficient manner or not. If it is
doing so then it is good for the business as company is not wasting its resources and by this
development will be attained.
For Qantas
Particulars 2014 2015 2016
Net profit -2843 560 1029
Total assets 17318 17530 16705
Return on
total assets -16.42% 3.19% 6.16%
It can be noted that the assets are increasing in 2015 and then they are again declining.
But due to this there is no decrease in the rate of return. This shows that company is maintain
good position and is working with full effectiveness and efficiency.
For Emirates
Particulars 2014 2015 2016
Net profit 3417 4728 7318
Total assets 101604 111362 119179
Return on
total assets 3.36% 4.25% 6.14%
6
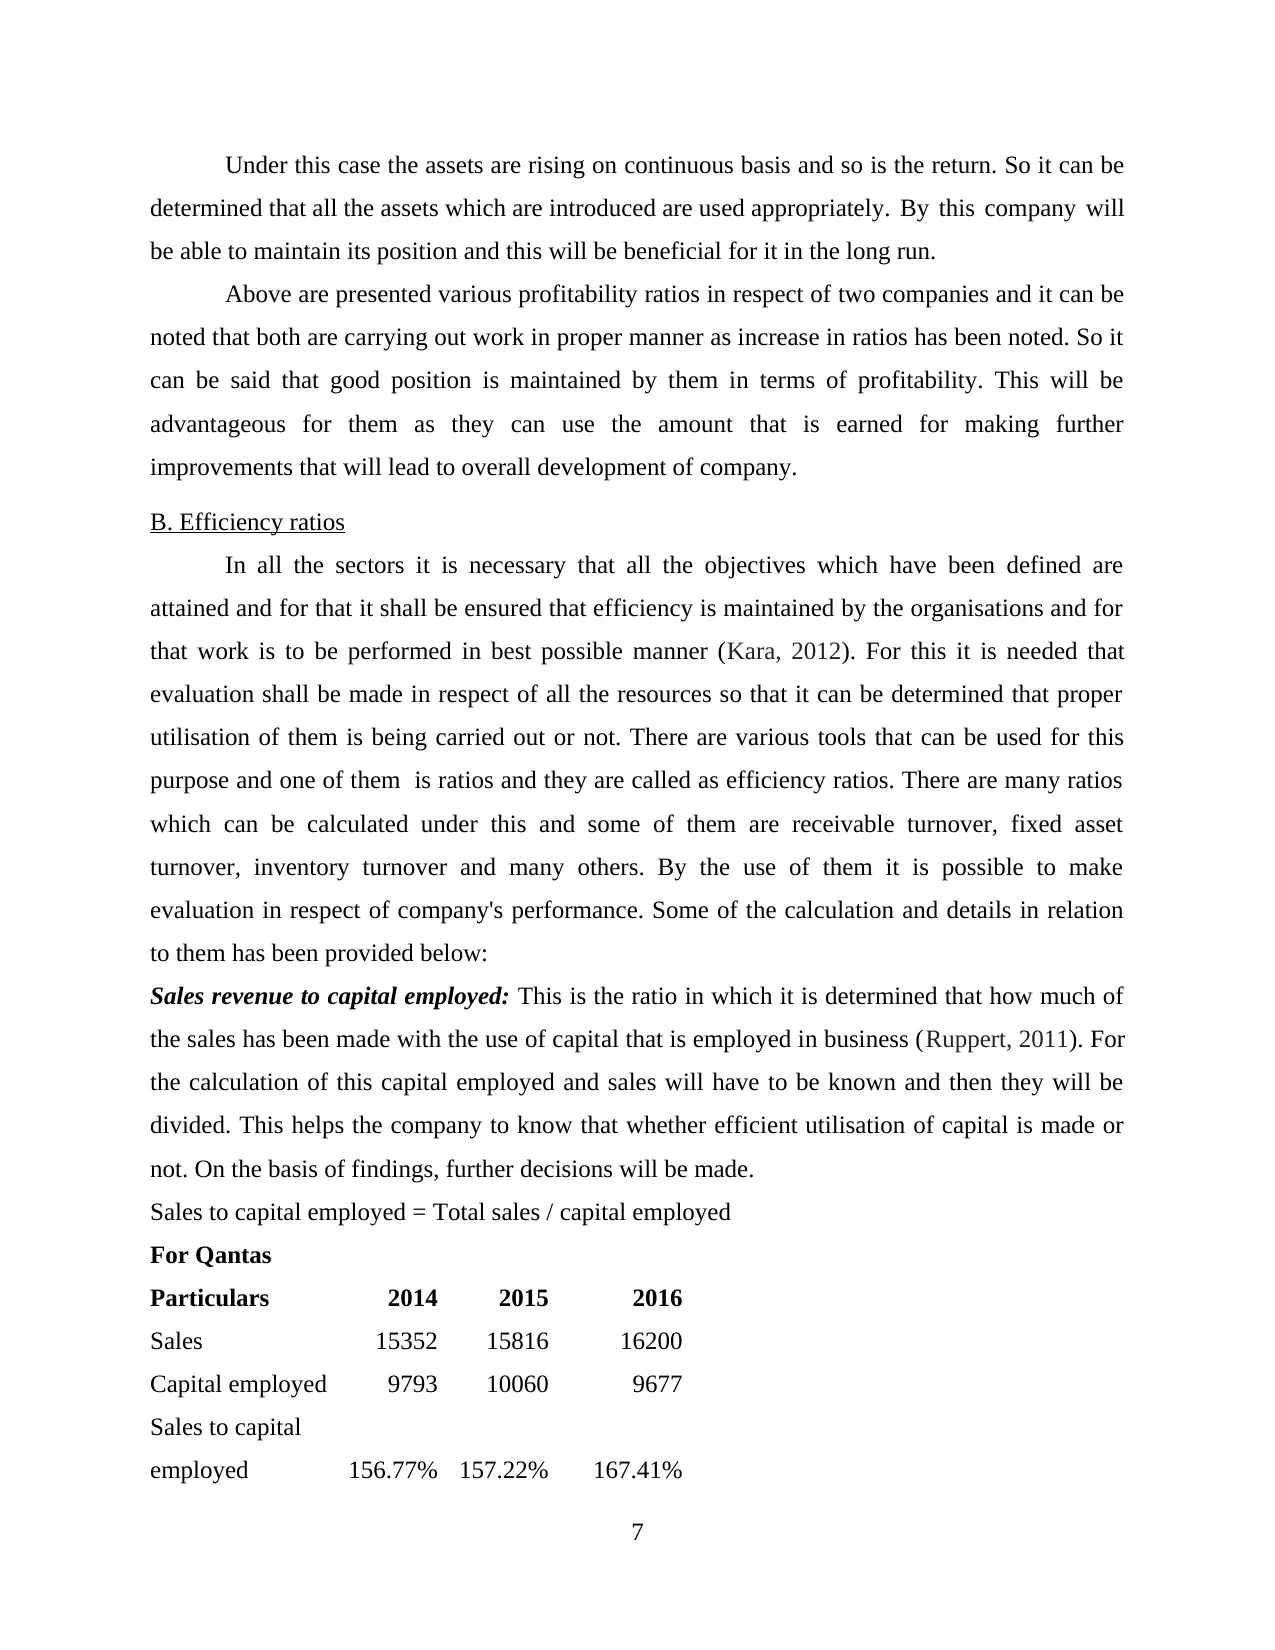
Under this case the assets are rising on continuous basis and so is the return. So it can be
determined that all the assets which are introduced are used appropriately. By this company will
be able to maintain its position and this will be beneficial for it in the long run.
Above are presented various profitability ratios in respect of two companies and it can be
noted that both are carrying out work in proper manner as increase in ratios has been noted. So it
can be said that good position is maintained by them in terms of profitability. This will be
advantageous for them as they can use the amount that is earned for making further
improvements that will lead to overall development of company.
B. Efficiency ratios
In all the sectors it is necessary that all the objectives which have been defined are
attained and for that it shall be ensured that efficiency is maintained by the organisations and for
that work is to be performed in best possible manner (Kara, 2012). For this it is needed that
evaluation shall be made in respect of all the resources so that it can be determined that proper
utilisation of them is being carried out or not. There are various tools that can be used for this
purpose and one of them is ratios and they are called as efficiency ratios. There are many ratios
which can be calculated under this and some of them are receivable turnover, fixed asset
turnover, inventory turnover and many others. By the use of them it is possible to make
evaluation in respect of company's performance. Some of the calculation and details in relation
to them has been provided below:
Sales revenue to capital employed: This is the ratio in which it is determined that how much of
the sales has been made with the use of capital that is employed in business (Ruppert, 2011). For
the calculation of this capital employed and sales will have to be known and then they will be
divided. This helps the company to know that whether efficient utilisation of capital is made or
not. On the basis of findings, further decisions will be made.
Sales to capital employed = Total sales / capital employed
For Qantas
Particulars 2014 2015 2016
Sales 15352 15816 16200
Capital employed 9793 10060 9677
Sales to capital
employed 156.77% 157.22% 167.41%
7
⊘ This is a preview!⊘
Do you want full access?
Subscribe today to unlock all pages.
Trusted by 1+ million students worldwide
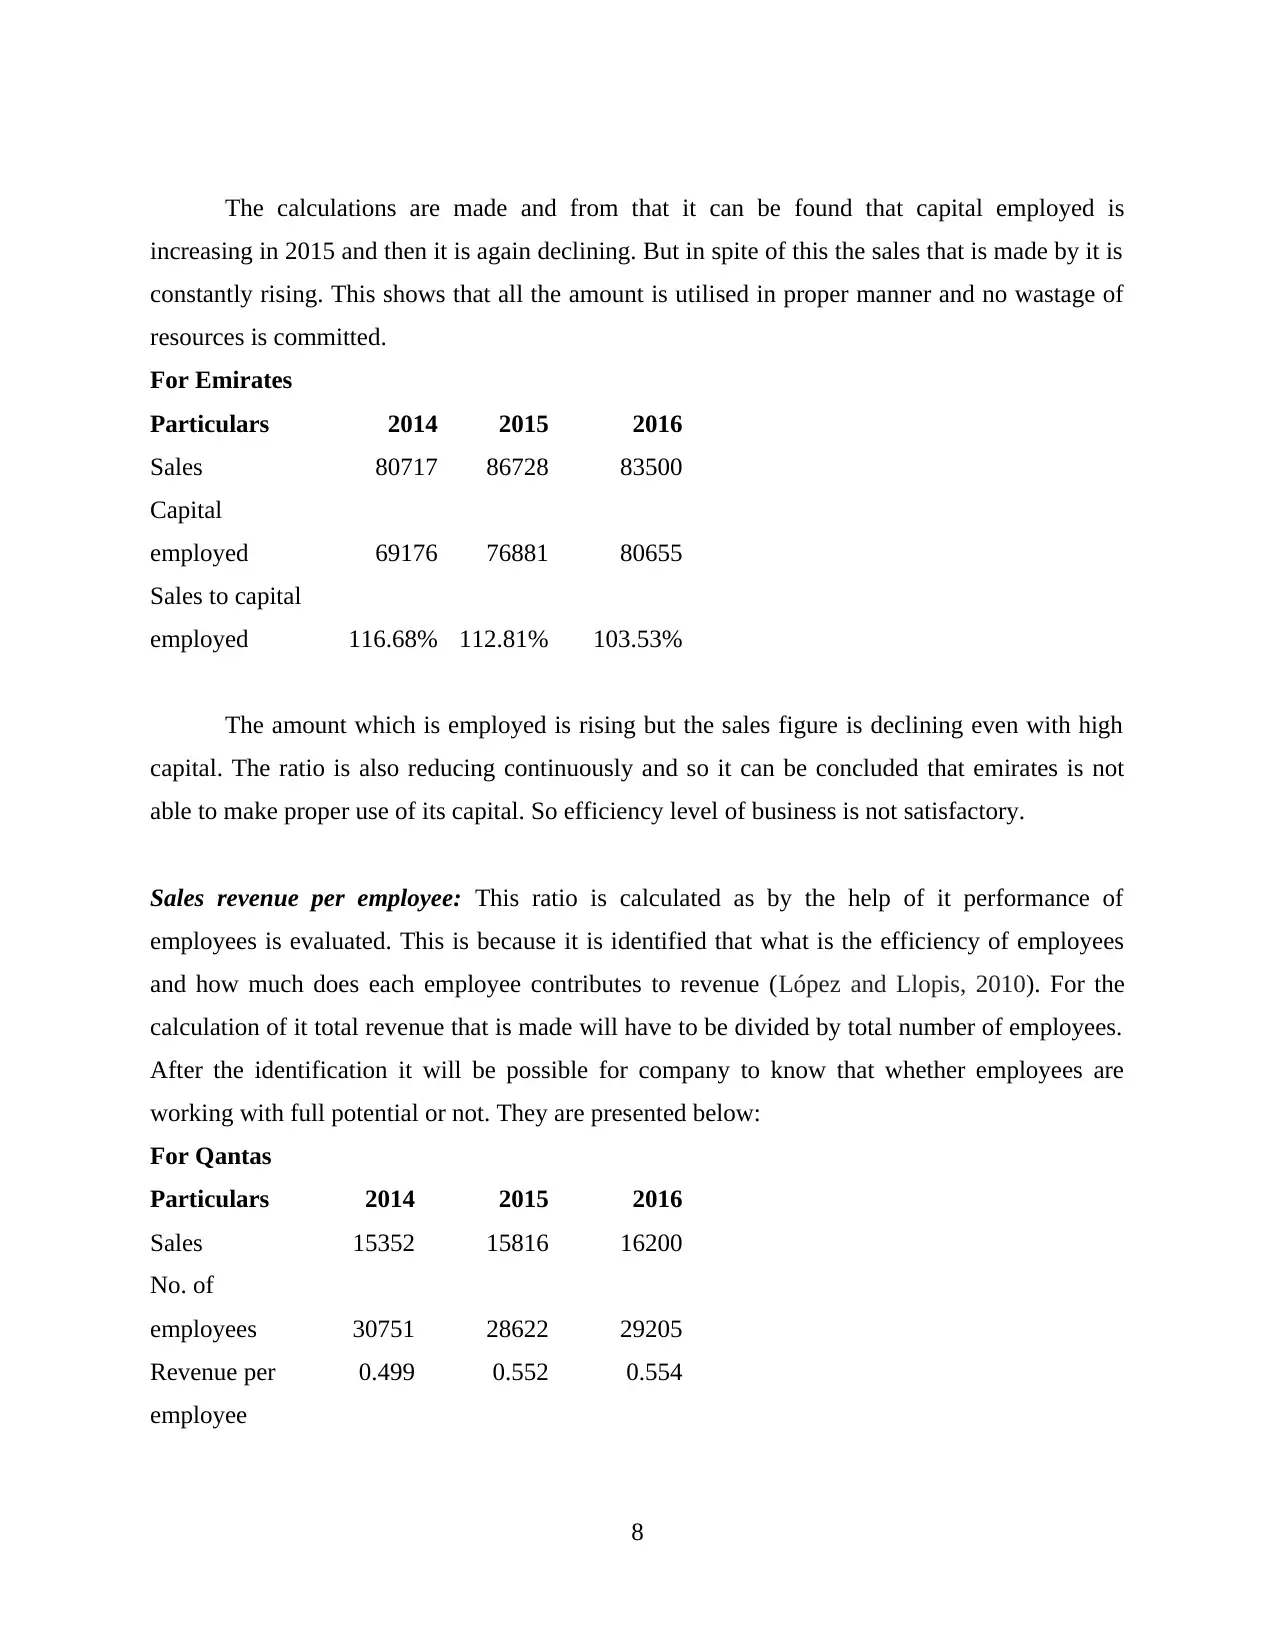
The calculations are made and from that it can be found that capital employed is
increasing in 2015 and then it is again declining. But in spite of this the sales that is made by it is
constantly rising. This shows that all the amount is utilised in proper manner and no wastage of
resources is committed.
For Emirates
Particulars 2014 2015 2016
Sales 80717 86728 83500
Capital
employed 69176 76881 80655
Sales to capital
employed 116.68% 112.81% 103.53%
The amount which is employed is rising but the sales figure is declining even with high
capital. The ratio is also reducing continuously and so it can be concluded that emirates is not
able to make proper use of its capital. So efficiency level of business is not satisfactory.
Sales revenue per employee: This ratio is calculated as by the help of it performance of
employees is evaluated. This is because it is identified that what is the efficiency of employees
and how much does each employee contributes to revenue (López and Llopis, 2010). For the
calculation of it total revenue that is made will have to be divided by total number of employees.
After the identification it will be possible for company to know that whether employees are
working with full potential or not. They are presented below:
For Qantas
Particulars 2014 2015 2016
Sales 15352 15816 16200
No. of
employees 30751 28622 29205
Revenue per
employee
0.499 0.552 0.554
8
Paraphrase This Document
Need a fresh take? Get an instant paraphrase of this document with our AI Paraphraser
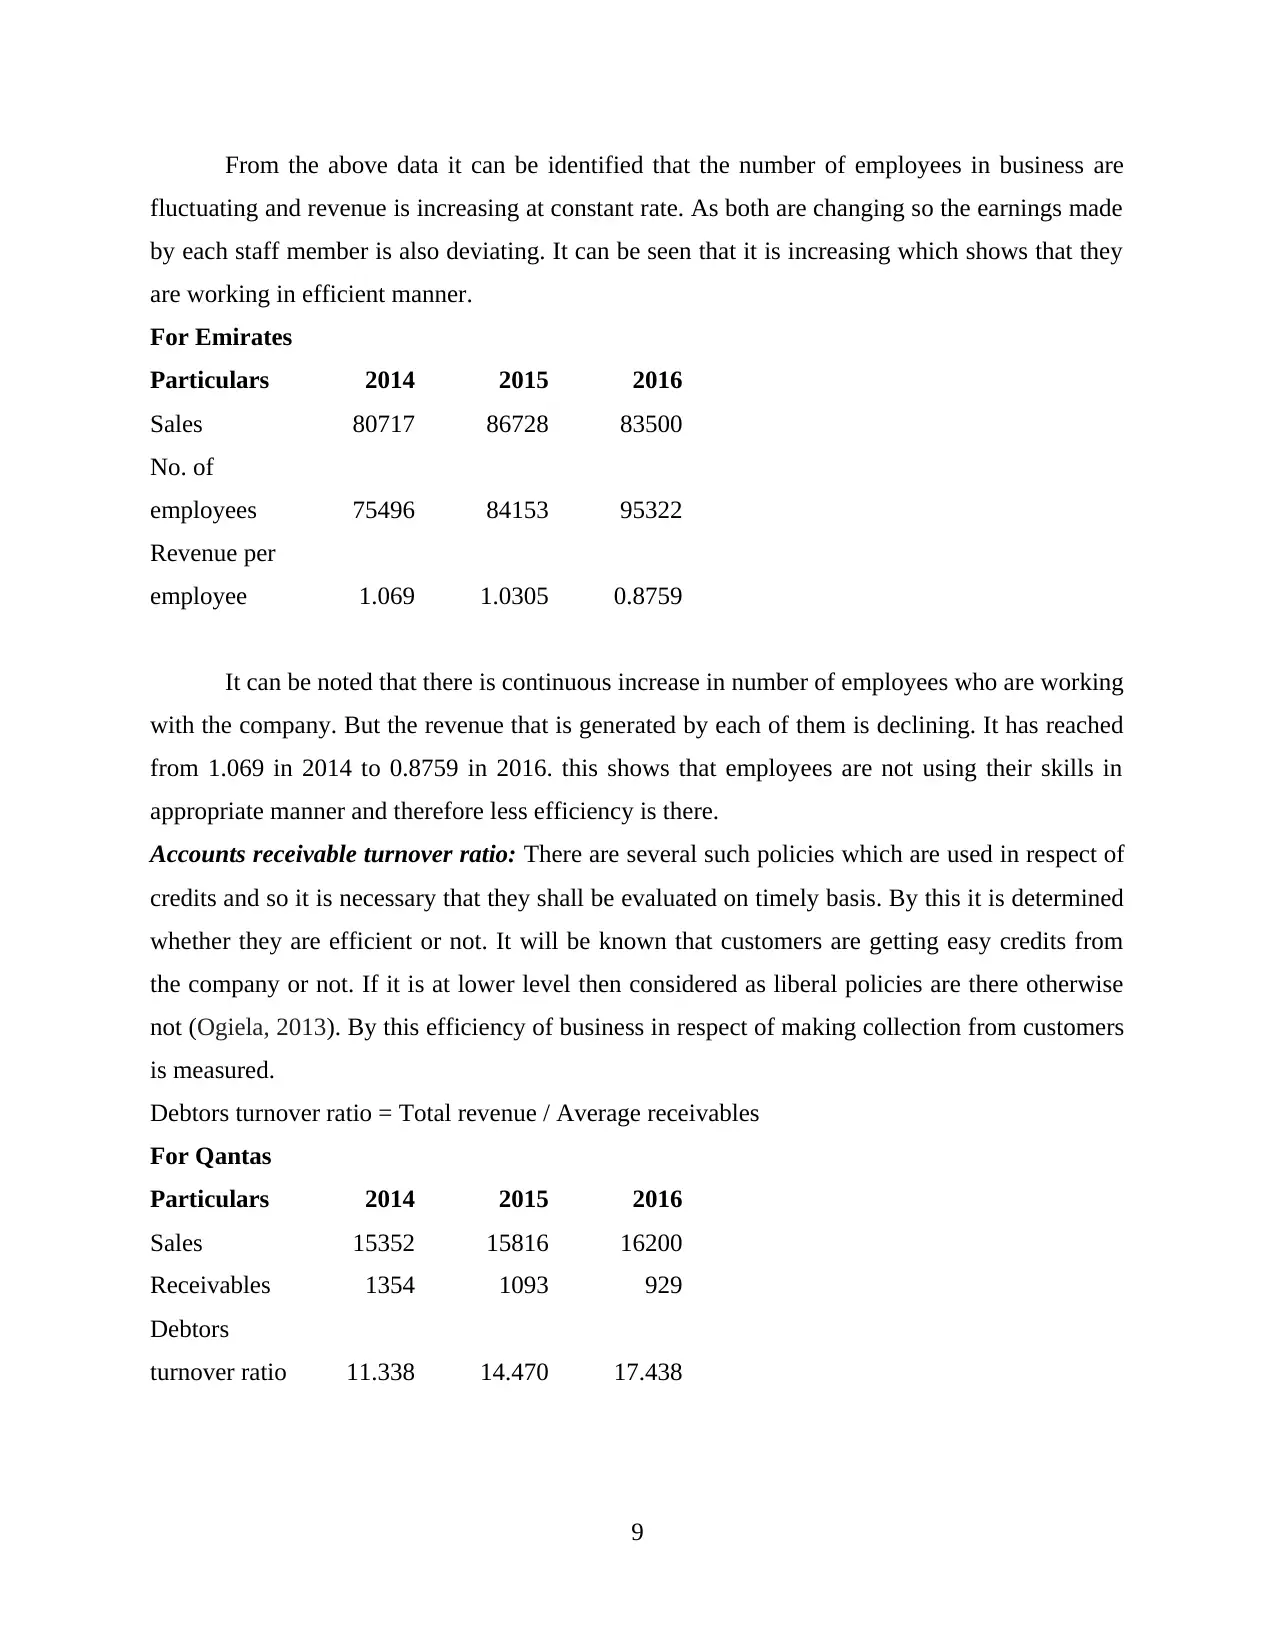
From the above data it can be identified that the number of employees in business are
fluctuating and revenue is increasing at constant rate. As both are changing so the earnings made
by each staff member is also deviating. It can be seen that it is increasing which shows that they
are working in efficient manner.
For Emirates
Particulars 2014 2015 2016
Sales 80717 86728 83500
No. of
employees 75496 84153 95322
Revenue per
employee 1.069 1.0305 0.8759
It can be noted that there is continuous increase in number of employees who are working
with the company. But the revenue that is generated by each of them is declining. It has reached
from 1.069 in 2014 to 0.8759 in 2016. this shows that employees are not using their skills in
appropriate manner and therefore less efficiency is there.
Accounts receivable turnover ratio: There are several such policies which are used in respect of
credits and so it is necessary that they shall be evaluated on timely basis. By this it is determined
whether they are efficient or not. It will be known that customers are getting easy credits from
the company or not. If it is at lower level then considered as liberal policies are there otherwise
not (Ogiela, 2013). By this efficiency of business in respect of making collection from customers
is measured.
Debtors turnover ratio = Total revenue / Average receivables
For Qantas
Particulars 2014 2015 2016
Sales 15352 15816 16200
Receivables 1354 1093 929
Debtors
turnover ratio 11.338 14.470 17.438
9
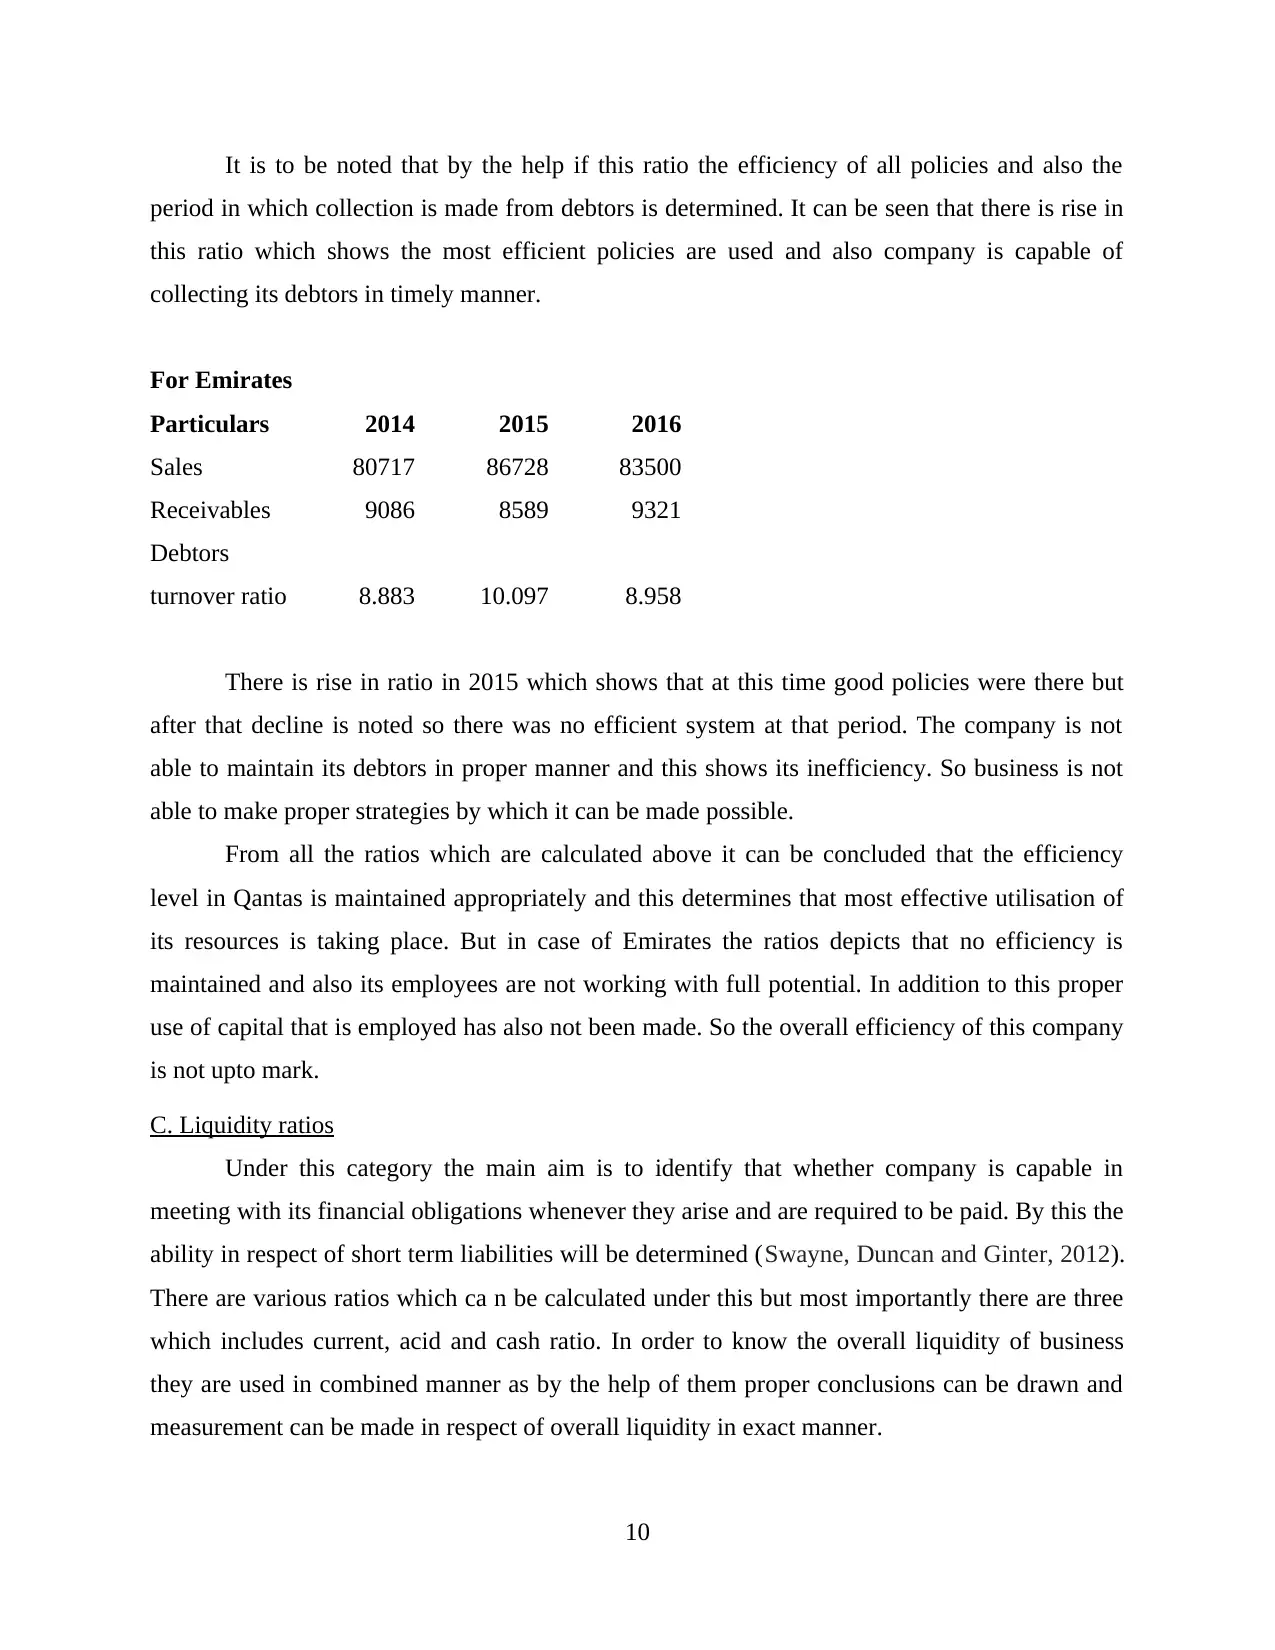
It is to be noted that by the help if this ratio the efficiency of all policies and also the
period in which collection is made from debtors is determined. It can be seen that there is rise in
this ratio which shows the most efficient policies are used and also company is capable of
collecting its debtors in timely manner.
For Emirates
Particulars 2014 2015 2016
Sales 80717 86728 83500
Receivables 9086 8589 9321
Debtors
turnover ratio 8.883 10.097 8.958
There is rise in ratio in 2015 which shows that at this time good policies were there but
after that decline is noted so there was no efficient system at that period. The company is not
able to maintain its debtors in proper manner and this shows its inefficiency. So business is not
able to make proper strategies by which it can be made possible.
From all the ratios which are calculated above it can be concluded that the efficiency
level in Qantas is maintained appropriately and this determines that most effective utilisation of
its resources is taking place. But in case of Emirates the ratios depicts that no efficiency is
maintained and also its employees are not working with full potential. In addition to this proper
use of capital that is employed has also not been made. So the overall efficiency of this company
is not upto mark.
C. Liquidity ratios
Under this category the main aim is to identify that whether company is capable in
meeting with its financial obligations whenever they arise and are required to be paid. By this the
ability in respect of short term liabilities will be determined (Swayne, Duncan and Ginter, 2012).
There are various ratios which ca n be calculated under this but most importantly there are three
which includes current, acid and cash ratio. In order to know the overall liquidity of business
they are used in combined manner as by the help of them proper conclusions can be drawn and
measurement can be made in respect of overall liquidity in exact manner.
10
⊘ This is a preview!⊘
Do you want full access?
Subscribe today to unlock all pages.
Trusted by 1+ million students worldwide
1 out of 38
Related Documents


Your All-in-One AI-Powered Toolkit for Academic Success.
+13062052269
info@desklib.com
Available 24*7 on WhatsApp / Email
![[object Object]](/_next/static/media/star-bottom.7253800d.svg)
Unlock your academic potential
Copyright © 2020–2026 A2Z Services. All Rights Reserved. Developed and managed by ZUCOL.