Equities and Investment Analysis Report: Qantas Airways Analysis
VerifiedAdded on 2019/11/26
|10
|1348
|461
Report
AI Summary
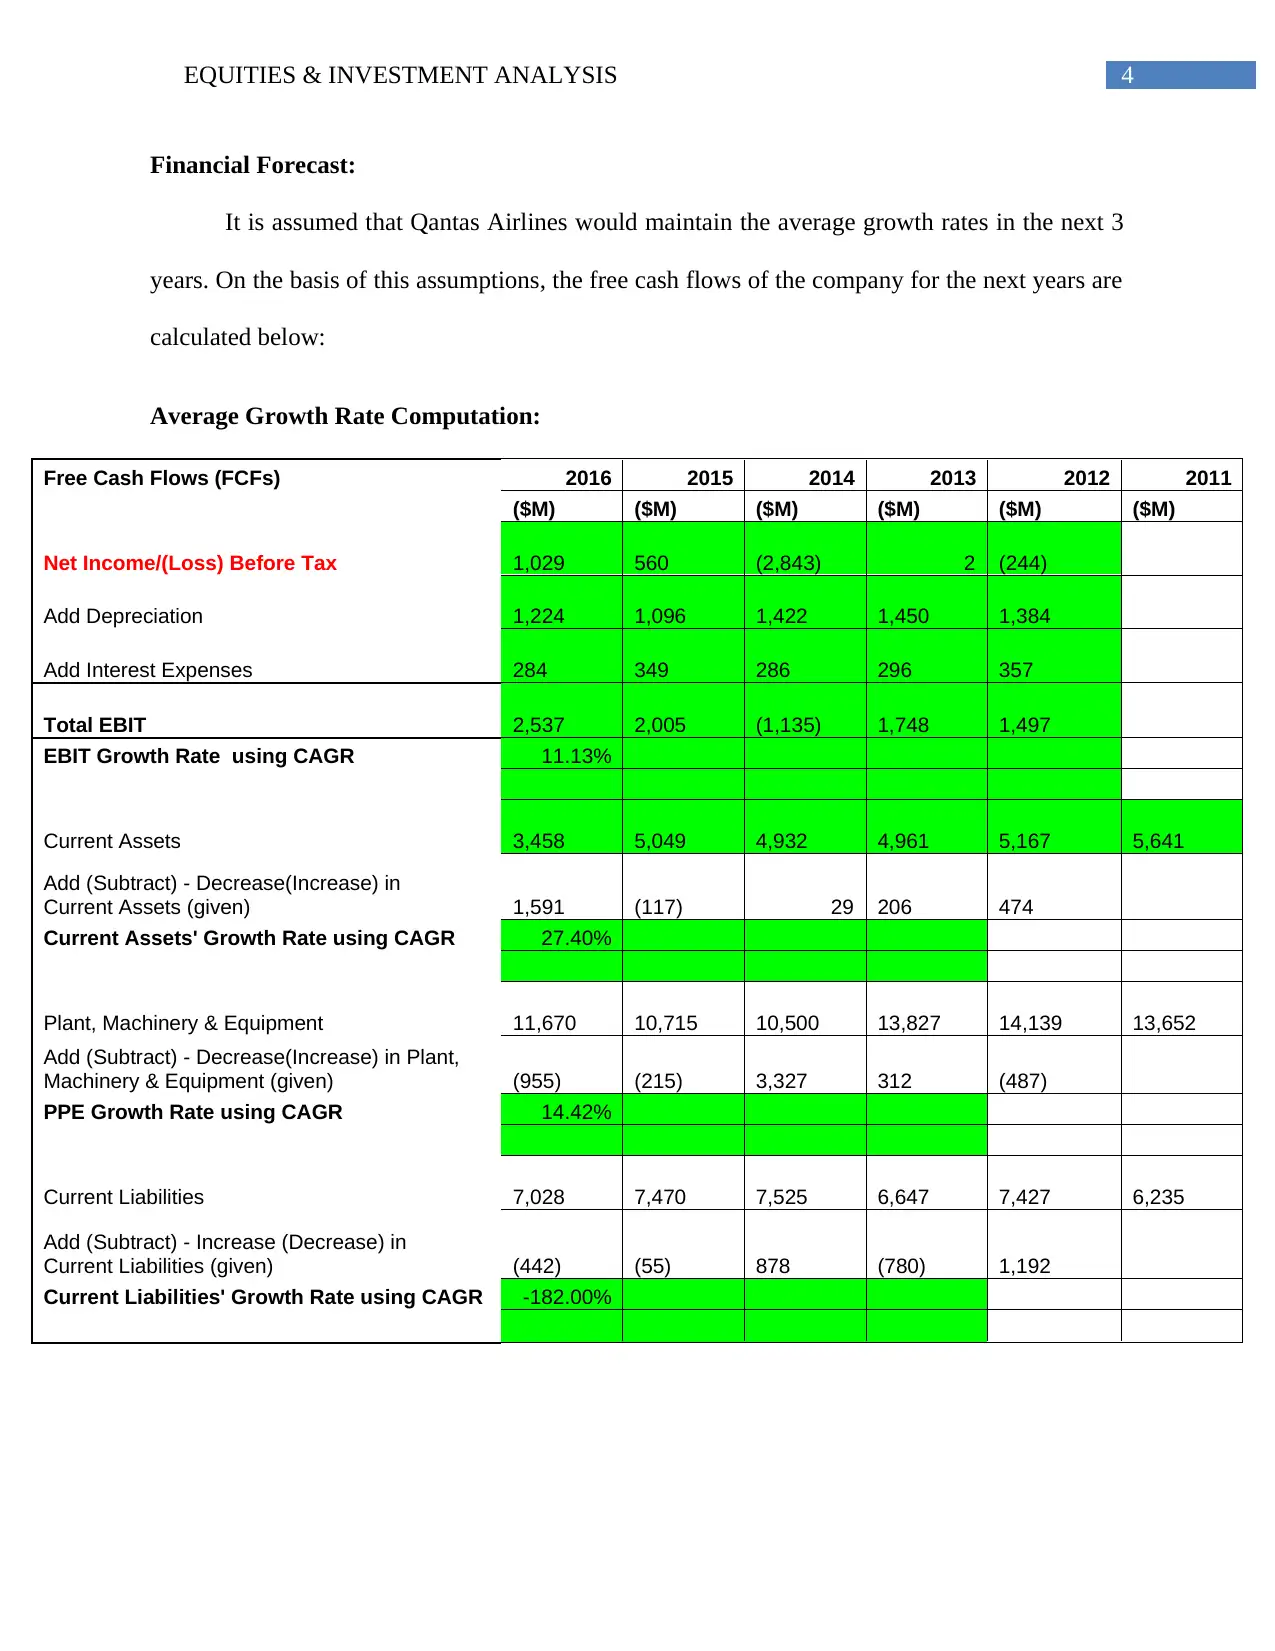
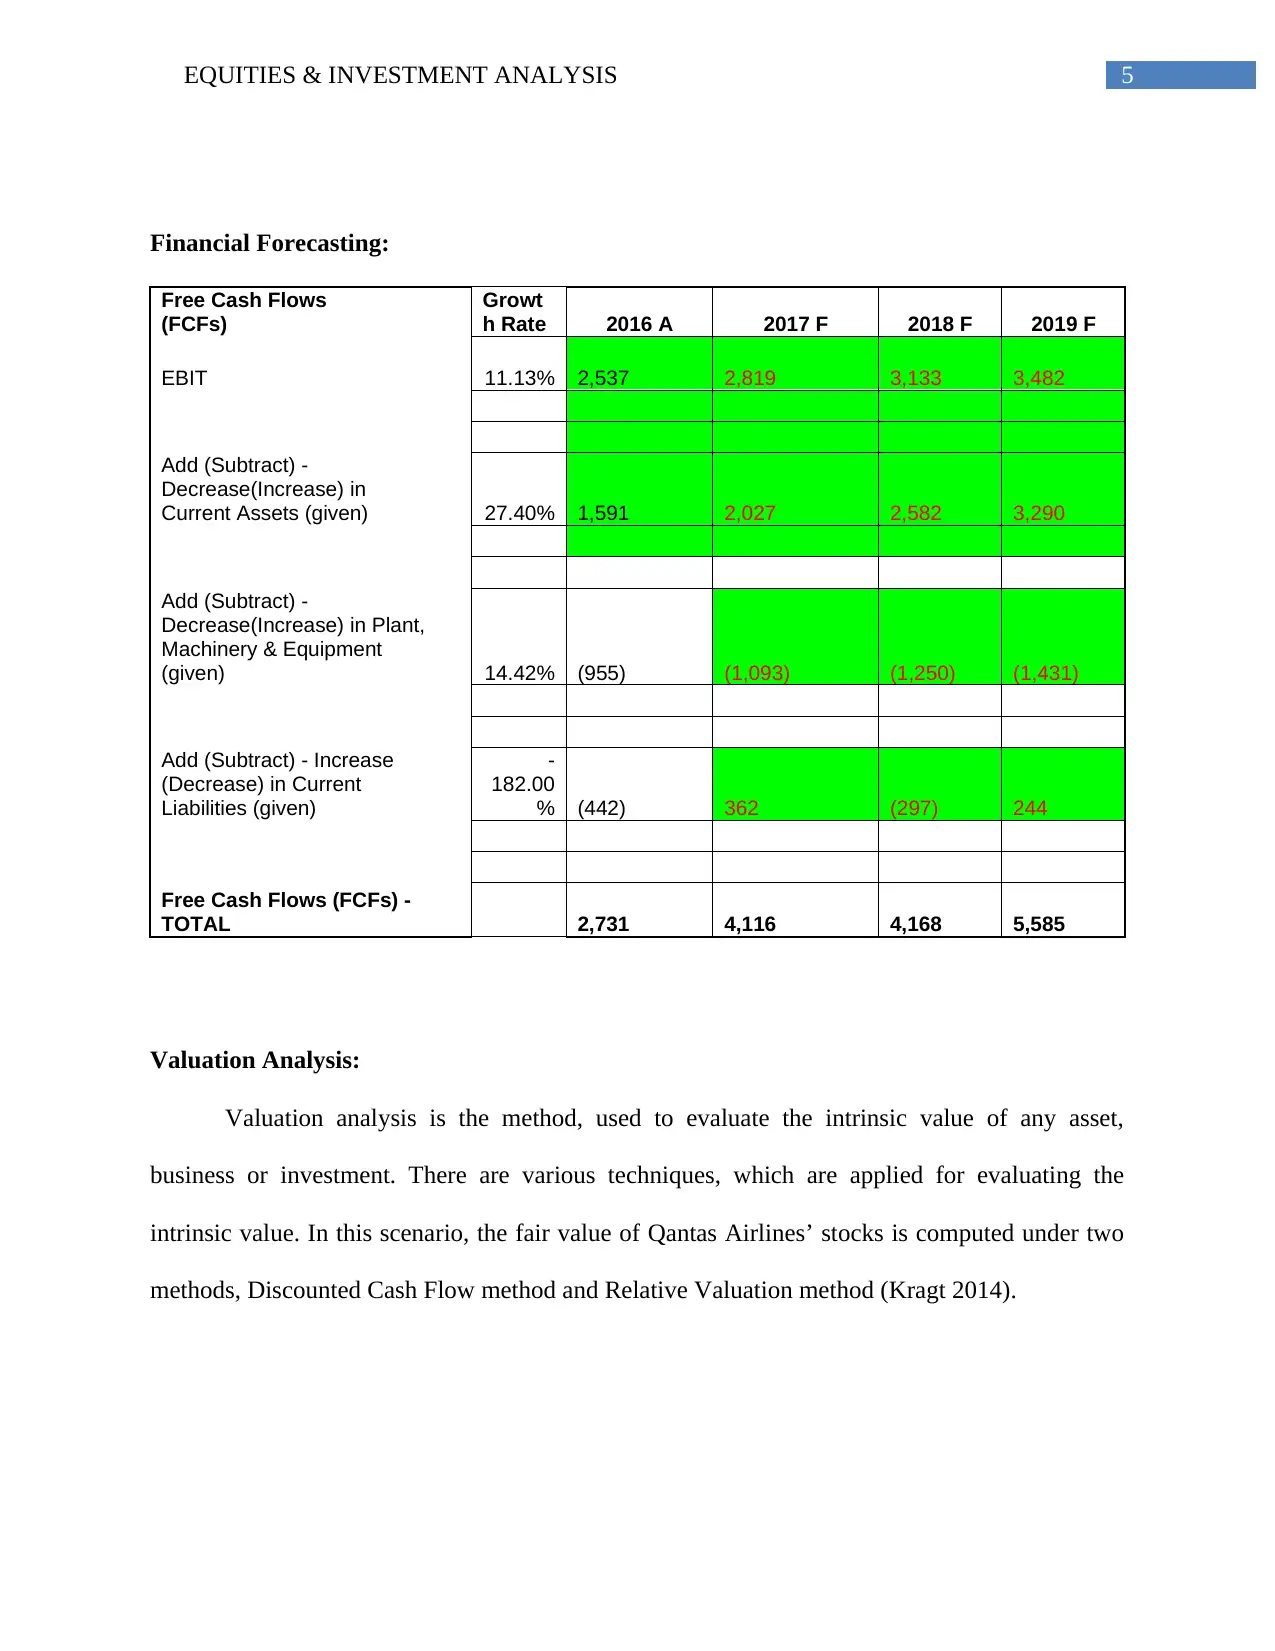
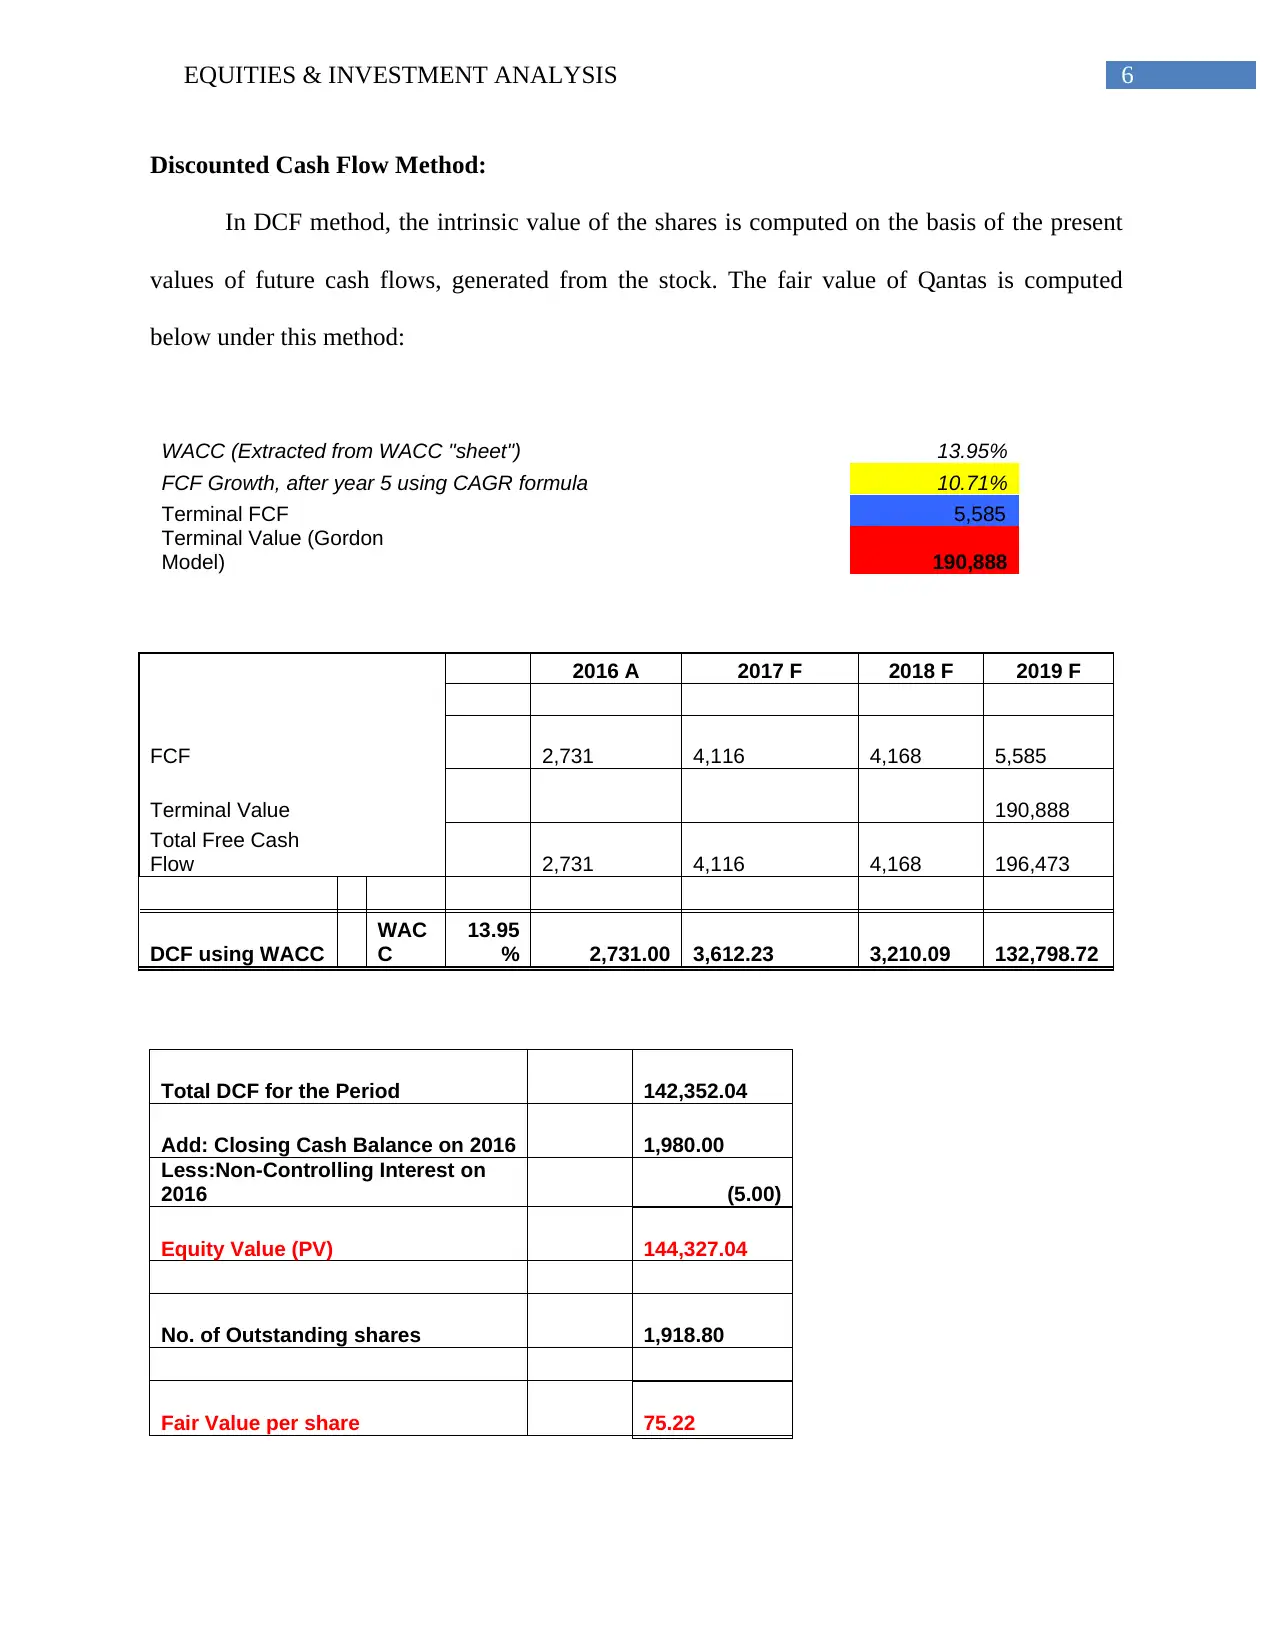
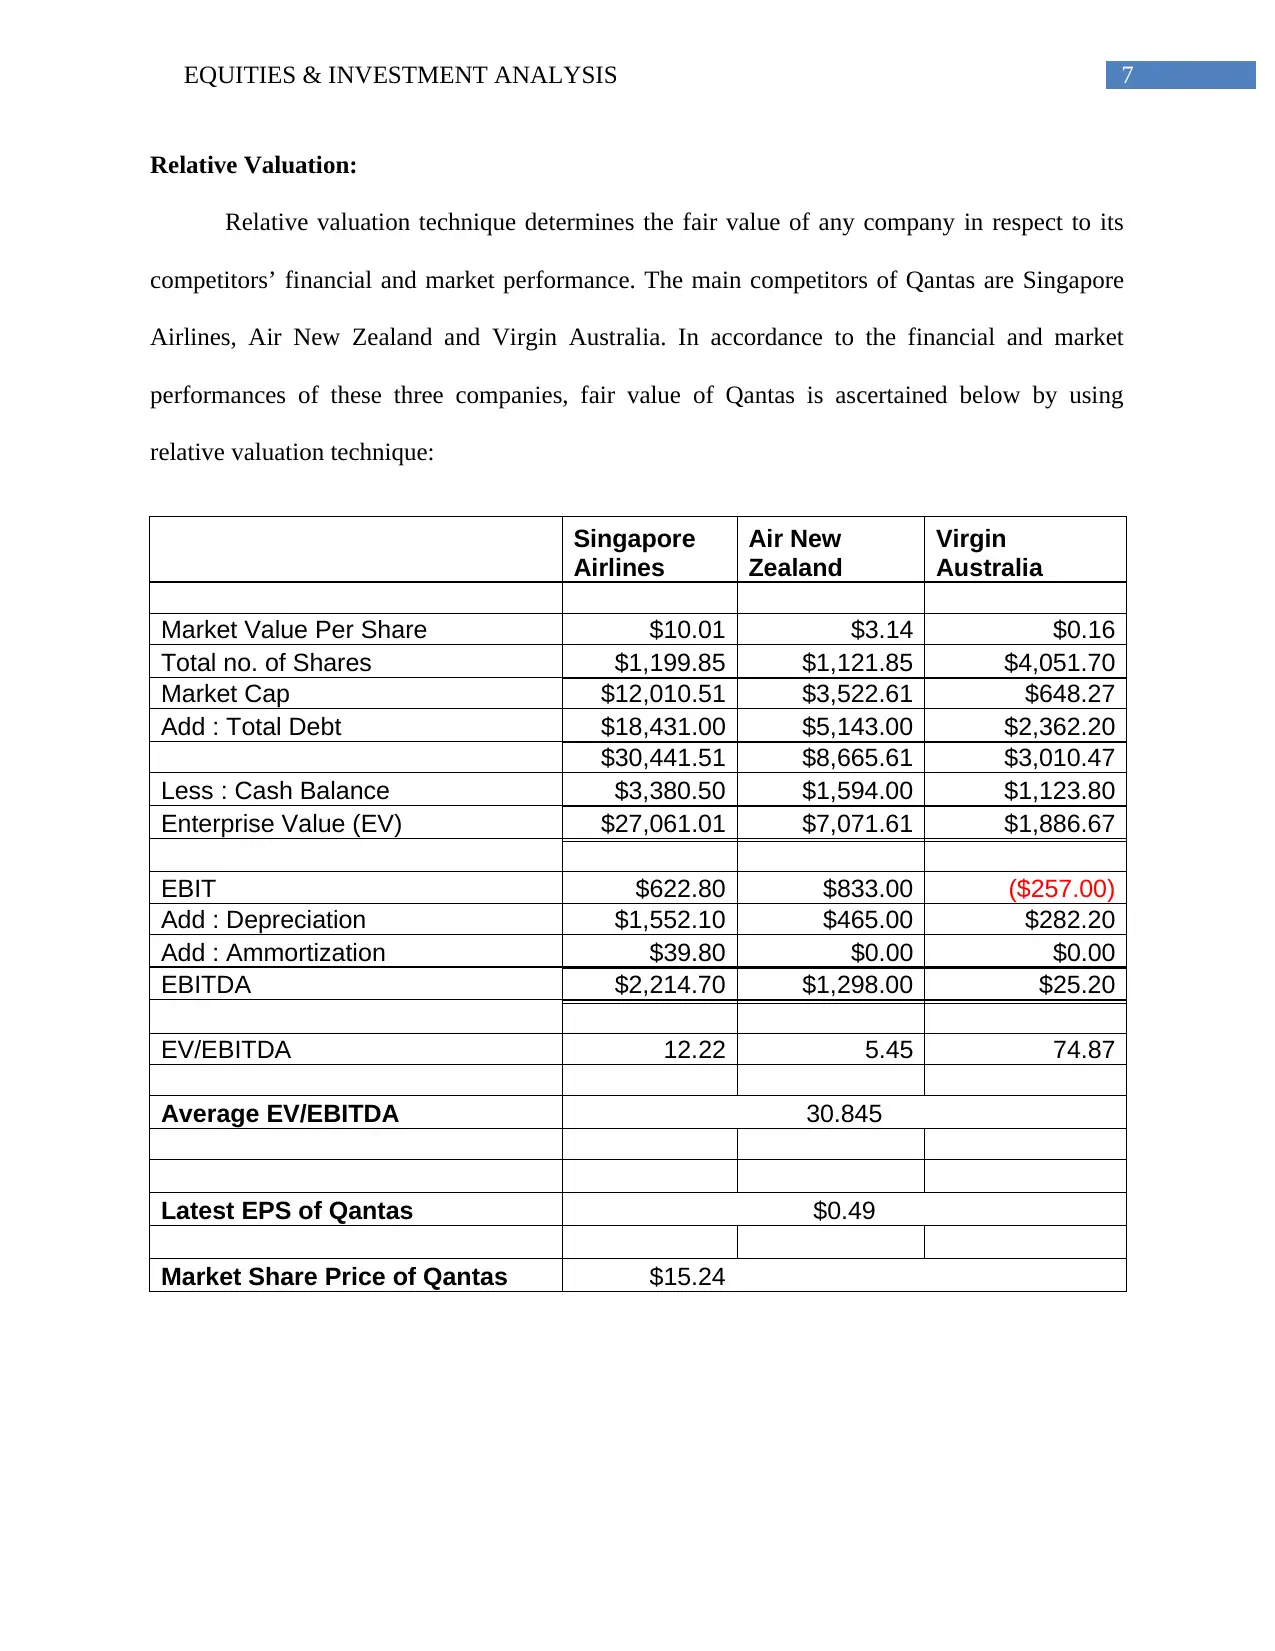
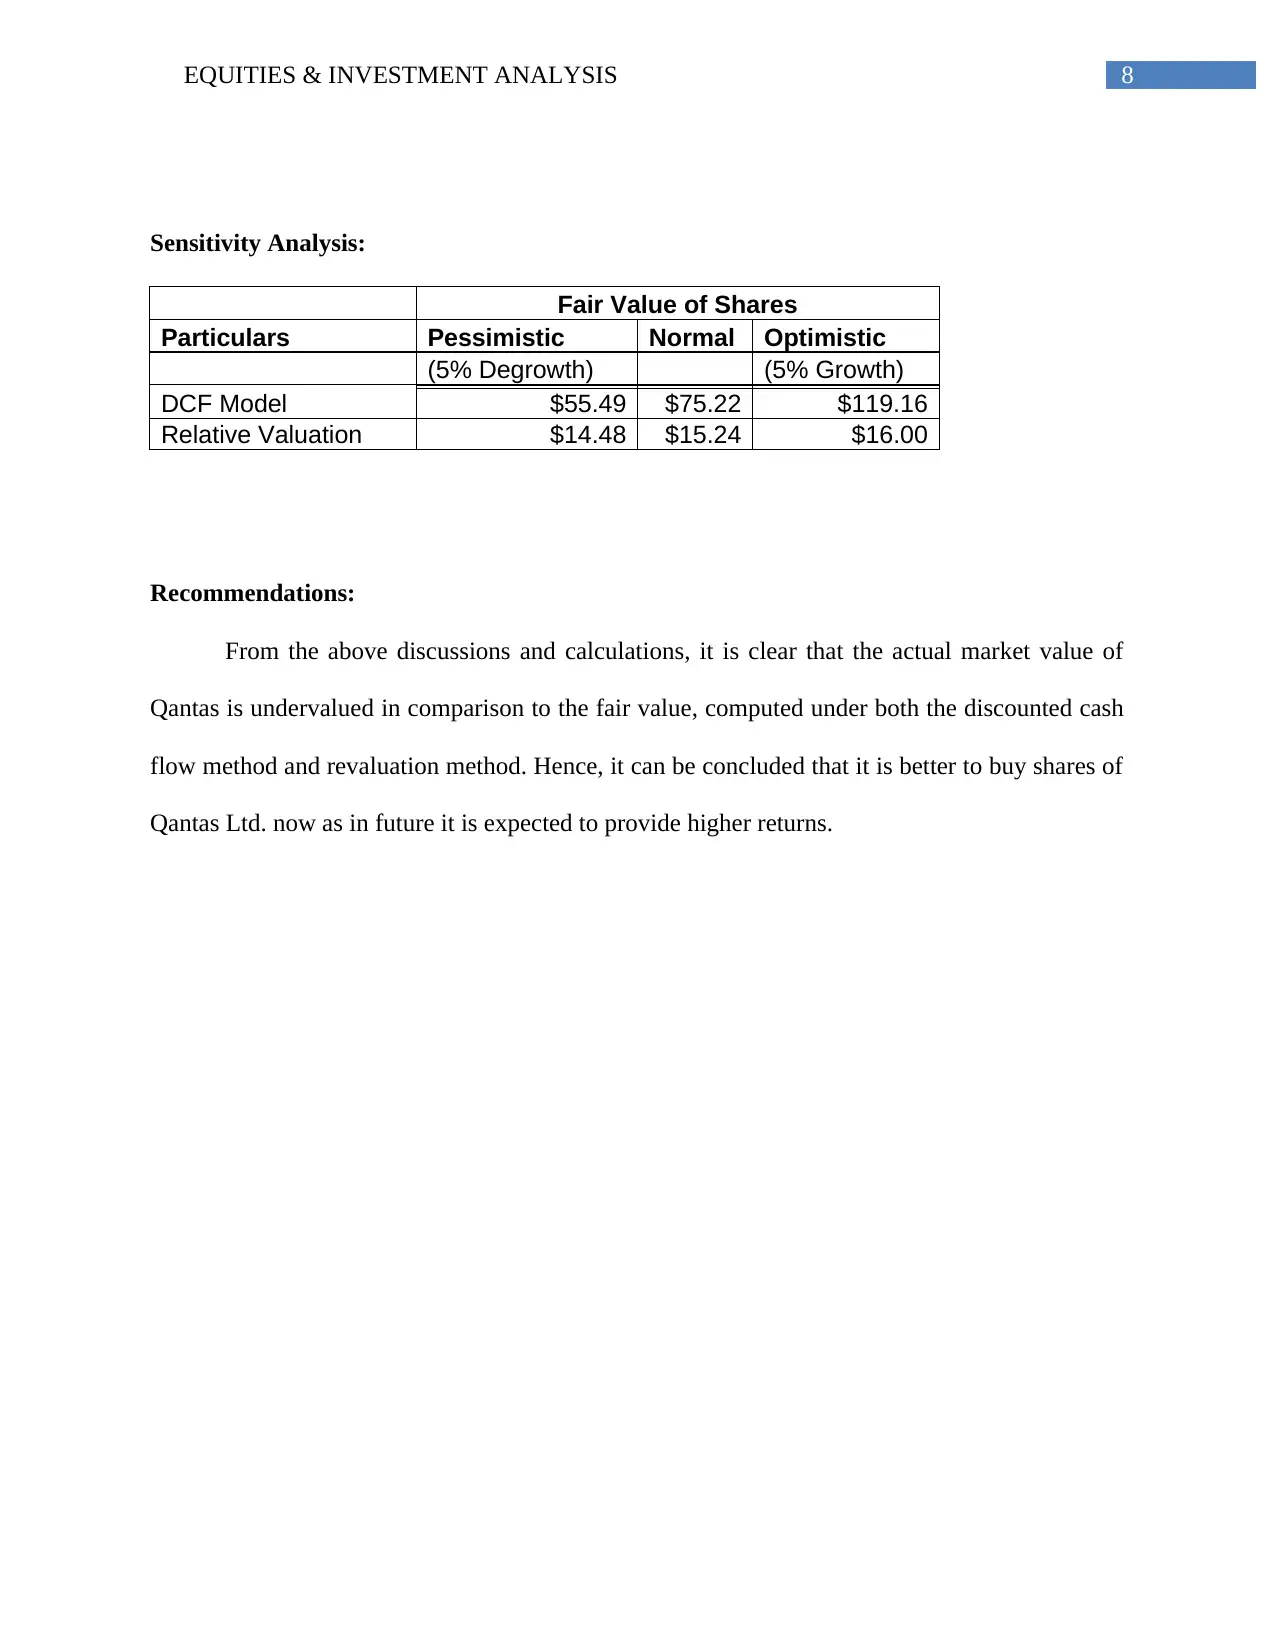
This report provides a comprehensive equities and investment analysis of Qantas Airways. It begins with an introduction to the company and evaluates its business prospects, considering macro-economic and industry-level factors. The analysis includes an assessment of Qantas's strategic position using Porter's Five Forces model. Financial forecasting is performed, calculating average growth rates and projecting free cash flows for the next three years. The report then delves into valuation analysis, employing both the Discounted Cash Flow (DCF) method and relative valuation techniques, comparing Qantas to its competitors. Sensitivity analysis is conducted to assess the impact of different growth scenarios on the fair value of the shares. The report concludes with investment recommendations based on the findings, suggesting that Qantas shares are undervalued in the market. References and bibliography are also included.

Running head: EQUITIES & INVESTMENT ANALYSIS
Equities & Investment Analysis
Name of the Student:
Name of the University:
Author’s Note:
Equities & Investment Analysis
Name of the Student:
Name of the University:
Author’s Note:
Paraphrase This Document
Need a fresh take? Get an instant paraphrase of this document with our AI Paraphraser

1EQUITIES & INVESTMENT ANALYSIS
Table of Contents
Introduction:....................................................................................................................................2
Evaluation of Business Prospect:.....................................................................................................2
Macro-Economic Factors:...........................................................................................................2
Industry Level Factors:................................................................................................................3
Analysis of Qantas’s Strategic Position:..........................................................................................3
Financial Forecast:...........................................................................................................................4
Average Growth Rate Computation:...........................................................................................4
Financial Forecasting:..................................................................................................................5
Valuation Analysis:.........................................................................................................................5
Discounted Cash Flow Method:..................................................................................................6
Relative Valuation:......................................................................................................................7
Sensitivity Analysis:....................................................................................................................8
Recommendations:..........................................................................................................................8
References & Bibliography:............................................................................................................9

2EQUITIES & INVESTMENT ANALYSIS
Introduction:
Qantas Airways is one of the oldest airlines companies in the world. The company was
established in 1920 and has become the largest airline company in terms of fleet size and
international destinations. As per the reports, 14.9% passengers in and out of Australia use to
travel by Qantas Airways. The main base of the company is situated at Mascot, Sydney and its
main hub is in Sydney Airport. Qantas also operates a low-cost airline brand, under the brand
name, Jetstar Airways and owns Jetconnect Airlines.
Evaluation of Business Prospect:
The prospect on any business sector depends on various factors. Based on the
characteristics and impacts of the factors, it can be classified into two segments:
Macro-Economic Factors:
The macro-economic factors, which have significant impact on the airlines industry are
as follows:
- Political & Legal Factors
- Economic Factor
- Social & Demographic Factor
- Technological & Environmental Factor
Except for political & legal factors, all other factors are currently favorable for airlines
industry. Regarding political and legal factors, the Australian government supports the airlines
industry greatly, though, in some countries, the political factors are not very favorable for
Australian airline industry (Isaac and O'Leary 2013).
⊘ This is a preview!⊘
Do you want full access?
Subscribe today to unlock all pages.

Trusted by 1+ million students worldwide

3EQUITIES & INVESTMENT ANALYSIS
Industry Level Factors:
The following internal factors affect the operation and prospect of airlines industry
highly:
- Fleet Plans
- Marketing Strategies
- Labor Relations
- Other Costs
Analysis of Qantas’s Strategic Position:
The strategic position of Qantas Airlines is analyzed through Porter 5 Forces Model
below:
Paraphrase This Document
Need a fresh take? Get an instant paraphrase of this document with our AI Paraphraser

4EQUITIES & INVESTMENT ANALYSIS
Financial Forecast:
It is assumed that Qantas Airlines would maintain the average growth rates in the next 3
years. On the basis of this assumptions, the free cash flows of the company for the next years are
calculated below:
Average Growth Rate Computation:
Free Cash Flows (FCFs) 2016 2015 2014 2013 2012 2011
($M) ($M) ($M) ($M) ($M) ($M)
Net Income/(Loss) Before Tax 1,029 560 (2,843) 2 (244)
Add Depreciation 1,224 1,096 1,422 1,450 1,384
Add Interest Expenses 284 349 286 296 357
Total EBIT 2,537 2,005 (1,135) 1,748 1,497
EBIT Growth Rate using CAGR 11.13%
Current Assets 3,458 5,049 4,932 4,961 5,167 5,641
Add (Subtract) - Decrease(Increase) in
Current Assets (given) 1,591 (117) 29 206 474
Current Assets' Growth Rate using CAGR 27.40%
Plant, Machinery & Equipment 11,670 10,715 10,500 13,827 14,139 13,652
Add (Subtract) - Decrease(Increase) in Plant,
Machinery & Equipment (given) (955) (215) 3,327 312 (487)
PPE Growth Rate using CAGR 14.42%
Current Liabilities 7,028 7,470 7,525 6,647 7,427 6,235
Add (Subtract) - Increase (Decrease) in
Current Liabilities (given) (442) (55) 878 (780) 1,192
Current Liabilities' Growth Rate using CAGR -182.00%

5EQUITIES & INVESTMENT ANALYSIS
Financial Forecasting:
Free Cash Flows
(FCFs)
Growt
h Rate 2016 A 2017 F 2018 F 2019 F
EBIT 11.13% 2,537 2,819 3,133 3,482
Add (Subtract) -
Decrease(Increase) in
Current Assets (given) 27.40% 1,591 2,027 2,582 3,290
Add (Subtract) -
Decrease(Increase) in Plant,
Machinery & Equipment
(given) 14.42% (955) (1,093) (1,250) (1,431)
Add (Subtract) - Increase
(Decrease) in Current
Liabilities (given)
-
182.00
% (442) 362 (297) 244
Free Cash Flows (FCFs) -
TOTAL 2,731 4,116 4,168 5,585
Valuation Analysis:
Valuation analysis is the method, used to evaluate the intrinsic value of any asset,
business or investment. There are various techniques, which are applied for evaluating the
intrinsic value. In this scenario, the fair value of Qantas Airlines’ stocks is computed under two
methods, Discounted Cash Flow method and Relative Valuation method (Kragt 2014).
⊘ This is a preview!⊘
Do you want full access?
Subscribe today to unlock all pages.

Trusted by 1+ million students worldwide

6EQUITIES & INVESTMENT ANALYSIS
Discounted Cash Flow Method:
In DCF method, the intrinsic value of the shares is computed on the basis of the present
values of future cash flows, generated from the stock. The fair value of Qantas is computed
below under this method:
WACC (Extracted from WACC "sheet") 13.95%
FCF Growth, after year 5 using CAGR formula 10.71%
Terminal FCF 5,585
Terminal Value (Gordon
Model) 190,888
2016 A 2017 F 2018 F 2019 F
FCF 2,731 4,116 4,168 5,585
Terminal Value 190,888
Total Free Cash
Flow 2,731 4,116 4,168 196,473
DCF using WACC
WAC
C
13.95
% 2,731.00 3,612.23 3,210.09 132,798.72
Total DCF for the Period 142,352.04
Add: Closing Cash Balance on 2016 1,980.00
Less:Non-Controlling Interest on
2016 (5.00)
Equity Value (PV) 144,327.04
No. of Outstanding shares 1,918.80
Fair Value per share 75.22
Paraphrase This Document
Need a fresh take? Get an instant paraphrase of this document with our AI Paraphraser

7EQUITIES & INVESTMENT ANALYSIS
Relative Valuation:
Relative valuation technique determines the fair value of any company in respect to its
competitors’ financial and market performance. The main competitors of Qantas are Singapore
Airlines, Air New Zealand and Virgin Australia. In accordance to the financial and market
performances of these three companies, fair value of Qantas is ascertained below by using
relative valuation technique:
Singapore
Airlines
Air New
Zealand
Virgin
Australia
Market Value Per Share $10.01 $3.14 $0.16
Total no. of Shares $1,199.85 $1,121.85 $4,051.70
Market Cap $12,010.51 $3,522.61 $648.27
Add : Total Debt $18,431.00 $5,143.00 $2,362.20
$30,441.51 $8,665.61 $3,010.47
Less : Cash Balance $3,380.50 $1,594.00 $1,123.80
Enterprise Value (EV) $27,061.01 $7,071.61 $1,886.67
EBIT $622.80 $833.00 ($257.00)
Add : Depreciation $1,552.10 $465.00 $282.20
Add : Ammortization $39.80 $0.00 $0.00
EBITDA $2,214.70 $1,298.00 $25.20
EV/EBITDA 12.22 5.45 74.87
Average EV/EBITDA 30.845
Latest EPS of Qantas $0.49
Market Share Price of Qantas $15.24

8EQUITIES & INVESTMENT ANALYSIS
Sensitivity Analysis:
Fair Value of Shares
Particulars Pessimistic Normal Optimistic
(5% Degrowth) (5% Growth)
DCF Model $55.49 $75.22 $119.16
Relative Valuation $14.48 $15.24 $16.00
Recommendations:
From the above discussions and calculations, it is clear that the actual market value of
Qantas is undervalued in comparison to the fair value, computed under both the discounted cash
flow method and revaluation method. Hence, it can be concluded that it is better to buy shares of
Qantas Ltd. now as in future it is expected to provide higher returns.
⊘ This is a preview!⊘
Do you want full access?
Subscribe today to unlock all pages.

Trusted by 1+ million students worldwide

9EQUITIES & INVESTMENT ANALYSIS
References & Bibliography:
Isaac, D. and O'Leary, J., 2013. Property valuation techniques. Palgrave Macmillan
Koller, T., Goedhart, M. and Wessels, D., 2015. Valuation: measuring and managing the value of
companies
Kragt, M.E., 2014. Eliciting stakeholder preferences through nonmarket valuation techniques
McNeil, A.J., Frey, R. and Embrechts, P., 2015. Quantitative risk management: Concepts,
techniques and tools. Princeton university press
1 out of 10
Related Documents

Your All-in-One AI-Powered Toolkit for Academic Success.
+13062052269
info@desklib.com
Available 24*7 on WhatsApp / Email
Unlock your academic potential
Copyright © 2020–2025 A2Z Services. All Rights Reserved. Developed and managed by ZUCOL.